 Duplex
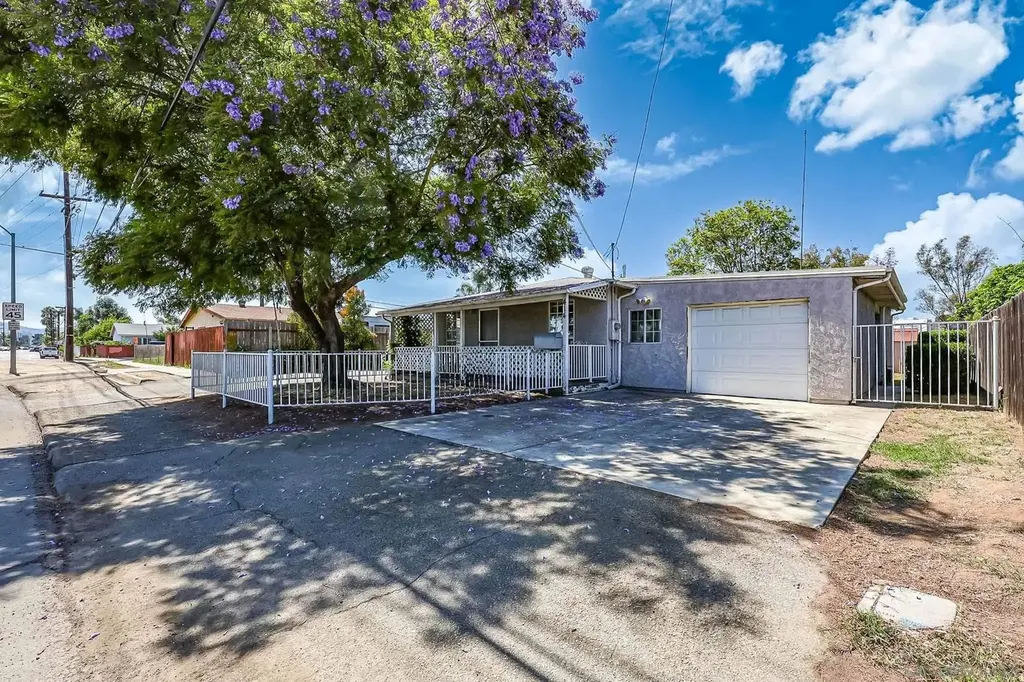
414 E Lincoln Ave · Escondido, CA
Flood risk 4/10 · Minor
- FEMA flood zone
- X (unshaded)
- Chance of flooding over 30 yrs
- 0.22%
- Est. flood insurance / yr
- $507 – $1,088
Fire risk 2/10 · Minimal
- Est. fire insurance / yr
- $659 – $1,223
Heat risk 6/10 · Moderate
- Hot days now (above 98°F)
- 7 days/yr
- Hot days in 30 yrs
- 21 days/yr
Wind risk 1/10 · Minimal
- Chance of severe wind over 30 yrs
- —
Air-quality risk 4/10 · Minor
- Unhealthy air days now
- 5 days/yr
- Unhealthy air days in 30 yrs
- 5 days/yr
Risk factors via First Street. Map © Google.
Why this score? — see what drove the D grade
The composite is a weighted blend of 9 inputs, each scored 0–100. Each bar is that input's sub-score; the figure is the points it added to the 100-point composite (weight × sub-score).
- Cash flow +14.5/30.0
- ARV discount +7.5/15.0
- DSCR +4.4/10.0
- Livability +3.5/5.0
- Schools +3.3/10.0
- Rent growth +2.8/5.0
- 1% rule +2.7/10.0
- Condition / age +2.5/5.0
- Appreciation +0.0/10.0
$695,000
🖨 Deal sheet 📄 Offer letter ✓ Due diligence
Multi-family units
County records classify this as Multi-Family (2-4 Unit). Listing-text estimate: 2 units. confirmed
Listing remarks
Opportunity knocks, and it brought a guest house! This one-of-a-kind Escondido property delivers rare flexibility with a 2-bedroom, 2-bath main home featuring a dedicated office plus a 1-bedroom/1-bath detached ADU, each with its own separate entrance and its own identity. For the investor: Two units, one lot, one smart acquisition. Live in one, rent the other, or rent both. The ADU means no gray area, no red tape, just immediate income potential from day one. With Escondido’s rental demand and this property’s central location, the numbers work. A clean slate on both units means you customize finishes, control costs, and maximize your return on your timeline. For the multi
Key facts
- Separate entrance
- Detached adu
- Central location
Tags
Property features AI
Exterior
- Home design: Single-story multi-family residential income property; Stucco exterior
- Construction: Stucco construction; Composition roof; One story
- Exterior features: Gated fencing
Interior
- Bathrooms: Three full bathrooms
- Heating & cooling: Wall/Window cooling unit(s)
- Interior features: Wall/Window cooling unit(s)
Neighborhood map
What this means for you Summary
Snapshot
- This is a 2 × 3-bed/3.0-bath units multifamily listed at $695k.
Deal economics
- At list price, monthly cash flow is $151 ($2k/yr) — positive. Per door: $76/mo.
- The deal already cash-flows at list — no discount required.
- To meet the 1% rule (rent ≥ 1% of price), the offer needs to be $533k (23.3% below list).
- Recommended offer: $533k (23.3% below list) — sets the bar for 1% rule.
- Cap rate 6.6% vs local median 2.5% in Escondido — top-decile yield for the area; either an underpriced asset or a hidden risk that comps aren't pricing in. Stress-test before assuming the spread holds.
Location & tenants
- Location reads 70/100 on livability (#238 in CA) — a middle-class / working-renter tenant base. Strengths: amenities A+, commute A+, employment B; Watch: health & safety C-, schools D+, crime D+.
- Escondido Union High (suburban): math 19% / reading 56% proficiency, ranked #247 of 517 in CA (top 48%) — families likely to look elsewhere, expect single-tenant / working-renter base with shorter leases.
- Market conditions: Rents rising (+1.0%/yr); 227 active listings in the ZIP; 22 comparable units currently listed for rent nearby; rentals leasing fast (median 2d on market — plan ~1-2 weeks tenant-placement turnaround); solid renter incomes; 11,759 units permitted in San Diego County in 2024 (7,244 in 5+ unit buildings).
- At $5,331/mo this rent would consume 61% of the median local household income ($105k/yr) (locally 2319% of renters already pay >50% of income on rent) — very limited rent-growth headroom before tenants either downsize or default.
Forward outlook
- Local home prices are declining (-3.0%/yr); year-one equity from $5k of loan paydown is wiped out by about $21k of value loss. Plan a longer hold.
- San Diego County population projected at +20% by 2050 — long-run rental-demand tailwind backs the buy-and-hold thesis.
Negotiation context
- It's been on market 26 days — a 2% lower offer ($685k) is reasonable based on typical stale-listing flexibility.
- Current owner paid $75k; list at $695k implies a 827% gain — meaningful room to come down on a strong offer.
Risks & watch-outs
- Watch-outs: built in 1935 — expect roof / HVAC / electrical / plumbing capex.
- Climate carrying-cost: extreme-heat days projected 7→21/yr by 2055 (HVAC capex compounding) — expect insurance premiums to compound above CPI over the hold.
Questions for the listing agent
- Can we see the unit-by-unit rent roll, current vacancy, and any below-market leases? What's the average tenancy length?
- What capital expenditures (roof, boiler, parking lot, exteriors) have been made in the last 5 years, and what's planned in the next 2?
- Built in 1935 — when were the roof, HVAC, electrical panel, plumbing, and water heater last replaced?
- Is there a deadline driving the sale (1031 exchange, divorce, estate, relocation)? That informs how much negotiation room exists.
- Schools are D-rated, which usually means shorter tenancies and higher turnover. Who's the typical renter profile here, and what's been the actual vacancy rate?
- Crime grade is D in this area — have there been break-ins, vandalism, or insurance claims at this property in the last 3 years? What carrier currently insures it and at what premium?
- The area grade is low — what's the realistic commute time and amenity access for the typical tenant pool here? Any planned neighborhood developments (good or bad) we should know about?
- What's the average days-on-market for RENTAL listings here right now (not sales)? A rising rental-DOM trend means longer vacancies and softer asking-rent achievability than the comps imply.
- What's the recent tenant-quality profile in this submarket — average credit score on applications, eviction rate, late-payment / NSF rate, and stable-employment percentage? A property-management company in the area should have these aggregated.
- How much new apartment / multifamily construction is in the pipeline within 1–3 miles? Heavy new supply (>2% of stock underway) typically softens rents 12–24 months out; light construction supports rent growth.
Investment metrics
- 1% rule
- 0.77% ✗
- Cap rate
- 6.55%
- Cash-on-cash
- 0.93%
- DSCR
- 1.04
- GRM
- 10.9
CMA / ARV
No comps found within radius.
Projected returns pro-forma
-3.0% appreciation · 1.02% rent growth · sell at horizon
- IRR
- -16.8%
- Equity multiple
- 0.42×
- Total profit
- $-113,770
- Equity at exit
- $103,627
- IRR
- -12.1%
- Equity multiple
- 0.34×
- Total profit
- $-129,255
- Equity at exit
- $60,091
Cash invested: $194,600 (down + closing). Projections, not guarantees.
Landlord ↔ Tenant lean methodology
- Overall (STATE)
- 18 Strongly Tenant-Friendly
- State California
- 18 Strongly Tenant-Friendly · D+13
- County
- — inherits STATE
- City
- — inherits STATE
ZIP-level market 92026
- Rents YoY
- 1.0%
- Active inventory
- 227
- Price-to-rent
- 21.7×
Monthly cashflow live
- Estimated rent
- $5,331 high interval (Pro) →
- Mortgage (P&I)
- −$3,645
- Tax from tax record
- −$126 /mo · $1,511/yr
- Insurance
- −$290
- HOA
- −$0
- Vacancy / Maint / Mgmt
- −$1,120
- Net cashflow
- $151
Break-even live
2-unit breakdown (identical units grouped — click to expand)
| Units | Beds | Baths | Est. rent |
|---|---|---|---|
| 2× units | 3 | 3 | $5,332 |
| #1 | 3 | 3 | $2,666 |
| #2 | 3 | 3 | $2,666 |
| Total (2 units) | $5,331 | ||
UW: 25.0% down · 7.5% · 30yr · 1.5% tax · 5.0% vac · 8.0% maint · 8.0% mgmt
Financing live
Cash to close
- Down payment
- $173,750
- Closing costs
- $20,850
- Reserves months
- —
- Total cash needed
- —
Loan-product check · same deal, 3 products live
Conventional
25% down · 7.5% · 30yr
- Down + closing
- —
- Monthly P&I
- —
- Monthly cashflow
- —
- DSCR
- —
- Eligible?
- —
Personal DTI + credit; lowest rate.
DSCR
20% down · 8.5% · 30yr
- Down + closing
- —
- Monthly P&I
- —
- Monthly cashflow
- —
- DSCR
- —
- Eligible?
- —
No personal income docs; deal must DSCR.
Hard money
10% down · 12.0% · 12mo
- Down + closing
- —
- Monthly P&I
- —
- Monthly cashflow
- —
- DSCR
- —
- Eligible?
- —
Short-term bridge; refi at stabilization.
Rent comps 22 comps
| Address | Beds | Baths | Sqft | Rent | $/sqft | DOM | Units | Dist |
|---|---|---|---|---|---|---|---|---|
| 521 Vicki Pl Escondido, CA | 3.0 | 3.0 | 1644 | $3,688 | $2.24 | 16d | 1 | 0.15mi |
| 832 N Juniper St Escondido, CA | 1.0–3.0 | 1.0–1.5 | 819 | $2,182 | $2.66 | 1d | 9 | 0.21mi |
| 1132 N Broadway Escondido, CA | 3.0 | 2.0 | 1200 | $2,645 | $2.20 | 1d | 1 | 0.26mi |
| 624 E Mission Ave Escondido, CA | 2.0–3.0 | 1.0 | 1010 | $2,484 | $2.46 | 1d | 2 | 0.26mi |
| 1253 Joshua St Escondido, CA | 3.0 | 2.0 | 1366 | $3,500 | $2.56 | 1d | 1 | 0.39mi |
| 776 E Mission Ave Escondido, CA | 2.0–3.0 | 1.0–2.0 | 1050 | $2,397 | $2.28 | 1d | 7 | 0.42mi |
| 1056 N Escondido Blvd Apt E Escondido, CA | 2.0 | 2.0 | 1100 | $2,900 | $2.64 | 10d | 1 | 0.48mi |
| 455 E Washington Ave Escondido, CA | 2.0 | 1.0–2.0 | 832 | $2,450 | $2.94 | 1d | 7 | 0.52mi |
| 919 Sendero Ave Escondido, CA | 3.0 | 2.0 | 1436 | $4,000 | $2.79 | 15d | 1 | 0.54mi |
| 1349 Taft St Escondido, CA | 3.0 | 2.0 | 1170 | $3,495 | $2.99 | 1d | 1 | 0.56mi |
| 1204 N Escondido Blvd Escondido, CA | 1.0–2.0 | 1.0–1.5 | 930 | $2,548 | $2.74 | 1d | 3 | 0.57mi |
| 950 E Washington Ave Escondido, CA | 2.0 | 1.0 | 1200 | $2,750 | $2.29 | 1d | 1 | 0.63mi |
| 1020 E Washington Ave Escondido, CA | 1.0 | 1.0 | 1178 | $1,900 | $1.61 | 1d | 1 | 0.66mi |
| 650 N Centre City Pkwy Escondido, CA | 1.0–2.0 | 1.0–2.0 | 1042 | $3,279 | $3.15 | 1d | 7 | 0.70mi |
| 101 Chamomile Gln Escondido, CA | 1.0–3.0 | 1.0–3.5 | 1315 | $3,773 | $2.87 | 1d | 125 | 0.80mi |
| 1051 Rock Springs Rd #216 Escondido, CA | 3.0 | 2.0 | 1082 | $3,200 | $2.96 | 2d | 1 | 1.12mi |
| 806 E 4th Ave #9 Escondido, CA | 2.0 | 2.0 | 1234 | $3,100 | $2.51 | 1d | 1 | 1.14mi |
| 329 Antoni Gln #1404 Escondido, CA | 2.0 | 2.5 | 1164 | $3,000 | $2.58 | 10d | 1 | 1.23mi |
| 700 W Grand Ave Escondido, CA | 1.0–3.0 | 1.0–3.0 | 1228 | $3,194 | $2.60 | 1d | 10 | 1.26mi |
| 1315 E Grand Ave Escondido, CA | 2.0 | 2.0 | 1120 | $2,400 | $2.14 | 1d | 1 | 1.27mi |
| 1333 E Grand Ave Escondido, CA | 1.0–2.0 | 1.0–2.0 | 914 | $2,800 | $3.06 | 1d | 13 | 1.36mi |
| 505 San Pasqual Valley Rd Escondido, CA | 1.0–2.0 | 1.0–2.5 | 904 | $2,950 | $3.26 | 1d | 1 | 1.42mi |
Listing history 9 events
-
2026-06-08statusdays on market $695,000 Pending 26 DOM
-
2026-06-07days on market $695,000 Active 25 DOM
-
2026-06-04days on market $695,000 Active 22 DOM
-
2026-06-03days on market $695,000 Active 21 DOM
-
2026-06-02days on market $695,000 Active 20 DOM
-
2026-06-01days on market $695,000 Active 19 DOM
-
2026-05-31days on market $695,000 Active 18 DOM
-
2026-05-13$695,000 Active
-
1988-12-22soldstatus $75,000
ⓘ Source: listings_history table (triggers on properties + properties_extension) + one-shot
backfill from property_details.listing_events for pre-trigger history.
Tax reassessment forecast CA · Resets to sale price
- Current annual tax
- $1,511 · $126/mo
- Projected year-2 tax
- $5,282 · $440/mo
- Expected delta
- +$3,771/yr (+$314/mo · 249.7%)
ⓘ Screening estimate from a state-policy table — verify with the county assessor before closing.
Climate risk First Street
- Flood 4/10 Moderate FEMA zone X (unshaded) · 22% chance over 30 yrs
- Wildfire 2/10 Low
- Heat 6/10 Major 7 d/yr ≥98°F today · 21 d/yr by 30 yrs out
- Wind 1/10 Low
- Air quality 4/10 Moderate 5 unhealthy d/yr today · 5 by 30 yrs out
Nearby sold comps map
Loading sold comps map…
Walkable amenities ~0.75 mi
Loading nearby amenities…
Taxation est. · year 1
- Rental income
- $63,972
- − Mortgage interest
- −$38,931
- − Property taxes
- −$1,511
- − Insurance
- −$3,475
- − Repairs & maintenance
- −$5,118
- − Management
- −$5,118
- − Depreciation
- −$20,218
- Taxable loss
- −$10,398
- Est. tax savings @ 24.0%
- +$2,496
- After-tax cash flow
- $4,312/yr
For passive investors: Depreciation is non-cash, so a rental often shows a tax loss while cash-flowing — sheltering income. Rental losses are passive: they offset passive income freely, and up to $25,000/yr can offset ordinary (W-2) income if you actively participate and your MAGI is under $100k (phasing out to $0 by $150k); unused losses carry forward. On sale, claimed depreciation is recaptured at up to 25%, and gains may owe capital-gains tax (a 1031 exchange can defer both). Figures are a year-1 estimate at your 24.0% rate — not tax advice; consult a CPA.
Schools (NCES district)
- District
- Escondido Union High
- NCES district ID
- 0612910
- Math proficiency
- 19% ▼ -2.00%
- Reading proficiency
- 56% ▼ -1.00%
- Median HH income
- $55,731
- Composite
- 32.82/100
- National rank
- #5620
- State rank
- #247 of 517 in CA
Livability — Escondido
- Score
- 70/100
- State rank
- #238
- US rank
- #7829
Category grades
Schools grade is shown separately in the Schools card above.
Census & demographics
- Census place
- Escondido, CA
- County
- San Diego County · 3,178,799 people
- City population
- 177,903
- Metro
- San Diego-Chula Vista-Carlsbad, CA
- Population (ZIP)
- 53,075
- Household income
- $104,561
- Rent vs Own
- Severe rent burden
- 2319.0
Population outlook (San Diego County) Hauer SSP2
- Today (2025)
- 3,678,185 people
- By 2030
- 3,856,546 · +4.8%
- By 2040
- 4,171,407 · +13.4%
- By 2050
- 4,421,607 · +20.2%
- By 2075
- 4,831,599 · +31.4%
- By 2100
- 4,832,502 · +31.4%
Race, ethnicity, and origin ACS 2023
- Neighborhood character
- Diverse neighborhood (Simpson 0.63)
- Race & ethnicity
- White 45% Hispanic / Latino 40% Two or more races 18% Asian 8% Black 2%
- Hispanic origin (detail)
- Mexican 34% Puerto Rican 1%
- Common ancestry
- Italian 2% Lithuanian 2% Portuguese 2%
- Foreign-born
- 23% · Canada, Vietnam, China
- Languages at home
- 65% English-only · Spanish 27% Tagalog/Filipino 2% Other Asian/Pacific 2%
Political lean MEDSL · San Diego
- 2024 margin
- D (+16.8) · D 56.9% · R 40.1% · Other 2.9%
- 2008→2024 swing
- +6.6pp toward D · 2008: 10.2pp · 2024: 16.8pp
- All cycles
- 2024: D+16.8 2020: D+22.8 2016: D+17.8 2012: D+5.1 2008: D+10.2
Not yet ingested
- Civics
- —
Market trends
- HPI YoY
- ▼ -579.23%
- Current HPI
- 348.7205
- Rent YoY
- ▲ 1.02%
- Metro
- San Diego-Chula Vista-Carlsbad, CA
- State GDP YoY
- ▲ 3.21%
- F500 in state
- 116
Industry mix (Fortune 500 HQ in CA)
| Industry | F500 HQs | Revenue |
|---|---|---|
| Technology | 27 | $1,492B |
|
||
| Financial Services | 3 | $174B |
|
||
| Retail | 3 | $44B |
|
||
| Insurance | 3 | $26B |
|
||
| Media / Entertainment | 2 | $115B |
|
||
| Pharmaceuticals / Biotech | 2 | $62B |
|
||
Price history
+826.7% since first listed2 events — show timeline
- 2026-05-13 Listed $695,000 SDMLS
- 1988-12-22 Sold (Public Records) $75,000 Public Records
Property tax history
+2.3%/yrLatest (2025): $1,511 · +2.2% YoY. Source: county tax records.
Cash-flow waterfall
monthlySold comps — $/sqft
last 12 mo · ≤1 miLoading sold comps…