2140 Norwood St St · Reinbeck, IA
Flood risk 1/10 · Minimal
- FEMA flood zone
- X (unshaded)
- Chance of flooding over 30 yrs
- 0.0%
- Est. flood insurance / yr
- $473 – $860
Fire risk 1/10 · Minimal
- Est. fire insurance / yr
- $902 – $1,676
Heat risk 2/10 · Minimal
- Hot days now (above 102°F)
- 7 days/yr
- Hot days in 30 yrs
- 16 days/yr
Wind risk 2/10 · Minimal
- Chance of severe wind over 30 yrs
- —
Air-quality risk 1/10 · Minimal
- Unhealthy air days now
- 0 days/yr
- Unhealthy air days in 30 yrs
- 0 days/yr
Risk factors via First Street. Map © Google.
Why this score? — see what drove the A- grade
The composite is a weighted blend of 9 inputs, each scored 0–100. Each bar is that input's sub-score; the figure is the points it added to the 100-point composite (weight × sub-score).
- Cash flow +30.0/30.0
- DSCR +10.0/10.0
- Appreciation +10.0/10.0
- 1% rule +9.4/10.0
- ARV discount +7.5/15.0
- Schools +5.2/10.0
- Livability +3.5/5.0
- Rent growth +2.5/5.0
- Condition / age +2.5/5.0
$75,000
🖨 Deal sheet 📄 Offer letter ✓ Due diligence
Listing remarks MLS
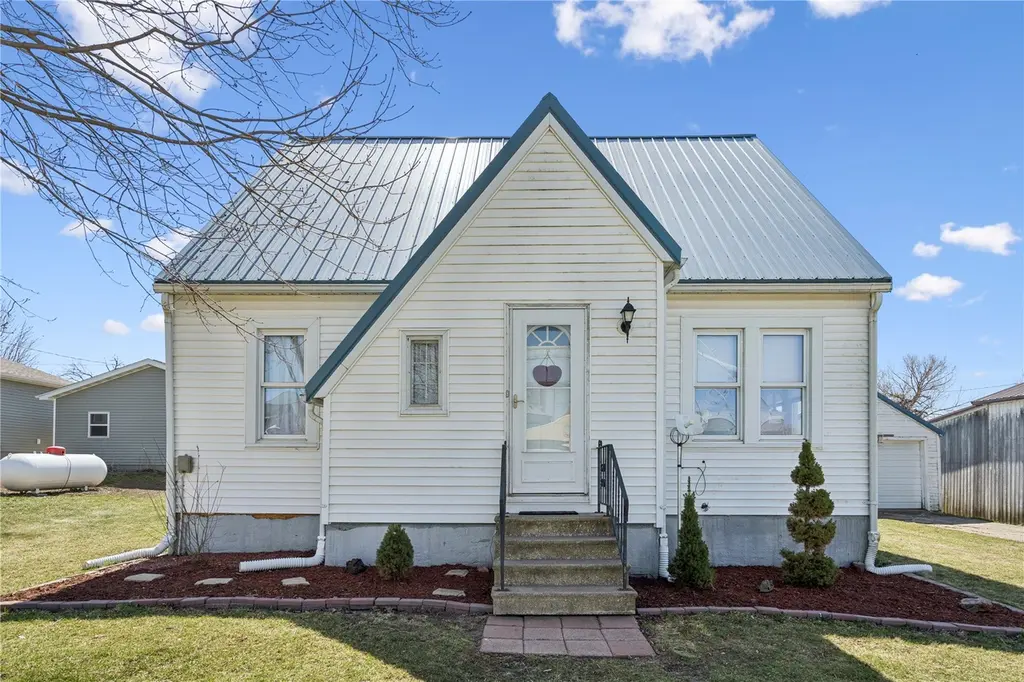
Offer accepted 06-19-2026. Showing for backup offers. This 1.5-story, 3-bedroom, 1-bath home offers a newer metal roof and a detached garage. Inside you will find hardwood floors and original woodwork. The main level includes the primary bedroom, full bathroom, living room, formal dining area, and kitchen. Upstairs, you will find two additional bedrooms providing flexible space.
Key facts
- Flexible space
- Newer metal roof
- Original woodwork
Tags
Neighborhood map
What this means for you Summary
Snapshot
- This is a 3-bed/1.0-bath single-family listed at $75k.
Deal economics
- At list price, monthly cash flow is $360 ($4k/yr) — positive.
- The deal already cash-flows at list — no discount required.
- Meets the 1% rule at list price ($1k rent vs $75k).
- Recommended offer: $70k (6.0% below list) — sets the bar for market timing.
Location & tenants
- Location reads 70/100 on livability (#382 in IA) — a middle-class / working-renter tenant base. Strengths: schools A+, crime A+, cost of living A+; Watch: amenities F, commute F.
- North Tama County Community School District (rural): math 56% / reading 66% proficiency, ranked #234 of 289 in IA (top 81%) — acceptable for families but not a draw, mixed tenant base, ~2y average lease.
- Market conditions: 14 active listings in the ZIP; 17 units permitted in Tama County in 2024 (0 in 5+ unit buildings).
Forward outlook
- In year one you build about $8k of equity ($519 loan paydown + $8k appreciation (10.0% local appreciation)).
- Tama County population projected at -15% by 2050 — secular population decline; favor cash flow + early exit over multi-decade hold.
- At projected returns (10.0% appreciation + 3.0% rent growth), your $21k cash investment doubles in ~2 years — after that, you're playing with house money.
- By year 5, paydown + projected appreciation supports a ~$37k cash-out refi (75% LTV) — recoverable capital for the next deal without selling this one.
Negotiation context
- It's been on market 78 days — a 6% lower offer ($70k) is reasonable based on typical stale-listing flexibility.
- 2 sale attempts since 8y ago; this cycle's ask has dropped $6k (8%) from the opening price — seller is motivated, your offer sets the floor, not the list.
- Current owner paid $22k; list at $75k implies a 233% gain — meaningful room to come down on a strong offer.
Risks & watch-outs
- Watch-outs: built in 1950 — expect roof / HVAC / electrical / plumbing capex.
Questions for the listing agent
- It's been on market 78 days. Have you received any prior offers? Is the seller open to a 6% concession, seller financing, or rate buy-down credit?
- Built in 1950 — when were the roof, HVAC, electrical panel, plumbing, and water heater last replaced?
- Why hasn't it sold? Are there any deal-killer items the seller is aware of (foundation, flood, title, zoning, code violations)?
- Is there a deadline driving the sale (1031 exchange, divorce, estate, relocation)? That informs how much negotiation room exists.
- Schools are A-rated — typically a magnet for longer-tenancy family renters. What's the average tenant stay here, and is there a school-zone premium baked into asking?
- What's the average days-on-market for RENTAL listings here right now (not sales)? A rising rental-DOM trend means longer vacancies and softer asking-rent achievability than the comps imply.
- What's the recent tenant-quality profile in this submarket — average credit score on applications, eviction rate, late-payment / NSF rate, and stable-employment percentage? A property-management company in the area should have these aggregated.
- How much new for-sale + rental construction is in the pipeline within 1–3 miles? Heavy new supply typically softens prices + rents 12–24 months out; constrained supply supports both.
Investment metrics
- 1% rule
- 1.44% ✓
- Cap rate
- 12.05%
- Cash-on-cash
- 20.55%
- DSCR
- 1.91
- GRM
- 5.8
CMA / ARV
No comps found within radius.
Projected returns pro-forma
10.0% appreciation · 3.0% rent growth · sell at horizon
- IRR
- 39.6%
- Equity multiple
- 4.04×
- Total profit
- $63,752
- Equity at exit
- $67,566
- IRR
- 34.1%
- Equity multiple
- 9.08×
- Total profit
- $169,733
- Equity at exit
- $145,709
Cash invested: $21,000 (down + closing). Projections, not guarantees.
Landlord ↔ Tenant lean methodology
- Overall (STATE)
- 83 Strongly Landlord-Friendly
- State Iowa
- 83 Strongly Landlord-Friendly · R+6
- County
- — inherits STATE
- City
- — inherits STATE
ZIP-level market 50669
- Home prices YoY
- 4.9%
- Active inventory
- 14
- Price-to-rent
- 5.8×
Monthly cashflow live
- Estimated rent
- $1,082 medium interval (Pro) →
- Mortgage (P&I)
- −$393
- Tax from tax record
- −$71 /mo · $848/yr
- Insurance
- −$31
- HOA
- −$0
- Vacancy / Maint / Mgmt
- −$227
- Net cashflow
- $360
Break-even live
UW: 25.0% down · 7.5% · 30yr · 1.5% tax · 5.0% vac · 8.0% maint · 8.0% mgmt
Financing live
Cash to close
- Down payment
- $18,750
- Closing costs
- $2,250
- Reserves months
- —
- Total cash needed
- —
Loan-product check · same deal, 3 products live
Conventional
25% down · 7.5% · 30yr
- Down + closing
- —
- Monthly P&I
- —
- Monthly cashflow
- —
- DSCR
- —
- Eligible?
- —
Personal DTI + credit; lowest rate.
DSCR
20% down · 8.5% · 30yr
- Down + closing
- —
- Monthly P&I
- —
- Monthly cashflow
- —
- DSCR
- —
- Eligible?
- —
No personal income docs; deal must DSCR.
Hard money
10% down · 12.0% · 12mo
- Down + closing
- —
- Monthly P&I
- —
- Monthly cashflow
- —
- DSCR
- —
- Eligible?
- —
Short-term bridge; refi at stabilization.
Listing history 20 events
-
2026-06-18days on market $75,000 Active 78 DOM
-
2026-06-17days on market $75,000 Active 77 DOM
-
2026-06-16days on market $75,000 Active 76 DOM
-
2026-06-15days on market $75,000 Active 75 DOM
-
2026-06-13days on market $75,000 Active 73 DOM
-
2026-06-12days on market $75,000 Active 72 DOM
-
2026-06-09days on market $75,000 Active 69 DOM
-
2026-06-08days on market $75,000 Active 68 DOM
-
2026-06-07days on market $75,000 Active 67 DOM
-
2026-06-07days on market $75,000 Active 66 DOM
-
2026-06-04days on market $75,000 Active 63 DOM
-
2026-06-02days on market $75,000 Active 62 DOM
-
2026-06-01days on market $75,000 Active 61 DOM
-
2026-05-31days on market $75,000 Active 60 DOM
-
2026-05-31days on market $75,000 Active 59 DOM
-
2026-04-30price $75,000 381-char remark
Show marketing remark (381 chars)
Offer accepted 06-19-2026. Showing for backup offers. This 1.5-story, 3-bedroom, 1-bath home offers a newer metal roof and a detached garage. Inside you will find hardwood floors and original woodwork. The main level includes the primary bedroom, full bathroom, living room, formal dining area, and kitchen. Upstairs, you will find two additional bedrooms providing flexible space.
-
2026-04-01$81,500 Active 381-char remark
Show marketing remark (381 chars)
Offer accepted 06-19-2026. Showing for backup offers. This 1.5-story, 3-bedroom, 1-bath home offers a newer metal roof and a detached garage. Inside you will find hardwood floors and original woodwork. The main level includes the primary bedroom, full bathroom, living room, formal dining area, and kitchen. Upstairs, you will find two additional bedrooms providing flexible space.
-
2019-05-31soldstatus $22,500 287-char remark
Show marketing remark (287 chars)
1 Story House in Dinsdale, but address is actually Reinbeck, in Tama County. 1 Bedroom and Bathroom in Main level with formal dinning, living-room, Kitchen with stove and Refrigerator, 2 more Bedrooms upstairs, one garage and basement with washer and dryer. Vinyl Siding and Central air.
-
2018-11-16$29,900 287-char remark
Show marketing remark (287 chars)
1 Story House in Dinsdale, but address is actually Reinbeck, in Tama County. 1 Bedroom and Bathroom in Main level with formal dinning, living-room, Kitchen with stove and Refrigerator, 2 more Bedrooms upstairs, one garage and basement with washer and dryer. Vinyl Siding and Central air.
-
2014-05-12soldstatus $44,500
ⓘ Source: listings_history table (triggers on properties + properties_extension) + one-shot
backfill from property_details.listing_events for pre-trigger history.
Tax reassessment forecast IA · Partial reset (capped growth)
- Current annual tax
- $848 · $71/mo
- Projected year-2 tax
- $1,013 · $84/mo
- Expected delta
- +$165/yr (+$14/mo · 19.4%)
ⓘ Screening estimate from a state-policy table — verify with the county assessor before closing.
Climate risk First Street
- Flood 1/10 Low FEMA zone X (unshaded) · 0% chance over 30 yrs
- Wildfire 1/10 Low
- Heat 2/10 Low 7 d/yr ≥102°F today · 16 d/yr by 30 yrs out
- Wind 2/10 Low
- Air quality 1/10 Low 0 unhealthy d/yr today · 0 by 30 yrs out
Nearby sold comps map
Loading sold comps map…
Walkable amenities ~0.75 mi
Loading nearby amenities…
Taxation est. · year 1
- Rental income
- $12,985
- − Mortgage interest
- −$4,201
- − Property taxes
- −$848
- − Insurance
- −$375
- − Repairs & maintenance
- −$1,039
- − Management
- −$1,039
- − Depreciation
- −$2,182
- Taxable income
- $3,301
- Est. tax owed @ 24.0%
- −$792
- After-tax cash flow
- $3,523/yr
For passive investors: Depreciation is non-cash, so a rental often shows a tax loss while cash-flowing — sheltering income. Rental losses are passive: they offset passive income freely, and up to $25,000/yr can offset ordinary (W-2) income if you actively participate and your MAGI is under $100k (phasing out to $0 by $150k); unused losses carry forward. On sale, claimed depreciation is recaptured at up to 25%, and gains may owe capital-gains tax (a 1031 exchange can defer both). Figures are a year-1 estimate at your 24.0% rate — not tax advice; consult a CPA.
Schools (NCES district)
- District
- North Tama County Community School District
- NCES district ID
- 1921000
- Math proficiency
- 56% ▼ -14.00%
- Reading proficiency
- 66% ▲ 2.00%
- Median HH income
- $52,332
- Composite
- 52.09/100
- National rank
- #1627
- State rank
- #234 of 289 in IA
Livability — Reinbeck
- Score
- 70/100
- State rank
- #382
- US rank
- #8130
Category grades
Schools grade is shown separately in the Schools card above.
Census & demographics
- Population (ZIP)
- 2,447
Population outlook (Tama County) Hauer SSP2
- Today (2025)
- 16,690 people
- By 2030
- 16,217 · -2.8%
- By 2040
- 15,207 · -8.9%
- By 2050
- 14,186 · -15.0%
- By 2075
- 12,228 · -26.7%
- By 2100
- 10,386 · -37.8%
Race, ethnicity, and origin ACS 2023
- Neighborhood character
- Predominantly White (95%)
- Race & ethnicity
- White 95% Hispanic / Latino 3% Two or more races 3% Native American 1%
- Common ancestry
- Portuguese 3% Slovak 1% Iranian 1%
- Foreign-born
- 2% · Canada
- Languages at home
- 98% English-only · Spanish 1%
Political lean MEDSL · Tama
- 2024 margin
- Strong R (+26.9) · D 35.7% · R 62.6% · Other 1.7%
- 2008→2024 swing
- -39.1pp toward R · 2008: 12.2pp · 2024: -26.9pp
- All cycles
- 2024: R+26.9 2020: R+19.1 2016: R+20.6 2012: D+7.4 2008: D+12.2
Not yet ingested
- Civics
- —
Market trends
- HPI YoY
- ▲ 11.93%
- Current HPI
- 257.04
- Rent YoY
- —
- Metro
- —
- State GDP YoY
- ▲ 2.48%
- F500 in state
- 4
Industry mix (Fortune 500 HQ in IA)
| Industry | F500 HQs | Revenue |
|---|---|---|
| Financial Services | 1 | $16B |
|
||
| Retail / Convenience | 1 | $15B |
|
||
Price history
+68.5% since first listed5 events — show timeline
- 2026-04-30 Price Changed $75,000 CRAAR, CDRMLS
- 2026-04-01 Listed $81,500 CRAAR, CDRMLS
- 2019-05-31 Sold (MLS) $22,500 IAR
- 2018-11-16 Listed $29,900 IAR
- 2014-05-12 Sold (Public Records) $44,500 Public Records
Property tax history
+8.4%/yrLatest (2025): $848 · +10.1% YoY. Source: county tax records.
Cash-flow waterfall
monthlySold comps — $/sqft
last 12 mo · ≤1 miLoading sold comps…