 Triplex
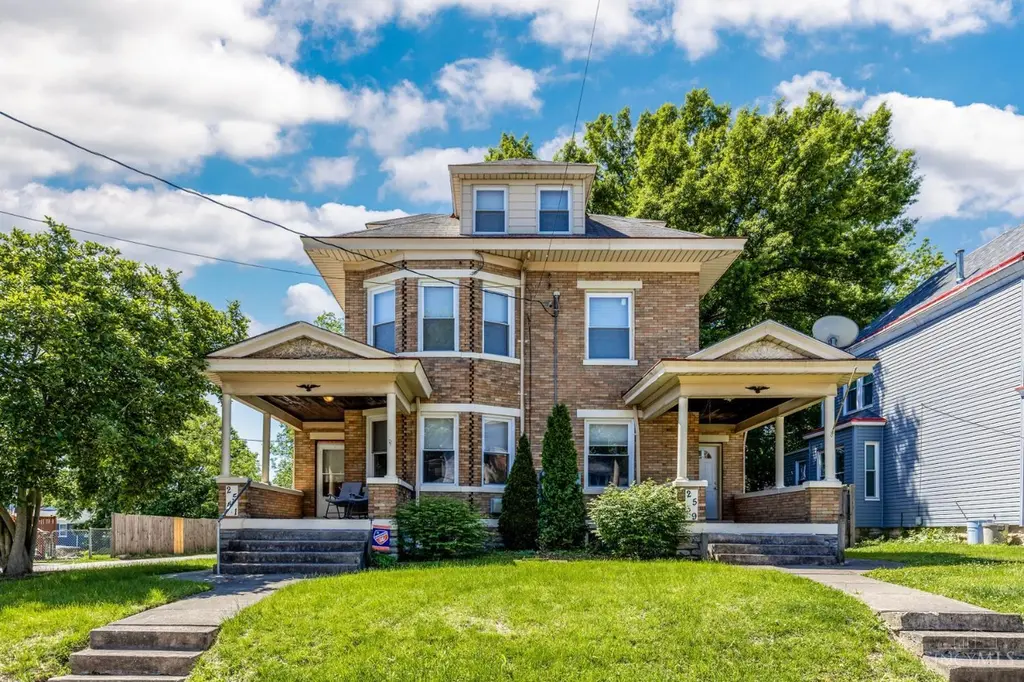
2541 Melrose Ave · Norwood, OH
Flood risk 1/10 · Minimal
- FEMA flood zone
- X (unshaded)
- Chance of flooding over 30 yrs
- 0.0%
- Est. flood insurance / yr
- $473 – $860
Fire risk 1/10 · Minimal
- Est. fire insurance / yr
- $713 – $1,323
Heat risk 5/10 · Moderate
- Hot days now (above 103°F)
- 7 days/yr
- Hot days in 30 yrs
- 19 days/yr
Wind risk 2/10 · Minimal
- Chance of severe wind over 30 yrs
- 1.0%
Air-quality risk 4/10 · Minor
- Unhealthy air days now
- 4 days/yr
- Unhealthy air days in 30 yrs
- 5 days/yr
Risk factors via First Street. Map © Google.
Why this score? — see what drove the D grade
The composite is a weighted blend of 9 inputs, each scored 0–100. Each bar is that input's sub-score; the figure is the points it added to the 100-point composite (weight × sub-score).
- Cash flow +15.1/30.0
- ARV discount +6.5/15.0
- DSCR +4.6/10.0
- 1% rule +4.3/10.0
- Livability +4.0/5.0
- Schools +3.7/10.0
- Rent growth +2.6/5.0
- Condition / age +2.5/5.0
- Appreciation +0.0/10.0
$529,900
🖨 Deal sheet (PDF) 📄 Offer letter ✓ Due diligence
Multi-family units
County records classify this as Multi-Family (2-4 Unit). Listing-text estimate: 3 units. confirmed
Listing remarks MLS
PRICE REDUCTION! Stately all brick 3 family has been updated throughout. Many newer features include all new kitchens, tile baths, new windows, updated electric, updated plumbing, new driveway, refinished hardwoods, etc. Short walk to Rookwood Commons. Two - 2 bedroom units and One - 1 bedroom unit.
Key facts
- Off-street parking
- 0.29 acre lot
- 3 garage spots
Tags
Property features AI
Finance
- Other: Total buildings: 1; Parcel number available
- Financial info: Three total rental units; Unit rents: one 1-bedroom at $1,000; two 2-bedrooms at $1,500 and $1,400 (unit-specific: Unit 1 $1,400; Unit 2 $1,500; Unit 3 $1,000)
Exterior
- Parking: Attached 3-car garage; Off-street parking and driveway with about 5 open spaces
- Utilities: Public water; Public sewer; Natural gas
- Home design: Triplex; Three or more levels
- Construction: Stone foundation; Built with brick construction
- Exterior features: Shingle roof; Brick exterior; Vinyl double-hung windows; Lot approximately 0.292 acres
Interior
- Bedrooms: Unit 1: 2 bedrooms; Unit 2: 2 bedrooms; Unit 3: 1 bedroom
- Bathrooms: Unit 1: 1 full bathroom; Unit 2: 1 full bathroom; Unit 3: 1 full bathroom
- Heating & cooling: Gas heating with hot water; Central air; Window AC units
- Interior features: Full basement; Inoperable fireplaces (3)
Neighborhood map
What this means for you Summary
Snapshot
- This is a 2×2bd/1.0ba + 1×1bd/1.0ba units multifamily listed at $530k.
Deal economics
- At list price, monthly cash flow is $173 ($2k/yr) — positive. Per door: $58/mo.
- The deal already cash-flows at list — no discount required.
- To meet the 1% rule (rent ≥ 1% of price), the offer needs to be $491k (7.4% below list).
- Recommended offer: $491k (7.4% below list) — sets the bar for 1% rule.
- Cap rate 6.7% vs local median 4.9% in Norwood — top-decile yield for the area; either an underpriced asset or a hidden risk that comps aren't pricing in. Stress-test before assuming the spread holds.
Location & tenants
- Location reads 79/100 on livability (#154 in OH, #2,322 nationally) — a middle-class / working-renter tenant base. Strengths: commute A+, cost of living A+, housing A+; Watch: crime C-, employment C-, amenities D+.
- Norwood City (suburban): math 35% / reading 53% proficiency, ranked #513 of 656 in OH (top 78%) — families likely to look elsewhere, expect single-tenant / working-renter base with shorter leases; 62% free/reduced lunch — lower-income household profile, screen leases tightly.
- Zoned schools: Sharpsburg Elementary (math 37% / reading 55%, grade D-, #979 of 1,584 statewide, top 62%, 259 students, 0% FRL); Norwood Middle School (math 41% / reading 57%, grade C-, #426 of 654 statewide, top 66%, 395 students, 0% FRL); Norwood High School (math 17% / reading 52%, grade F, #582 of 781 statewide, top 76%, 456 students, 0% FRL) — zoned schools average 0% FRL vs 62% district-wide (62 pts lower); this property's tenant base skews higher-income than the district average.
- Market conditions: Rents flat; 56 active listings in the ZIP; 801 units permitted in Hamilton County in 2024 (190 in 5+ unit buildings).
- At $4,907/mo this rent would consume 81% of the median local household income ($72k/yr) (locally 1192% of renters already pay >50% of income on rent) — very limited rent-growth headroom before tenants either downsize or default.
Forward outlook
- Local home prices are declining (-3.0%/yr); year-one equity from $4k of loan paydown is wiped out by about $16k of value loss. Plan a longer hold.
Negotiation context
- It's been on market 37 days — a 3% lower offer ($514k) is reasonable based on typical stale-listing flexibility.
- 6 sale attempts since 13y ago with the ask held roughly flat each time — persistent listings suggest the price (not the market) is what's stuck; bring a comps-based counter.
- Current owner paid $344k; list at $530k implies a 54% gain — meaningful room to come down on a strong offer.
Risks & watch-outs
- Watch-outs: built in 1910 — expect roof / HVAC / electrical / plumbing capex.
- Climate carrying-cost: extreme-heat days projected 7→19/yr by 2055 (HVAC capex compounding) — expect insurance premiums to compound above CPI over the hold.
Questions for the listing agent
- It's been on market 37 days. Have you received any prior offers? Is the seller open to a 7% concession, seller financing, or rate buy-down credit?
- Can we see the unit-by-unit rent roll, current vacancy, and any below-market leases? What's the average tenancy length?
- What capital expenditures (roof, boiler, parking lot, exteriors) have been made in the last 5 years, and what's planned in the next 2?
- Built in 1910 — when were the roof, HVAC, electrical panel, plumbing, and water heater last replaced?
- Is there a deadline driving the sale (1031 exchange, divorce, estate, relocation)? That informs how much negotiation room exists.
- Schools are B-rated — typically a magnet for longer-tenancy family renters. What's the average tenant stay here, and is there a school-zone premium baked into asking?
- The area grade is low — what's the realistic commute time and amenity access for the typical tenant pool here? Any planned neighborhood developments (good or bad) we should know about?
- What's the average days-on-market for RENTAL listings here right now (not sales)? A rising rental-DOM trend means longer vacancies and softer asking-rent achievability than the comps imply.
- What's the recent tenant-quality profile in this submarket — average credit score on applications, eviction rate, late-payment / NSF rate, and stable-employment percentage? A property-management company in the area should have these aggregated.
- How much new apartment / multifamily construction is in the pipeline within 1–3 miles? Heavy new supply (>2% of stock underway) typically softens rents 12–24 months out; light construction supports rent growth.
Investment metrics
- 1% rule
- 0.93% ✗
- Cap rate
- 6.68%
- Cash-on-cash
- 1.40%
- DSCR
- 1.06
- GRM
- 9.0
CMA / ARV
- ARV (median comp)
- $518,416
- List price
- $529,900
- Delta
- 2.22%
- Verdict
- FAIR
- Comps
- 20 within 1.0 mi
Show comp detail 1 sale within ~0.75 mi
| Address | Dist | Beds/Ba | Sqft | Sold | Price | $/sf | Match |
|---|---|---|---|---|---|---|---|
| 4000 Floral Ave | 0.42mi | 4/2.0 | 3,974 (-10%) | 10mo | $375,000 | $94 | 52 |
Match score weights: distance 35% · size 25% · config 20% · recency 20%. Top-matched comps best support the ARV.
Projected returns pro-forma
-3.0% appreciation · 0.21% rent growth · sell at horizon
- IRR
- -17.3%
- Equity multiple
- 0.41×
- Total profit
- $-88,170
- Equity at exit
- $79,010
- IRR
- -15.6%
- Equity multiple
- 0.23×
- Total profit
- $-114,216
- Equity at exit
- $45,816
Cash invested: $148,372 (down + closing). Projections, not guarantees.
Landlord ↔ Tenant lean methodology
- Overall (STATE)
- 73 Landlord-Friendly
- State Ohio
- 73 Landlord-Friendly · R+6
- County
- — inherits STATE
- City
- — inherits STATE
ZIP-level market 45212
- Rents YoY
- 0.2%
- Active inventory
- 56
- Price-to-rent
- 25.7×
Monthly cashflow live
- Estimated rent
- $4,907 high interval (Pro) →
- Mortgage (P&I)
- −$2,779
- Tax from tax record
- −$704 /mo · $8,450/yr
- Insurance
- −$221
- HOA
- −$0
- Vacancy / Maint / Mgmt
- −$1,030
- Net cashflow
- $173
Break-even live
Sensitivity live
| Price | -10% $473 | -5% $323 | +0% $173 | +5% $23 | +10% $-127 |
|---|---|---|---|---|---|
| Rent | -10% $-215 | -5% $-21 | +0% $173 | +5% $367 | +10% $560 |
| Rate | -1.0pp $440 | -0.5pp $307 | base $173 | +0.5pp $35 | +1.0pp $-104 |
3-unit breakdown (identical units grouped — click to expand)
| Units | Beds | Baths | Est. rent |
|---|---|---|---|
| 2× units | 2 | 1 | $3,430 |
| #1 | 2 | 1 | $1,715 |
| #2 | 2 | 1 | $1,715 |
| 1× unit | 1 | 1 | $1,477 |
| Total (3 units) | $4,907 | ||
UW: 25.0% down · 7.5% · 30yr · 1.5% tax · 5.0% vac · 8.0% maint · 8.0% mgmt
Financing live
Cash to close
- Down payment
- $132,475
- Closing costs
- $15,897
- Reserves months
- —
- Total cash needed
- —
Loan-product check · same deal, 3 products live
Conventional
25% down · 7.5% · 30yr
- Down + closing
- —
- Monthly P&I
- —
- Monthly cashflow
- —
- DSCR
- —
- Eligible?
- —
Personal DTI + credit; lowest rate.
DSCR
20% down · 8.5% · 30yr
- Down + closing
- —
- Monthly P&I
- —
- Monthly cashflow
- —
- DSCR
- —
- Eligible?
- —
No personal income docs; deal must DSCR.
Hard money
10% down · 12.0% · 12mo
- Down + closing
- —
- Monthly P&I
- —
- Monthly cashflow
- —
- DSCR
- —
- Eligible?
- —
Short-term bridge; refi at stabilization.
Listing history 32 events
-
2026-06-21days on market $529,900 Active 37 DOM
-
2026-06-18days on market $529,900 Active 34 DOM
-
2026-06-17days on market $529,900 Active 33 DOM
-
2026-06-16days on market $529,900 Active 32 DOM
-
2026-06-15days on market $529,900 Active 31 DOM
-
2026-06-13remarks 539-char remark
-
2026-06-13pricedays on market $529,900 Active 29 DOM
-
2026-06-09days on market $549,900 Active 25 DOM
-
2026-06-08days on market $549,900 Active 24 DOM
-
2026-06-07days on market $549,900 Active 23 DOM
-
2026-06-03days on market $549,900 Active 19 DOM
-
2026-06-02days on market $549,900 Active 18 DOM
-
2026-06-01days on market $549,900 Active 17 DOM
-
2026-05-31days on market $549,900 Active 16 DOM
-
2026-05-15$549,900 Active 482-char remark
-
2023-12-01historical $1,000
-
2023-11-28$1,000
-
2022-12-02historical
-
2022-12-02price $497,000
-
2022-10-10price $465,000
-
2022-08-11price $477,000
-
2022-06-02$497,000 Active
-
2019-05-13soldstatus $344,500
-
2019-05-03soldstatus $344,500 Sold
Show marketing remark (300 chars)
PRICE REDUCTION! Stately all brick 3 family has been updated throughout. Many newer features include all new kitchens, tile baths, new windows, updated electric, updated plumbing, new driveway, refinished hardwoods, etc. Short walk to Rookwood Commons. Two - 2 bedroom units and One - 1 bedroom unit.
-
2019-03-26historical Accept Backup Offers
Show marketing remark (300 chars)
PRICE REDUCTION! Stately all brick 3 family has been updated throughout. Many newer features include all new kitchens, tile baths, new windows, updated electric, updated plumbing, new driveway, refinished hardwoods, etc. Short walk to Rookwood Commons. Two - 2 bedroom units and One - 1 bedroom unit.
-
2019-03-01price $360,000
Show marketing remark (300 chars)
PRICE REDUCTION! Stately all brick 3 family has been updated throughout. Many newer features include all new kitchens, tile baths, new windows, updated electric, updated plumbing, new driveway, refinished hardwoods, etc. Short walk to Rookwood Commons. Two - 2 bedroom units and One - 1 bedroom unit.
-
2018-12-21$375,000 Active
Show marketing remark (300 chars)
PRICE REDUCTION! Stately all brick 3 family has been updated throughout. Many newer features include all new kitchens, tile baths, new windows, updated electric, updated plumbing, new driveway, refinished hardwoods, etc. Short walk to Rookwood Commons. Two - 2 bedroom units and One - 1 bedroom unit.
-
2015-01-26soldstatus $146,500
-
2015-01-16soldstatus $146,500
-
2014-01-27$169,900
-
2014-01-07historical
-
2013-08-07$229,900
ⓘ Source: listings_history table (triggers on properties + properties_extension) + one-shot
backfill from property_details.listing_events for pre-trigger history.
Tax reassessment forecast OH · Partial reset (capped growth)
- Current annual tax
- $8,450 · $704/mo
- Projected year-2 tax
- $8,450 · $704/mo
- Expected delta
- $0/yr ($0/mo · 0.0%)
ⓘ Screening estimate from a state-policy table — verify with the county assessor before closing.
Climate risk First Street
- Flood 1/10 Low FEMA zone X (unshaded) · 0% chance over 30 yrs
- Wildfire 1/10 Low
- Heat 5/10 Major 7 d/yr ≥103°F today · 19 d/yr by 30 yrs out
- Wind 2/10 Low 100% chance of damaging wind over 30 yrs
- Air quality 4/10 Moderate 4 unhealthy d/yr today · 5 by 30 yrs out
Nearby sold comps map
Loading sold comps map…
Walkable amenities ~0.75 mi
Loading nearby amenities…
Taxation est. · year 1
- Rental income
- $58,884
- − Mortgage interest
- −$29,683
- − Property taxes
- −$8,450
- − Insurance
- −$2,650
- − Repairs & maintenance
- −$4,711
- − Management
- −$4,711
- − Depreciation
- −$15,415
- Taxable loss
- −$6,735
- Est. tax savings @ 24.0%
- +$1,616
- After-tax cash flow
- $3,689/yr
For passive investors: Depreciation is non-cash, so a rental often shows a tax loss while cash-flowing — sheltering income. Rental losses are passive: they offset passive income freely, and up to $25,000/yr can offset ordinary (W-2) income if you actively participate and your MAGI is under $100k (phasing out to $0 by $150k); unused losses carry forward. On sale, claimed depreciation is recaptured at up to 25%, and gains may owe capital-gains tax (a 1031 exchange can defer both). Figures are a year-1 estimate at your 24.0% rate — not tax advice; consult a CPA.
Schools (NCES district)
- District
- Norwood City
- NCES district ID
- 3904457
- Math proficiency
- 35% ▼ -24.00%
- Reading proficiency
- 53% ▼ -11.00%
- Median HH income
- $38,750
- Composite
- 36.66/100
- National rank
- #4614
- State rank
- #513 of 656 in OH
Livability — Norwood
- Score
- 79/100
- State rank
- #154
- US rank
- #2322
Category grades
Schools grade is shown separately in the Schools card above.
Census & demographics
- Census place
- Norwood, OH
- County
- Hamilton County · 701,295 people
- City population
- 21,526
- Metro
- Cincinnati, OH-KY-IN
- Population (ZIP)
- 21,526
- Household income
- $72,422
- Rent vs Own
- Severe rent burden
- 1192.0
Population outlook (Hamilton County) Hauer SSP2
- Today (2025)
- 826,054 people
- By 2030
- 830,947 · +0.6%
- By 2040
- 832,319 · +0.8%
- By 2050
- 822,428 · -0.4%
- By 2075
- 788,688 · -4.5%
- By 2100
- 710,674 · -14.0%
Race, ethnicity, and origin ACS 2023
- Neighborhood character
- Predominantly White (73%)
- Race & ethnicity
- White 73% Black 15% Hispanic / Latino 8% Two or more races 5% Asian 1%
- Hispanic origin (detail)
- Mexican 3%
- Common ancestry
- Romanian 2% Lithuanian 1% Slovak 1%
- Foreign-born
- 5% · Canada, China
- Languages at home
- 92% English-only · Spanish 6% Arabic 1% Russian/Polish/Slavic 1%
Political lean MEDSL · Hamilton
- 2024 margin
- D (+14.9) · D 57.0% · R 42.1%
- 2008→2024 swing
- +7.9pp toward D · 2008: 7.0pp · 2024: 14.9pp
- All cycles
- 2024: D+14.9 2020: D+15.9 2016: D+9.5 2012: D+4.9 2008: D+7.0
Not yet ingested
- Civics
- —
Market trends
- HPI YoY
- ▼ -209.95%
- Current HPI
- 295.7088
- Rent YoY
- ▲ 0.21%
- Metro
- Cincinnati, OH-KY-IN
- State GDP YoY
- ▲ 1.98%
- F500 in state
- 48
Industry mix (Fortune 500 HQ in OH)
| Industry | F500 HQs | Revenue |
|---|---|---|
| Insurance | 3 | $145B |
|
||
| Industrial Machinery | 3 | $49B |
|
||
| Financial Services | 3 | $24B |
|
||
| Consumer Goods | 2 | $93B |
|
||
| Aerospace / Defense | 2 | $47B |
|
||
| Utilities | 2 | $33B |
|
||
Price history
+130.5% since first listed19 events — show timeline
- 2026-06-12 Price Changed $529,900 Cincy MLS
- 2026-05-15 Listed $549,900 Cincy MLS
- 2023-12-01 Rental Removed $1,000 RENTALBEAST
- 2023-11-28 Listed for Rent $1,000 RENTALBEAST
- 2022-12-02 Price Changed $497,000 Cincy MLS
- 2022-12-02 Listing Removed — Cincy MLS
- 2022-10-10 Price Changed $465,000 Cincy MLS
- 2022-08-11 Price Changed $477,000 Cincy MLS
- 2022-06-02 Listed $497,000 Cincy MLS
- 2019-05-13 Sold (Public Records) $344,500 Public Records
- 2019-05-03 Sold (MLS) $344,500 Cincy MLS
- 2019-03-26 Contingent — Cincy MLS
- 2019-03-01 Price Changed $360,000 Cincy MLS
- 2018-12-21 Listed $375,000 Cincy MLS
- 2015-01-26 Sold (Public Records) $146,500 Public Records
- 2015-01-16 Sold (MLS) $146,500 Cincy MLS
- 2014-01-27 Listed $169,900 Cincy MLS
- 2014-01-07 Listing Removed — Cincy MLS
- 2013-08-07 Listed $229,900 Cincy MLS
Property tax history
+5.7%/yrLatest (2025): $8,450 · -0.0% YoY. Source: county tax records.
Cash-flow waterfall
monthlySold comps — $/sqft
last 12 mo · ≤1 miLoading sold comps…