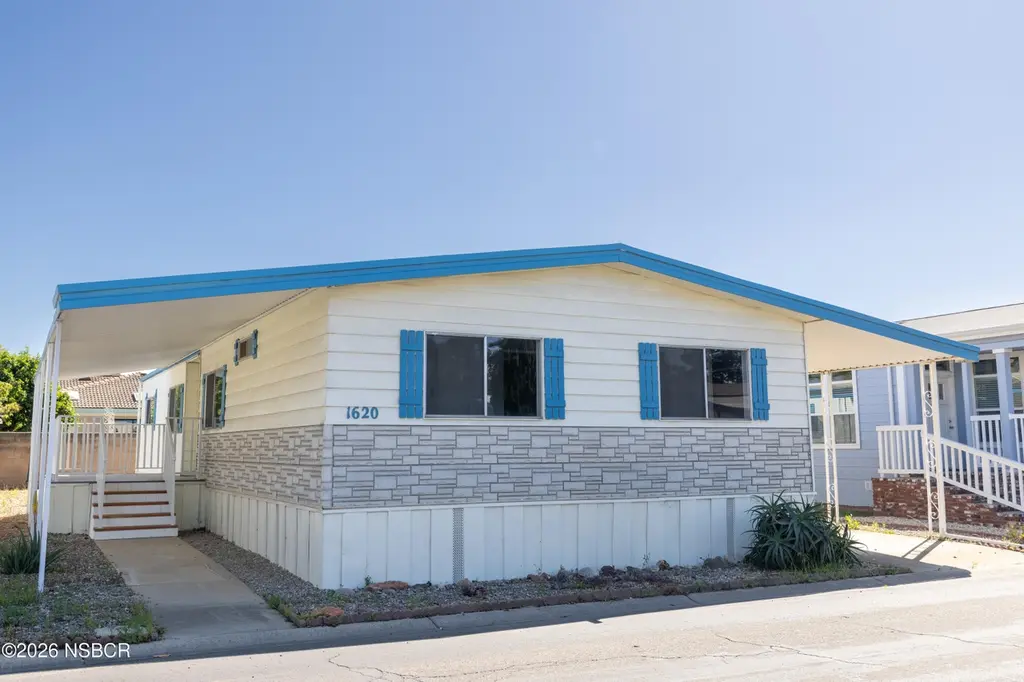
1620 Via Quantico Spc 10 · Santa Maria, CA
Flood risk 5/10 · Moderate
- FEMA flood zone
- X (unshaded)
- Chance of flooding over 30 yrs
- 0.24%
- Est. flood insurance / yr
- $507 – $1,088
Fire risk 5/10 · Moderate
- Est. fire insurance / yr
- $659 – $1,223
Heat risk 4/10 · Minor
- Hot days now (above 84°F)
- 7 days/yr
- Hot days in 30 yrs
- 17 days/yr
Wind risk 1/10 · Minimal
- Chance of severe wind over 30 yrs
- —
Air-quality risk 6/10 · Moderate
- Unhealthy air days now
- 11 days/yr
- Unhealthy air days in 30 yrs
- 12 days/yr
Risk factors via First Street. Map © Google.
Why this score? — see what drove the B- grade
The composite is a weighted blend of 9 inputs, each scored 0–100. Each bar is that input's sub-score; the figure is the points it added to the 100-point composite (weight × sub-score).
- Cash flow +30.0/30.0
- DSCR +10.0/10.0
- 1% rule +9.9/10.0
- ARV discount +4.1/15.0
- Condition / age +4.0/5.0
- Livability +3.6/5.0
- Rent growth +3.3/5.0
- Schools +2.9/10.0
- Appreciation +0.0/10.0
$172,000
🖨 Deal sheet 📄 Offer letter ✓ Due diligence
Listing remarks
Updated 2-3 bedroom, 2 full bath home offering approximately 1,440 square feet of living space, located in the desirable Casa del Rio Mobile Estates, a 55+ community. Enjoy a peaceful setting while remaining conveniently close to shopping, grocery stores, and scenic dog-walking trails. This home features numerous upgrades throughout, including a remodeled kitchen with new countertops, sink, dishwasher, refrigerator, and upgraded cabinet drawer glides. Both bathrooms have been tastefully updated with resurfaced and freshly painted tubs, along with new shower heads, mirrors, plumbing connections, toilet and sink fixtures, and modern lighting. The spacious primary bedroom includes a walk-in cl
Key facts
- New carpet
- Walk-in closet
- Remodeled kitchen
Tags
Property features AI
Finance
- Other: Lot is residential single family zoning
- HOA & community: Age-restricted community; Pets allowed
Exterior
- Parking: Attached carport; 2 garage spaces
- Utilities: Public water; Public sewer
- Home design: Manufactured home; Single-story (manufactured home occupying a single level); Facing direction not provided
- Construction: Brick and composite siding exterior; Composition roof; Pillar/post/pier foundation; Manufactured by Sunnybrook; Mobile dimensions approx. 60' x 24'
- Exterior features: Patio; Covered patio; Decks; Tool shed
Interior
- Kitchen: Electric oven/range; Electric cooktop
- Flooring: Carpet; Linoleum
- Bathrooms: 2 full bathrooms
- Heating & cooling: Forced air heating
- Interior features: Carpet and linoleum flooring; Gas hookup for laundry
- Laundry & utility: Gas hookup provided
Neighborhood map
What this means for you Summary
Snapshot
- This is a 2-bed/2.0-bath manufactured listed at $172k. Condition is rated good.
Deal economics
- At list price, monthly cash flow is $834 ($10k/yr) — positive.
- The deal already cash-flows at list — no discount required.
- Meets the 1% rule at list price ($3k rent vs $172k).
- Recommended offer: $162k (6.0% below list) — sets the bar for market timing.
- Cap rate 12.1% vs local median 3.5% in Santa Maria — top-decile yield for the area; either an underpriced asset or a hidden risk that comps aren't pricing in. Stress-test before assuming the spread holds.
Location & tenants
- Location reads 71/100 on livability (#202 in CA) — a middle-class / working-renter tenant base. Strengths: amenities A+, commute A+, health & safety A; Watch: schools F, crime F, cost of living F.
- Santa Maria-Bonita (urban): math 26% / reading 34% proficiency, ranked #1,023 of 1,400 in CA (top 73%) — families likely to look elsewhere, expect single-tenant / working-renter base with shorter leases; 72% free/reduced lunch — lower-income household profile, screen leases tightly.
- Market conditions: Rents rising (+3.3%/yr); 79 active listings in the ZIP; 3 comparable units currently listed for rent nearby; rentals leasing fast (median 14d on market — plan ~1-2 weeks tenant-placement turnaround); solid renter incomes; 719 units permitted in Santa Barbara County in 2024 (217 in 5+ unit buildings).
- This rent runs 38% of the median local income ($82k/yr) — at the standard rent-burdened threshold; future hikes will face affordability resistance.
Forward outlook
- Local home prices are declining (-3.0%/yr); year-one equity from $1k of loan paydown is wiped out by about $5k of value loss. Plan a longer hold.
- Santa Barbara County population projected at +20% by 2050 — long-run rental-demand tailwind backs the buy-and-hold thesis.
- At projected returns (-3.0% appreciation + 3.3% rent growth), your $48k cash investment doubles in ~6 years — after that, you're playing with house money.
Negotiation context
- It's been on market 66 days — a 6% lower offer ($162k) is reasonable based on typical stale-listing flexibility.
Risks & watch-outs
- Climate carrying-cost: moderate flood risk; moderate wildfire risk — expect insurance premiums to compound above CPI over the hold.
Questions for the listing agent
- It's been on market 66 days. Have you received any prior offers? Is the seller open to a 6% concession, seller financing, or rate buy-down credit?
- Built in 1975 — when were the roof, HVAC, electrical panel, plumbing, and water heater last replaced?
- Why hasn't it sold? Are there any deal-killer items the seller is aware of (foundation, flood, title, zoning, code violations)?
- Is there a deadline driving the sale (1031 exchange, divorce, estate, relocation)? That informs how much negotiation room exists.
- Schools are F-rated, which usually means shorter tenancies and higher turnover. Who's the typical renter profile here, and what's been the actual vacancy rate?
- Crime grade is F in this area — have there been break-ins, vandalism, or insurance claims at this property in the last 3 years? What carrier currently insures it and at what premium?
- What's the average days-on-market for RENTAL listings here right now (not sales)? A rising rental-DOM trend means longer vacancies and softer asking-rent achievability than the comps imply.
- What's the recent tenant-quality profile in this submarket — average credit score on applications, eviction rate, late-payment / NSF rate, and stable-employment percentage? A property-management company in the area should have these aggregated.
- How much new for-sale + rental construction is in the pipeline within 1–3 miles? Heavy new supply typically softens prices + rents 12–24 months out; constrained supply supports both.
Investment metrics
- 1% rule
- 1.49% ✓
- Cap rate
- 12.11%
- Cash-on-cash
- 20.79%
- DSCR
- 1.92
- GRM
- 5.6
CMA / ARV
- ARV (on-the-fly)
- $159,840
- Comps found
- 12
Show comp detail 12 sales within ~0.75 mi
| Address | Dist | Beds/Ba | Sqft | Sold | Price | $/sf | Match |
|---|---|---|---|---|---|---|---|
| 1403 Via Asueto | 0.19mi | 2/2.0 | 1,440 (0%) | 2mo | $210,000 | $146 | 90 |
| 1127 Via Contento | 0.05mi | 2/2.0 | 1,392 (-3%) | 6mo | $115,000 | $83 | 87 |
| 1627 Via Sabroso | 0.15mi | 2/2.0 | 1,440 (0%) | 12mo | $60,000 | $42 | 82 |
| 1602 Via Tropico | 0.11mi | 3/2.0 (+1) | 1,512 (+5%) | 0mo | $320,000 | $212 | 81 |
| 1127 Via Estio | 0.07mi | 2/2.0 | 1,536 (+7%) | 7mo | $152,000 | $99 | 80 |
| 1608 Via Quantico | 0.06mi | 3/2.0 (+1) | 1,536 (+7%) | 4mo | $115,000 | $75 | 78 |
| 1620 Via Ynez | 0.23mi | 3/2.0 (+1) | 1,488 (+3%) | 1mo | $165,000 | $111 | 78 |
| 1651 Via Quantico | 0.15mi | 3/2.0 (+1) | 1,521 (+6%) | 4mo | $200,000 | $131 | 75 |
| 1201 Via Gusto | 0.13mi | 3/2.0 (+1) | 1,536 (+7%) | 10mo | $165,000 | $107 | 70 |
| 1632 Via Undoso | 0.22mi | 2/2.0 | 1,320 (-8%) | 8mo | $149,000 | $113 | 69 |
| 1617 Via Rico | 0.08mi | 3/2.0 (+1) | 1,568 (+9%) | 11mo | $174,000 | $111 | 68 |
| 1205 Via Hielo | 0.17mi | 2/2.0 | 1,248 (-13%) | 15mo | $65,000 | $52 | 58 |
Match score weights: distance 35% · size 25% · config 20% · recency 20%. Top-matched comps best support the ARV.
Projected returns pro-forma
-3.0% appreciation · 3.26% rent growth · sell at horizon
- IRR
- 13.5%
- Equity multiple
- 1.54×
- Total profit
- $25,973
- Equity at exit
- $25,646
- IRR
- 22.5%
- Equity multiple
- 2.95×
- Total profit
- $93,964
- Equity at exit
- $14,871
Cash invested: $48,160 (down + closing). Projections, not guarantees.
Landlord ↔ Tenant lean methodology
- Overall (STATE)
- 18 Strongly Tenant-Friendly
- State California
- 18 Strongly Tenant-Friendly · D+13
- County
- — inherits STATE
- City
- — inherits STATE
ZIP-level market 93454
- Rents YoY
- 3.3%
- Active inventory
- 79
- Price-to-rent
- 5.6×
Monthly cashflow live
- Estimated rent
- $2,561 medium interval (Pro) →
- Mortgage (P&I)
- −$902
- Tax est. 1.5%
- −$215 /mo · $2,580/yr
- Insurance
- −$72
- HOA
- −$0
- Vacancy / Maint / Mgmt
- −$538
- Net cashflow
- $834
Break-even live
UW: 25.0% down · 7.5% · 30yr · 1.5% tax · 5.0% vac · 8.0% maint · 8.0% mgmt
Financing live
Cash to close
- Down payment
- $43,000
- Closing costs
- $5,160
- Reserves months
- —
- Total cash needed
- —
Loan-product check · same deal, 3 products live
Conventional
25% down · 7.5% · 30yr
- Down + closing
- —
- Monthly P&I
- —
- Monthly cashflow
- —
- DSCR
- —
- Eligible?
- —
Personal DTI + credit; lowest rate.
DSCR
20% down · 8.5% · 30yr
- Down + closing
- —
- Monthly P&I
- —
- Monthly cashflow
- —
- DSCR
- —
- Eligible?
- —
No personal income docs; deal must DSCR.
Hard money
10% down · 12.0% · 12mo
- Down + closing
- —
- Monthly P&I
- —
- Monthly cashflow
- —
- DSCR
- —
- Eligible?
- —
Short-term bridge; refi at stabilization.
Rent comps 3 comps
| Address | Beds | Baths | Sqft | Rent | $/sqft | DOM | Units | Dist |
|---|---|---|---|---|---|---|---|---|
| 1124 N Suey Rd Santa Maria, CA | 2.0 | 2.0 | 1296 | $2,500 | $1.93 | 13d | 1 | 0.10mi |
| 914 E El Camino St Santa Maria, CA | 3.0 | 2.0 | 1441 | $3,400 | $2.36 | 21d | 1 | 0.90mi |
| Lynne Dr Santa Maria, CA | 3.0 | 2.5 | 1264 | $3,000 | $2.37 | 13d | 1 | 1.23mi |
Listing history 17 events
-
2026-06-18days on market $172,000 Active 66 DOM
-
2026-06-17days on market $172,000 Active 65 DOM
-
2026-06-16days on market $172,000 Active 64 DOM
-
2026-06-15days on market $172,000 Active 63 DOM
-
2026-06-14days on market $172,000 Active 61 DOM
-
2026-06-13days on market $172,000 Active 60 DOM
-
2026-06-10days on market $172,000 Active 58 DOM
-
2026-06-09days on market $172,000 Active 57 DOM
-
2026-06-08days on market $172,000 Active 56 DOM
-
2026-06-07days on market $172,000 Active 55 DOM
-
2026-06-05days on market $172,000 Active 52 DOM
-
2026-06-03days on market $172,000 Active 51 DOM
-
2026-06-02days on market $172,000 Active 50 DOM
-
2026-06-01days on market $172,000 Active 49 DOM
-
2026-05-31days on market $172,000 Active 48 DOM
-
2026-05-30days on market $172,000 Active 47 DOM
-
2026-04-10$172,000 Active
ⓘ Source: listings_history table (triggers on properties + properties_extension) + one-shot
backfill from property_details.listing_events for pre-trigger history.
Climate risk First Street
- Flood 5/10 Major FEMA zone X (unshaded) · 24% chance over 30 yrs
- Wildfire 5/10 Major
- Heat 4/10 Moderate 7 d/yr ≥84°F today · 17 d/yr by 30 yrs out
- Wind 1/10 Low
- Air quality 6/10 Major 11 unhealthy d/yr today · 12 by 30 yrs out
Nearby sold comps map
Loading sold comps map…
Walkable amenities ~0.75 mi
Loading nearby amenities…
Taxation est. · year 1
- Rental income
- $30,728
- − Mortgage interest
- −$9,635
- − Property taxes
- −$2,580
- − Insurance
- −$860
- − Repairs & maintenance
- −$2,458
- − Management
- −$2,458
- − Depreciation
- −$5,004
- Taxable income
- $7,733
- Est. tax owed @ 24.0%
- −$1,856
- After-tax cash flow
- $8,155/yr
For passive investors: Depreciation is non-cash, so a rental often shows a tax loss while cash-flowing — sheltering income. Rental losses are passive: they offset passive income freely, and up to $25,000/yr can offset ordinary (W-2) income if you actively participate and your MAGI is under $100k (phasing out to $0 by $150k); unused losses carry forward. On sale, claimed depreciation is recaptured at up to 25%, and gains may owe capital-gains tax (a 1031 exchange can defer both). Figures are a year-1 estimate at your 24.0% rate — not tax advice; consult a CPA.
Condition & rehab AI · 12 photos
This 2-bedroom, 2-bathroom home in Casa del Rio Mobile Estates is in good condition with recent updates to the kitchen and bathrooms. It offers a good investment opportunity with potential for further value enhancement through cosmetic upgrades.
Value-add opportunities
- Both Painting the exterior and interior walls — Fresh paint can enhance the home's curb appeal and interior aesthetics.
- Both Upgrading the flooring to a more durable material — A more durable flooring option can improve the home's value and reduce maintenance costs.
- Both Upgrading the kitchen appliances to more modern models — Modern appliances can attract more buyers and renters, and improve the home's overall appeal.
- Both Upgrading the bathroom fixtures to more modern models — Modern bathroom fixtures can attract more buyers and renters, and improve the home's overall appeal.
- Both Upgrading the HVAC system to a more energy-efficient model — A more energy-efficient HVAC system can reduce utility costs and improve the home's overall appeal.
- Both Landscaping the front yard to enhance curb appeal — A well-maintained front yard can attract more buyers and renters, and improve the home's overall appeal.
Renovation cost estimate screening
Value-add ROI direction
- Both Painting the exterior and interior walls — Fresh paint can enhance the home's curb appeal and interior aesthetics. ↑
- Both Upgrading the flooring to a more durable material — A more durable flooring option can improve the home's value and reduce maintenance costs. ↑
- Both Upgrading the kitchen appliances to more modern models — Modern appliances can attract more buyers and renters, and improve the home's overall appeal. ↑
- Both Upgrading the bathroom fixtures to more modern models — Modern bathroom fixtures can attract more buyers and renters, and improve the home's overall appeal. ↑
- Both Upgrading the HVAC system to a more energy-efficient model — A more energy-efficient HVAC system can reduce utility costs and improve the home's overall appeal. ↑
- Both Landscaping the front yard to enhance curb appeal — A well-maintained front yard can attract more buyers and renters, and improve the home's overall appeal. ↑
ⓘ Cost ranges are severity-bucket heuristics (US national rule-of-thumb). Get contractor quotes + a written scope before underwriting a rehab budget.
Schools (NCES district)
- District
- Santa Maria-Bonita
- NCES district ID
- 0605580
- Math proficiency
- 26% ▲ 3.00%
- Reading proficiency
- 34% ▲ 3.00%
- Median HH income
- $50,959
- Composite
- 29.11/100
- National rank
- #11891
- State rank
- #1023 of 1400 in CA
Livability — Santa Maria
- Score
- 71/100
- State rank
- #202
- US rank
- #6519
Category grades
Schools grade is shown separately in the Schools card above.
Census & demographics
- Census place
- Santa Maria, CA
- County
- Santa Barbara County · 410,380 people
- City population
- 145,655
- Metro
- Santa Maria-Santa Barbara, CA
- Population (ZIP)
- 41,896
- Household income
- $81,522
- Rent vs Own
- Severe rent burden
- 1893.0
Population outlook (Santa Barbara County) Hauer SSP2
- Today (2025)
- 484,679 people
- By 2030
- 505,323 · +4.3%
- By 2040
- 545,783 · +12.6%
- By 2050
- 584,263 · +20.5%
- By 2075
- 682,586 · +40.8%
- By 2100
- 723,188 · +49.2%
Race, ethnicity, and origin ACS 2023
- Neighborhood character
- Predominantly Hispanic (73%)
- Race & ethnicity
- Hispanic / Latino 73% Two or more races 37% White 20% Native American 3% Asian 3%
- Hispanic origin (detail)
- Mexican 69%
- Common ancestry
- Russian 1% Italian 1% Lithuanian 1%
- Foreign-born
- 26% · Canada, Vietnam
- Languages at home
- 43% English-only · Spanish 52% Tagalog/Filipino 1%
Political lean MEDSL · Santa Barbara
- 2024 margin
- Strong D (+26.7) · D 61.8% · R 35.1% · Other 3.1%
- 2008→2024 swing
- +3.8pp toward D · 2008: 22.9pp · 2024: 26.7pp
- All cycles
- 2024: D+26.7 2020: D+32.1 2016: D+28.2 2012: D+17.1 2008: D+22.9
Not yet ingested
- Civics
- —
Market trends
- HPI YoY
- ▼ -543.97%
- Current HPI
- 313.0849
- Rent YoY
- ▲ 3.26%
- Metro
- Santa Maria-Santa Barbara, CA
- State GDP YoY
- ▲ 3.21%
- F500 in state
- 116
Industry mix (Fortune 500 HQ in CA)
| Industry | F500 HQs | Revenue |
|---|---|---|
| Technology | 27 | $1,492B |
|
||
| Financial Services | 3 | $174B |
|
||
| Retail | 3 | $44B |
|
||
| Insurance | 3 | $26B |
|
||
| Media / Entertainment | 2 | $115B |
|
||
| Pharmaceuticals / Biotech | 2 | $62B |
|
||
Price history
1 event — show timeline
- 2026-04-10 Listed $172,000 NSBCRMLS
Cash-flow waterfall
monthlySold comps — $/sqft
last 12 mo · ≤1 miLoading sold comps…