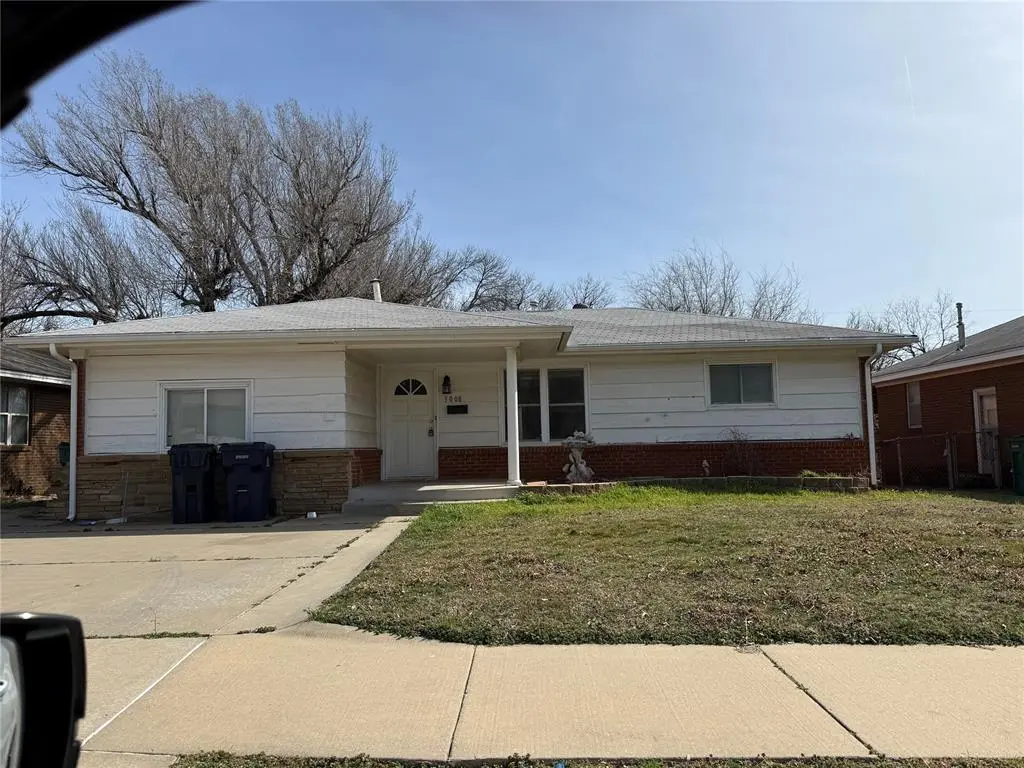
3008 N Vermont Ave · Oklahoma City, OK
Flood risk 1/10 · Minimal
- FEMA flood zone
- X (unshaded)
- Chance of flooding over 30 yrs
- 0.0%
- Est. flood insurance / yr
- $507 – $1,088
Fire risk 1/10 · Minimal
- Est. fire insurance / yr
- $2,463 – $4,575
Heat risk 6/10 · Moderate
- Hot days now (above 107°F)
- 7 days/yr
- Hot days in 30 yrs
- 18 days/yr
Wind risk 2/10 · Minimal
- Chance of severe wind over 30 yrs
- 3.0%
Air-quality risk 2/10 · Minimal
- Unhealthy air days now
- 1 days/yr
- Unhealthy air days in 30 yrs
- 2 days/yr
Risk factors via First Street. Map © Google.
Why this score? — see what drove the C- grade
The composite is a weighted blend of 9 inputs, each scored 0–100. Each bar is that input's sub-score; the figure is the points it added to the 100-point composite (weight × sub-score).
- Cash flow +15.1/30.0
- ARV discount +15.0/15.0
- DSCR +4.6/10.0
- Rent growth +4.3/5.0
- 1% rule +4.2/10.0
- Livability +4.0/5.0
- Condition / age +2.5/5.0
- Schools +0.7/10.0
- Appreciation +0.0/10.0
$129,000
🖨 Deal sheet 📄 Offer letter ✓ Due diligence
Listing remarks
Investor Special. As-is. Short Sale/ Bank approval required. Was a rental prior to this listing. Buyer to verify school districts/ square footage, and all aspects of property. Inspections highly recommended, seller lives out of state and is not familiar with property.
Key facts
- 7,841 sq ft lot
- Built 1954
- Listed 4 days
Property features AI
Finance
- Other: Located in Zedna Ann 2nd Add; Sale condition: Lender approval / short sale
- Financial info: Not assumable; Financing may qualify
- HOA & community: No mandatory association dues
Exterior
- Utilities: Homestead status: Yes
- Home design: Single family residence; One-level property; Existing property
- Construction: Brick and frame construction; Shingle roof; Combination foundation; Built with other materials
- Exterior features: Interior lot; No exterior features listed
Interior
- Kitchen: 4-burner range
- Bedrooms: 3 bedrooms
- Bathrooms: 1 full bath; 1 half bath
- Heating & cooling: Heating: Other; Cooling: Other
- Interior features: One living area; No fireplace
Neighborhood map
What this means for you Summary
Snapshot
- This is a 3-bed/1.0-bath single-family listed at $129k.
Deal economics
- At list price, monthly cash flow is $43 ($515/yr) — positive.
- The deal already cash-flows at list — no discount required.
- To meet the 1% rule (rent ≥ 1% of price), the offer needs to be $118k (8.3% below list).
- Recommended offer: $118k (8.3% below list) — sets the bar for 1% rule.
- Cap rate 6.7% vs local median 3.7% in Oklahoma City — top-decile yield for the area; either an underpriced asset or a hidden risk that comps aren't pricing in. Stress-test before assuming the spread holds.
Location & tenants
- Location reads 80/100 on livability (#3 in OK, #1,635 nationally) — a professional / high-income tenant draw. Strengths: amenities A+, commute A+, cost of living A+; Watch: crime F.
- Oklahoma City (urban): math 7% / reading 10% proficiency, ranked #254 of 270 in OK (top 94%) — low school quality limits family demand, transient renter base, plan for 1-2y turnover; 82% free/reduced lunch — lower-income household profile, screen leases tightly.
- Zoned schools: Kaiser Es (math 8% / reading 8%, grade F, #741 of 845 statewide, top 89%, 530 students, 0% FRL); Northwest Classen Hs (math 5% / reading 10%, grade F, #420 of 447 statewide, top 95%, 1,702 students, 0% FRL) — zoned schools average 0% FRL vs 82% district-wide (82 pts lower); this property's tenant base skews higher-income than the district average.
- Market conditions: Rents rising fast (+7.3%/yr); 216 active listings in the ZIP; 40 comparable units currently listed for rent nearby; rentals at typical pace (median 24d on market — plan ~3-4 weeks tenant-placement turnaround); 5,365 units permitted in Oklahoma County in 2024 (569 in 5+ unit buildings).
Forward outlook
- Local home prices are declining (-3.0%/yr); year-one equity from $892 of loan paydown is wiped out by about $4k of value loss. Plan a longer hold.
- Oklahoma County population projected at +41% by 2050 — long-run rental-demand tailwind backs the buy-and-hold thesis.
Negotiation context
- Only 4 days on market — expect competitive offers; lowballing is unlikely to land.
- 6 sale attempts since 2y ago with the ask held roughly flat each time — persistent listings suggest the price (not the market) is what's stuck; bring a comps-based counter.
- Current owner paid $19k; list at $129k implies a 564% gain — meaningful room to come down on a strong offer.
Risks & watch-outs
- Watch-outs: built in 1954 — expect roof / HVAC / electrical / plumbing capex.
- Climate carrying-cost: extreme-heat days projected 7→18/yr by 2055 (HVAC capex compounding) — expect insurance premiums to compound above CPI over the hold.
Questions for the listing agent
- Built in 1954 — when were the roof, HVAC, electrical panel, plumbing, and water heater last replaced?
- Is there a deadline driving the sale (1031 exchange, divorce, estate, relocation)? That informs how much negotiation room exists.
- Schools are F-rated, which usually means shorter tenancies and higher turnover. Who's the typical renter profile here, and what's been the actual vacancy rate?
- Crime grade is F in this area — have there been break-ins, vandalism, or insurance claims at this property in the last 3 years? What carrier currently insures it and at what premium?
- What's the average days-on-market for RENTAL listings here right now (not sales)? A rising rental-DOM trend means longer vacancies and softer asking-rent achievability than the comps imply.
- What's the recent tenant-quality profile in this submarket — average credit score on applications, eviction rate, late-payment / NSF rate, and stable-employment percentage? A property-management company in the area should have these aggregated.
- How much new for-sale + rental construction is in the pipeline within 1–3 miles? Heavy new supply typically softens prices + rents 12–24 months out; constrained supply supports both.
Investment metrics
- 1% rule
- 0.92% ✗
- Cap rate
- 6.69%
- Cash-on-cash
- 1.43%
- DSCR
- 1.06
- GRM
- 9.1
CMA / ARV
- ARV (median comp)
- $183,397
- List price
- $129,000
- Delta
- -29.66%
- Verdict
- UNDERPRICED
- Comps
- 20 within 1.0 mi
Show comp detail 12 sales within ~0.75 mi
| Address | Dist | Beds/Ba | Sqft | Sold | Price | $/sf | Match |
|---|---|---|---|---|---|---|---|
| 4013 NW 31st St | 0.38mi | 3/1.0 | 1,101 (+2%) | 2mo | $130,000 | $118 | 78 |
| 3251 Otterson Dr | 0.48mi | 2/1.0 (-1) | 1,089 (+1%) | 1mo | $150,000 | $138 | 71 |
| 3908 NW 31st St | 0.40mi | 3/2.0 | 1,110 (+3%) | 3mo | $207,000 | $186 | 70 |
| 3911 NW 26th St | 0.45mi | 3/1.0 | 1,122 (+4%) | 4mo | $150,000 | $134 | 69 |
| 4045 NW 33rd St | 0.43mi | 3/1.0 | 1,168 (+8%) | 7mo | $165,000 | $141 | 61 |
| 4020 NW 23rd St | 0.52mi | 2/1.0 (-1) | 1,020 (-6%) | 7mo | $130,000 | $127 | 56 |
| 4033 NW 22nd St | 0.53mi | 3/1.0 | 1,202 (+11%) | 3mo | $199,000 | $166 | 54 |
| 3221 N Roff Ave | 0.42mi | 3/2.0 | 1,202 (+11%) | 7mo | $205,000 | $171 | 52 |
| 4529 NW 33rd St | 0.61mi | 3/1.0 | 950 (-12%) | 3mo | $125,100 | $132 | 49 |
| 4125 NW 21st St | 0.52mi | 3/2.0 | 1,205 (+12%) | 6mo | $185,000 | $154 | 47 |
| 3847 NW 21st St | 0.70mi | 2/1.0 (-1) | 939 (-13%) | 7mo | $165,000 | $176 | 35 |
| 4421 NW 18th St | 0.71mi | 2/1.0 (-1) | 940 (-13%) | 6mo | $115,000 | $122 | 35 |
Match score weights: distance 35% · size 25% · config 20% · recency 20%. Top-matched comps best support the ARV.
Projected returns pro-forma
-3.0% appreciation · 7.29% rent growth · sell at horizon
- IRR
- -9.3%
- Equity multiple
- 0.64×
- Total profit
- $-12,826
- Equity at exit
- $19,234
- IRR
- 5.1%
- Equity multiple
- 1.45×
- Total profit
- $16,301
- Equity at exit
- $11,154
Cash invested: $36,120 (down + closing). Projections, not guarantees.
Landlord ↔ Tenant lean methodology
- Overall (STATE)
- 83 Strongly Landlord-Friendly
- State Oklahoma
- 83 Strongly Landlord-Friendly · R+20
- County
- — inherits STATE
- City
- — inherits STATE
ZIP-level market 73107
- Rents YoY
- 7.3%
- Active inventory
- 216
- Price-to-rent
- 9.1×
Monthly cashflow live
- Estimated rent
- $1,183 high interval (Pro) →
- Mortgage (P&I)
- −$676
- Tax from tax record
- −$161 /mo · $1,933/yr
- Insurance
- −$54
- HOA
- −$0
- Vacancy / Maint / Mgmt
- −$248
- Net cashflow
- $43
Break-even live
UW: 25.0% down · 7.5% · 30yr · 1.5% tax · 5.0% vac · 8.0% maint · 8.0% mgmt
Financing live
Cash to close
- Down payment
- $32,250
- Closing costs
- $3,870
- Reserves months
- —
- Total cash needed
- —
Loan-product check · same deal, 3 products live
Conventional
25% down · 7.5% · 30yr
- Down + closing
- —
- Monthly P&I
- —
- Monthly cashflow
- —
- DSCR
- —
- Eligible?
- —
Personal DTI + credit; lowest rate.
DSCR
20% down · 8.5% · 30yr
- Down + closing
- —
- Monthly P&I
- —
- Monthly cashflow
- —
- DSCR
- —
- Eligible?
- —
No personal income docs; deal must DSCR.
Hard money
10% down · 12.0% · 12mo
- Down + closing
- —
- Monthly P&I
- —
- Monthly cashflow
- —
- DSCR
- —
- Eligible?
- —
Short-term bridge; refi at stabilization.
Rent comps 40 comps
| Address | Beds | Baths | Sqft | Rent | $/sqft | DOM | Units | Dist |
|---|---|---|---|---|---|---|---|---|
| 2626 N Meridian Ave Oklahoma City, OK | 1.0–2.0 | 1.0–2.0 | 1040 | $845 | $0.81 | 3d | 1 | 0.37mi |
| 4425 NW 31st St Oklahoma City, OK | 3.0 | 1.5 | 1222 | $1,500 | $1.23 | 23d | 1 | 0.39mi |
| 3929 NW 32nd St Oklahoma City, OK | 3.0 | 1.0 | 1050 | $1,300 | $1.24 | 43d | 1 | 0.45mi |
| 3912 NW 32nd St Oklahoma City, OK | 2.0 | 1.0 | 894 | $1,099 | $1.23 | 43d | 1 | 0.46mi |
| 3829 NW 26th St Oklahoma City, OK | 2.0 | 1.0 | 895 | $1,125 | $1.26 | 2d | 1 | 0.48mi |
| 3411 Cameron Ct Oklahoma City, OK | 2.0 | 2.0 | 1409 | $1,300 | $0.92 | 23d | 1 | 0.49mi |
| 3411 Cameron Ct Oklahoma City, OK | 2.0 | 2.0 | 1409 | $1,300 | $0.92 | 43d | 1 | 0.49mi |
| 4396 NW 36th St Oklahoma City, OK | 1.0–3.0 | 1.0–2.0 | 848 | $1,349 | $1.59 | 1d | 9 | 0.51mi |
| 3905 NW 23rd St Oklahoma City, OK | 2.0 | 1.5 | 1044 | $1,100 | $1.05 | 16d | 1 | 0.53mi |
| 2325 N Meridian Ave Oklahoma City, OK | 2.0 | 1.0 | 800 | $850 | $1.06 | 23d | 1 | 0.59mi |
| 2325 N Meridian Ave Oklahoma City, OK | 2.0 | 1.0 | 800 | $850 | $1.06 | 11d | 1 | 0.59mi |
| 4128 NW 36th St Unit 4 Oklahoma City, OK | 2.0 | 1.5 | 1130 | $1,125 | $1.00 | 23d | 1 | 0.60mi |
| 2317 N Meridian Ave Unit 35 Oklahoma City, OK | 2.0 | 1.0 | 800 | $850 | $1.06 | 16d | 1 | 0.63mi |
| 4529 NW 33rd St Oklahoma City, OK | 3.0 | 1.0 | 950 | $1,280 | $1.35 | 2d | 1 | 0.63mi |
| 3175 N Portland Ave Oklahoma City, OK | 2.0 | 1.0 | 865 | $899 | $1.04 | 43d | 1 | 0.65mi |
| 3175 N Portland Ave Oklahoma City, OK | 2.0 | 2.0 | 918 | $960 | $1.05 | 23d | 1 | 0.65mi |
| 3175 N Portland Ave Oklahoma City, OK | 1.0–2.0 | 1.0–2.0 | 809 | $960 | $1.19 | 15d | 3 | 0.65mi |
| 2221 N Meridian Ave Oklahoma City, OK | 2.0 | 1.5 | 1200 | $995 | $0.83 | 2d | 1 | 0.69mi |
| 3733 NW 22nd St Apt 210 Oklahoma City, OK | 2.0 | 1.0 | 850 | $950 | $1.12 | 43d | 1 | 0.71mi |
| 3701 NW 24th St Oklahoma City, OK | 3.0 | 2.0 | 1404 | $1,299 | $0.93 | 43d | 1 | 0.72mi |
| 4746 NW 23rd St Oklahoma City, OK | 2.0 | 1.0 | 975 | $815 | $0.84 | 2d | 1 | 0.78mi |
| 4746 NW 23rd St Oklahoma City, OK | 2.0 | 1.0 | 975 | $725 | $0.74 | 23d | 1 | 0.78mi |
| 3929 NW 18th St Oklahoma City, OK | 4.0 | 1.5 | 1347 | $1,200 | $0.89 | 1d | 1 | 0.80mi |
| 4750 NW 23rd St Unit 158 Oklahoma City, OK | 2.0 | 1.0 | 975 | $785 | $0.81 | 23d | 1 | 0.82mi |
| 4750 NW 23rd St Oklahoma City, OK | 2.0 | 1.0 | 975 | $830 | $0.85 | 23d | 1 | 0.84mi |
| 3827 N Harvard Ave Oklahoma City, OK | 2.0 | 1.5 | 988 | $1,100 | $1.11 | 21d | 1 | 0.87mi |
| 3800 NW 19th St Oklahoma City, OK | 3.0 | 1.0 | 1073 | $1,250 | $1.16 | 23d | 1 | 0.87mi |
| 4020 N Meridian Ave Oklahoma City, OK | 2.0 | 1.0 | 700 | $849 | $1.21 | 23d | 1 | 0.99mi |
| 3629 NW 18th St Oklahoma City, OK | 4.0 | 2.0 | 1176 | $1,800 | $1.53 | 43d | 1 | 1.00mi |
| 3625 NW 18th St Oklahoma City, OK | 3.0 | 2.0 | 1040 | $1,500 | $1.44 | 43d | 1 | 1.01mi |
| 4200 N Meridian Ave Oklahoma City, OK | 1.0–2.0 | 1.0–2.0 | 801 | $1,289 | $1.61 | 4d | 29 | 1.03mi |
| 3733 NW 15th St Oklahoma City, OK | 3.0 | 1.0 | 995 | $1,150 | $1.16 | 23d | 1 | 1.10mi |
| 5518 NW 23rd St Oklahoma City, OK | 2.0 | 1.0 | 659 | $940 | $1.43 | 23d | 1 | 1.17mi |
| 4213 N Westridge St Oklahoma City, OK | 3.0 | 2.0 | 1474 | $1,295 | $0.88 | 2d | 1 | 1.17mi |
| 3608 NW 16th St Oklahoma City, OK | 2.0 | 1.0 | 784 | $950 | $1.21 | 43d | 1 | 1.18mi |
| 1309 N Meridian Ave Oklahoma City, OK | 1.0–2.0 | 1.0–1.5 | 925 | $975 | $1.05 | 2d | 4 | 1.18mi |
| 1307 N Meridian Ave Oklahoma City, OK | 2.0 | 1.0–2.0 | 1242 | $925 | $0.74 | 2d | 6 | 1.21mi |
| 3228 NW 27th St Oklahoma City, OK | 2.0 | 1.0 | 1088 | $1,195 | $1.10 | 11d | 1 | 1.21mi |
| 5700 NW 23rd St Oklahoma City, OK | 3.0 | 2.0 | 1180 | $1,050 | $0.89 | 23d | 1 | 1.25mi |
| 3624 NW 42nd St Oklahoma City, OK | 1.0–2.0 | 1.0–2.0 | 1050 | $899 | $0.86 | 2d | 1 | 1.25mi |
Listing history 14 events
-
2026-06-09status $129,000 Pending 4 DOM
-
2026-06-08days on market $129,000 Active 4 DOM
-
2026-06-07statusdays on market $129,000 Active 3 DOM
-
2026-05-17status Pending 268-char remark
-
2026-04-21$129,000 Active 268-char remark
-
2026-03-18historical
-
2026-02-23$167,000 Active
-
2024-12-14historical $1,250
-
2024-12-11historical $1,250
-
2024-12-10$1,250
-
2024-11-23$1,250
-
2024-11-14historical $1,250
-
2024-11-06$1,250
-
1976-07-01soldstatus $19,433
ⓘ Source: listings_history table (triggers on properties + properties_extension) + one-shot
backfill from property_details.listing_events for pre-trigger history.
Tax reassessment forecast OK · Resets to sale price
- Current annual tax
- $1,933 · $161/mo
- Projected year-2 tax
- $1,933 · $161/mo
- Expected delta
- $0/yr ($0/mo · 0.0%)
ⓘ Screening estimate from a state-policy table — verify with the county assessor before closing.
Climate risk First Street
- Flood 1/10 Low FEMA zone X (unshaded) · 0% chance over 30 yrs
- Wildfire 1/10 Low
- Heat 6/10 Major 7 d/yr ≥107°F today · 18 d/yr by 30 yrs out
- Wind 2/10 Low 3% chance of damaging wind over 30 yrs
- Air quality 2/10 Low 1 unhealthy d/yr today · 2 by 30 yrs out
Nearby sold comps map
Loading sold comps map…
Walkable amenities ~0.75 mi
Loading nearby amenities…
Taxation est. · year 1
- Rental income
- $14,192
- − Mortgage interest
- −$7,226
- − Property taxes
- −$1,933
- − Insurance
- −$645
- − Repairs & maintenance
- −$1,135
- − Management
- −$1,135
- − Depreciation
- −$3,753
- Taxable loss
- −$1,636
- Est. tax savings @ 24.0%
- +$393
- After-tax cash flow
- $908/yr
For passive investors: Depreciation is non-cash, so a rental often shows a tax loss while cash-flowing — sheltering income. Rental losses are passive: they offset passive income freely, and up to $25,000/yr can offset ordinary (W-2) income if you actively participate and your MAGI is under $100k (phasing out to $0 by $150k); unused losses carry forward. On sale, claimed depreciation is recaptured at up to 25%, and gains may owe capital-gains tax (a 1031 exchange can defer both). Figures are a year-1 estimate at your 24.0% rate — not tax advice; consult a CPA.
Schools (NCES district)
- District
- Oklahoma City
- NCES district ID
- 4022770
- Math proficiency
- 7% ▼ -5.00%
- Reading proficiency
- 10% ▼ -6.00%
- Median HH income
- $35,606
- Composite
- 7.0/100
- National rank
- #9970
- State rank
- #254 of 270 in OK
Livability — Oklahoma City
- Score
- 80/100
- State rank
- #3
- US rank
- #1635
Category grades
Schools grade is shown separately in the Schools card above.
Census & demographics
- Census place
- Oklahoma City, OK
- County
- Oklahoma County · 771,644 people
- City population
- 498,656
- Metro
- Oklahoma City, OK
- Population (ZIP)
- 25,791
- Household income
- $56,873
- Rent vs Own
- Severe rent burden
- 1210.0
Population outlook (Oklahoma County) Hauer SSP2
- Today (2025)
- 911,875 people
- By 2030
- 982,413 · +7.7%
- By 2040
- 1,130,468 · +24.0%
- By 2050
- 1,288,422 · +41.3%
- By 2075
- 1,711,482 · +87.7%
- By 2100
- 2,088,448 · +129.0%
Race, ethnicity, and origin ACS 2023
- Neighborhood character
- Diverse neighborhood (Simpson 0.64)
- Race & ethnicity
- White 47% Hispanic / Latino 37% Two or more races 13% Native American 6% Black 5% Asian 2%
- Hispanic origin (detail)
- Mexican 22%
- Common ancestry
- Lithuanian 1% Italian 1% Slovak 1%
- Foreign-born
- 19% · Canada, Vietnam
- Languages at home
- 67% English-only · Spanish 30% Vietnamese 1%
Political lean MEDSL · Oklahoma
- 2024 margin
- Toss-up / Even · D 48.0% · R 49.7% · Other 2.3%
- 2008→2024 swing
- +15.1pp toward D · 2008: -16.8pp · 2024: -1.7pp
- All cycles
- 2024: R+1.7 2020: R+1.1 2016: R+10.5 2012: R+16.7 2008: R+16.8
Not yet ingested
- Civics
- —
Market trends
- HPI YoY
- ▼ -245.03%
- Current HPI
- 274.7844
- Rent YoY
- ▲ 7.29%
- Metro
- Oklahoma City, OK
- State GDP YoY
- ▲ 1.55%
- F500 in state
- 6
Industry mix (Fortune 500 HQ in OK)
| Industry | F500 HQs | Revenue |
|---|---|---|
| Energy | 3 | $48B |
|
||
Price history
+563.8% since first listed13 events — show timeline
- 2026-06-09 Pending — MLSOK
- 2026-06-06 Relisted — MLSOK
- 2026-05-17 Pending — MLSOK
- 2026-04-21 Listed $129,000 MLSOK
- 2026-03-18 Listing Removed — MLSOK
- 2026-02-23 Listed $167,000 MLSOK
- 2024-12-14 Rental Removed $1,250 APPFOLIO
- 2024-12-11 Rental Removed $1,250 MLSOK
- 2024-12-10 Listed for Rent $1,250 APPFOLIO
- 2024-11-23 Listed for Rent $1,250 MLSOK
- 2024-11-14 Rental Removed $1,250 MLSOK
- 2024-11-06 Listed for Rent $1,250 MLSOK
- 1976-07-01 Sold (Public Records) $19,433 Public Records
Property tax history
+6.2%/yrLatest (2025): $1,933 · +1.0% YoY. Source: county tax records.
Cash-flow waterfall
monthlySold comps — $/sqft
last 12 mo · ≤1 miLoading sold comps…