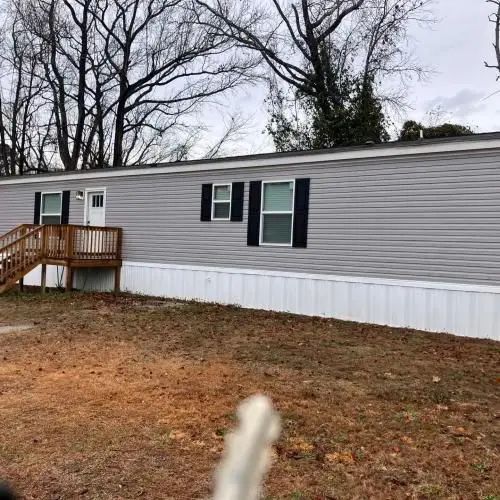
1603 Deejay Ln #29 · Greenville, NC
Flood risk 1/10 · Minimal
- FEMA flood zone
- AE
- Chance of flooding over 30 yrs
- 0.0%
- Est. flood insurance / yr
- $1,737 – $8,500
Fire risk 2/10 · Minimal
- Est. fire insurance / yr
- $906 – $1,684
Heat risk 8/10 · Major
- Hot days now (above 106°F)
- 7 days/yr
- Hot days in 30 yrs
- 17 days/yr
Wind risk 8/10 · Major
- Chance of severe wind over 30 yrs
- 80.0%
Air-quality risk 3/10 · Minor
- Unhealthy air days now
- 2 days/yr
- Unhealthy air days in 30 yrs
- 3 days/yr
Risk factors via First Street. Map © Google.
Why this score? — see what drove the B grade
The composite is a weighted blend of 9 inputs, each scored 0–100. Each bar is that input's sub-score; the figure is the points it added to the 100-point composite (weight × sub-score).
- Cash flow +30.0/30.0
- 1% rule +10.0/10.0
- DSCR +10.0/10.0
- ARV discount +7.5/15.0
- Condition / age +4.0/5.0
- Rent growth +3.9/5.0
- Livability +3.9/5.0
- Schools +3.6/10.0
- Appreciation +0.0/10.0
$68,999
🖨 Deal sheet 📄 Offer letter ✓ Due diligence
Key facts
- Built 2026
- Listed 45 days
Property features AI
Finance
- Financial info: List price: $68,999
Exterior
- Home design: Spec new-construction plan named Voyage
- Construction: Living area approximately 1,216 (listed)
- Exterior features: Shake roof
Interior
- Bedrooms: 3 bedrooms
- Heating & cooling: Electric forced-air heating; Central air conditioning
- Interior features: 2 full bathrooms
Neighborhood map
What this means for you Summary
Snapshot
- This is a 3-bed/2.0-bath single-family listed at $69k. Condition is rated good.
Deal economics
- At list price, monthly cash flow is $229 ($3k/yr) — positive.
- The deal already cash-flows at list — no discount required.
- Meets the 1% rule at list price ($1k rent vs $69k).
- Recommended offer: $67k (3.0% below list) — sets the bar for market timing.
- Cap rate 17.7% vs local median 3.8% in Greenville — top-decile yield for the area; either an underpriced asset or a hidden risk that comps aren't pricing in. Stress-test before assuming the spread holds.
Location & tenants
- Location reads 77/100 on livability (#30 in NC, #2,977 nationally) — a middle-class / working-renter tenant base. Strengths: commute A+, cost of living A+, health & safety A+; Watch: schools C-, crime F, employment F.
- Pitt County Schools (rural): math 41% / reading 44% proficiency, ranked #100 of 178 in NC (top 56%) — families likely to look elsewhere, expect single-tenant / working-renter base with shorter leases.
- Market conditions: Rents rising fast (+5.4%/yr); 350 active listings in the ZIP; 2 comparable units currently listed for rent nearby; 1,300 units permitted in Pitt County in 2024 (204 in 5+ unit buildings).
- This rent runs 35% of the median local income ($49k/yr) — at the standard rent-burdened threshold; future hikes will face affordability resistance.
Forward outlook
- Local home prices are declining (-3.0%/yr); year-one equity from $477 of loan paydown is wiped out by about $2k of value loss. Plan a longer hold.
- Pitt County population projected at +22% by 2050 — long-run rental-demand tailwind backs the buy-and-hold thesis.
- At projected returns (-3.0% appreciation + 5.4% rent growth), your $19k cash investment doubles in ~7 years — after that, you're playing with house money.
Negotiation context
- It's been on market 46 days — a 3% lower offer ($67k) is reasonable based on typical stale-listing flexibility.
Risks & watch-outs
- Watch-outs: flood insurance adds $427/mo.
- Climate carrying-cost: in FEMA flood zone AE (mandatory federal flood insurance); severe wind risk, 80% chance of damaging wind over 30y; extreme-heat days projected 7→17/yr by 2055 (HVAC capex compounding) — expect insurance premiums to compound above CPI over the hold.
Questions for the listing agent
- It's been on market 46 days. Have you received any prior offers? Is the seller open to a 3% concession, seller financing, or rate buy-down credit?
- What's the actual annual flood-insurance premium (NFIP or private), and is the property in a SFHA with mandatory coverage?
- Is there a deadline driving the sale (1031 exchange, divorce, estate, relocation)? That informs how much negotiation room exists.
- Crime grade is F in this area — have there been break-ins, vandalism, or insurance claims at this property in the last 3 years? What carrier currently insures it and at what premium?
- What's the average days-on-market for RENTAL listings here right now (not sales)? A rising rental-DOM trend means longer vacancies and softer asking-rent achievability than the comps imply.
- What's the recent tenant-quality profile in this submarket — average credit score on applications, eviction rate, late-payment / NSF rate, and stable-employment percentage? A property-management company in the area should have these aggregated.
- How much new for-sale + rental construction is in the pipeline within 1–3 miles? Heavy new supply typically softens prices + rents 12–24 months out; constrained supply supports both.
Investment metrics
- 1% rule
- 2.08% ✓
- Cap rate
- 17.69%
- Cash-on-cash
- 40.71%
- DSCR
- 2.81
- GRM
- 4.0
CMA / ARV
- ARV (on-the-fly)
- $145,920
- Comps found
- 1
Show comp detail 1 sale within ~0.75 mi
| Address | Dist | Beds/Ba | Sqft | Sold | Price | $/sf | Match |
|---|---|---|---|---|---|---|---|
| 3121 Maye Ln | 0.51mi | 3/2.0 | 1,252 (+3%) | 16mo | $150,000 | $120 | 58 |
Match score weights: distance 35% · size 25% · config 20% · recency 20%. Top-matched comps best support the ARV.
Projected returns pro-forma
-3.0% appreciation · 5.44% rent growth · sell at horizon
- IRR
- 9.2%
- Equity multiple
- 1.38×
- Total profit
- $7,290
- Equity at exit
- $10,288
- IRR
- 21.4%
- Equity multiple
- 3.16×
- Total profit
- $41,827
- Equity at exit
- $5,966
Cash invested: $19,320 (down + closing). Projections, not guarantees.
Landlord ↔ Tenant lean methodology
- Overall (STATE)
- 85 Strongly Landlord-Friendly
- State North Carolina
- 85 Strongly Landlord-Friendly · R+3
- County
- — inherits STATE
- City
- — inherits STATE
ZIP-level market 27834
- Rents YoY
- 5.4%
- Active inventory
- 350
- Price-to-rent
- 4.0×
Monthly cashflow live
- Estimated rent
- $1,433 medium interval (Pro) →
- Mortgage (P&I)
- −$362
- Tax est. 1.5%
- −$86 /mo · $1,035/yr
- Insurance
- −$29
- Flood insurance flood zone
- −$427 /mo · $5,118/yr
- HOA
- −$0
- Vacancy / Maint / Mgmt
- −$301
- Net cashflow
- $229
Break-even live
UW: 25.0% down · 7.5% · 30yr · 1.5% tax · 5.0% vac · 8.0% maint · 8.0% mgmt
Financing live
Cash to close
- Down payment
- $17,250
- Closing costs
- $2,070
- Reserves months
- —
- Total cash needed
- —
Loan-product check · same deal, 3 products live
Conventional
25% down · 7.5% · 30yr
- Down + closing
- —
- Monthly P&I
- —
- Monthly cashflow
- —
- DSCR
- —
- Eligible?
- —
Personal DTI + credit; lowest rate.
DSCR
20% down · 8.5% · 30yr
- Down + closing
- —
- Monthly P&I
- —
- Monthly cashflow
- —
- DSCR
- —
- Eligible?
- —
No personal income docs; deal must DSCR.
Hard money
10% down · 12.0% · 12mo
- Down + closing
- —
- Monthly P&I
- —
- Monthly cashflow
- —
- DSCR
- —
- Eligible?
- —
Short-term bridge; refi at stabilization.
Rent comps 2 comps
| Address | Beds | Baths | Sqft | Rent | $/sqft | DOM | Units | Dist |
|---|---|---|---|---|---|---|---|---|
| 4020 Bostic Dr Greenville, NC | 1.0–4.0 | 1.0–4.0 | 1057 | $1,283 | $1.21 | 13d | 7 | 1.34mi |
| 121 Harbor Pointe Ln Greenville, NC | 1.0–2.0 | 1.0–1.5 | 675 | $1,050 | $1.56 | 21d | 1 | 1.46mi |
Listing history 16 events
-
2026-06-19days on market $68,999 Active 46 DOM
-
2026-06-18days on market $68,999 Active 45 DOM
-
2026-06-17days on market $68,999 Active 44 DOM
-
2026-06-16days on market $68,999 Active 43 DOM
-
2026-06-15days on market $68,999 Active 42 DOM
-
2026-06-13days on market $68,999 Active 39 DOM
-
2026-06-10days on market $68,999 Active 37 DOM
-
2026-06-09days on market $68,999 Active 36 DOM
-
2026-06-08days on market $68,999 Active 35 DOM
-
2026-06-07days on market $68,999 Active 34 DOM
-
2026-06-05days on market $68,999 Active 31 DOM
-
2026-06-03days on market $68,999 Active 30 DOM
-
2026-06-02days on market $68,999 Active 29 DOM
-
2026-06-01days on market $68,999 Active 28 DOM
-
2026-05-31days on market $68,999 Active 27 DOM
-
2026-05-30days on market $68,999 Active 26 DOM
ⓘ Source: listings_history table (triggers on properties + properties_extension) + one-shot
backfill from property_details.listing_events for pre-trigger history.
Climate risk First Street
- Flood 1/10 Low FEMA zone AE · 0% chance over 30 yrs
- Wildfire 2/10 Low
- Heat 8/10 Severe 7 d/yr ≥106°F today · 17 d/yr by 30 yrs out
- Wind 8/10 Severe 80% chance of damaging wind over 30 yrs
- Air quality 3/10 Moderate 2 unhealthy d/yr today · 3 by 30 yrs out
Nearby sold comps map
Loading sold comps map…
Walkable amenities ~0.75 mi
Loading nearby amenities…
Taxation est. · year 1
- Rental income
- $17,200
- − Mortgage interest
- −$3,865
- − Property taxes
- −$1,035
- − Insurance
- −$5,463
- − Repairs & maintenance
- −$1,376
- − Management
- −$1,376
- − Depreciation
- −$2,007
- Taxable income
- $2,077
- Est. tax owed @ 24.0%
- −$499
- After-tax cash flow
- $2,249/yr
For passive investors: Depreciation is non-cash, so a rental often shows a tax loss while cash-flowing — sheltering income. Rental losses are passive: they offset passive income freely, and up to $25,000/yr can offset ordinary (W-2) income if you actively participate and your MAGI is under $100k (phasing out to $0 by $150k); unused losses carry forward. On sale, claimed depreciation is recaptured at up to 25%, and gains may owe capital-gains tax (a 1031 exchange can defer both). Figures are a year-1 estimate at your 24.0% rate — not tax advice; consult a CPA.
Condition & rehab AI · 12 photos
This home is in excellent condition with modern updates, making it a great investment for both resale and rental.
Value-add opportunities
- Both Paint exterior — Enhances curb appeal and value
- Both Replace deck railings — Improves safety and aesthetics
- Both Install smart home devices — Enhances convenience and marketability
Renovation cost estimate screening
Value-add ROI direction
- Both Paint exterior — Enhances curb appeal and value ↑
- Both Replace deck railings — Improves safety and aesthetics ↑
- Both Install smart home devices — Enhances convenience and marketability ↑
ⓘ Cost ranges are severity-bucket heuristics (US national rule-of-thumb). Get contractor quotes + a written scope before underwriting a rehab budget.
Schools (NCES district)
- District
- Pitt County Schools
- NCES district ID
- 3700012
- Math proficiency
- 41% ▬ 0.00%
- Reading proficiency
- 44% ▲ 2.00%
- Median HH income
- $40,631
- Composite
- 35.67/100
- National rank
- #4877
- State rank
- #100 of 178 in NC
Livability — Greenville
- Score
- 77/100
- State rank
- #30
- US rank
- #2977
Category grades
Schools grade is shown separately in the Schools card above.
Census & demographics
- County
- Pitt County · 142,592 people
- City population
- 115,121
- Metro
- Greenville, NC
- Population (ZIP)
- 56,347
- Household income
- $48,935
- Rent vs Own
- Severe rent burden
- 3319.0
Population outlook (Pitt County) Hauer SSP2
- Today (2025)
- 194,585 people
- By 2030
- 203,756 · +4.7%
- By 2040
- 220,807 · +13.5%
- By 2050
- 236,614 · +21.6%
- By 2075
- 275,940 · +41.8%
- By 2100
- 300,058 · +54.2%
Race, ethnicity, and origin ACS 2023
- Neighborhood character
- Diverse neighborhood (Simpson 0.59)
- Race & ethnicity
- Black 54% White 33% Hispanic / Latino 8% Two or more races 3% Asian 2%
- Hispanic origin (detail)
- Mexican 7%
- Common ancestry
- Lithuanian 1% Slovak 1% Romanian 1%
- Foreign-born
- 7% · Canada, China
- Languages at home
- 91% English-only · Spanish 6% Other Asian/Pacific 1%
Political lean MEDSL · Pitt
- 2024 margin
- Lean D (+6.0) · D 52.5% · R 46.5% · Other 1.1%
- 2008→2024 swing
- -2.8pp toward R · 2008: 8.8pp · 2024: 6.0pp
- All cycles
- 2024: D+6.0 2020: D+9.4 2016: D+7.4 2012: D+6.7 2008: D+8.8
Not yet ingested
- Civics
- —
Market trends
- HPI YoY
- ▼ -187.99%
- Current HPI
- 190.6869
- Rent YoY
- ▲ 5.44%
- Metro
- Greenville, NC
- State GDP YoY
- ▲ 3.28%
- F500 in state
- 26
Industry mix (Fortune 500 HQ in NC)
| Industry | F500 HQs | Revenue |
|---|---|---|
| Financial Services | 2 | $213B |
|
||
| Retail | 2 | $95B |
|
||
| Industrial Conglomerate | 1 | $38B |
|
||
| Metals / Steel | 1 | $35B |
|
||
| Utilities | 1 | $30B |
|
||
| Industrial Machinery | 1 | $19B |
|
||
Cash-flow waterfall
monthlySold comps — $/sqft
last 12 mo · ≤1 miLoading sold comps…