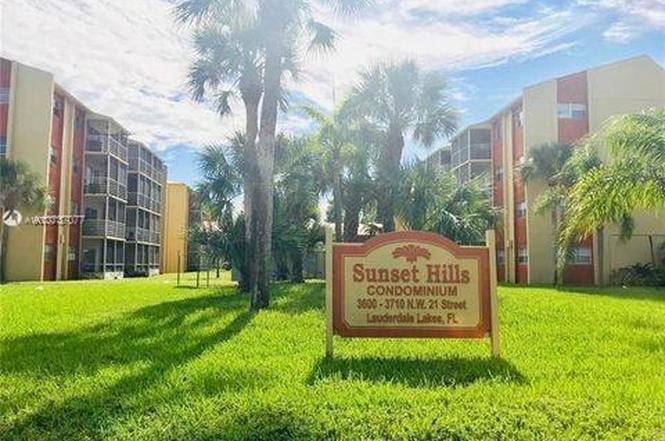
3710 NW 21st St #411 · Lauderdale Lakes, FL
Flood risk No data
- FEMA flood zone
- —
- Chance of flooding over 30 yrs
- —
- Est. flood insurance / yr
- —
Fire risk No data
- Est. fire insurance / yr
- —
Heat risk No data
- Hot days now (above threshold)
- —
- Hot days in 30 yrs
- —
Wind risk No data
- Chance of severe wind over 30 yrs
- —
Air-quality risk No data
- Unhealthy air days now
- —
- Unhealthy air days in 30 yrs
- —
Risk factors via First Street. Map © Google.
Why this score? — see what drove the C grade
The composite is a weighted blend of 9 inputs, each scored 0–100. Each bar is that input's sub-score; the figure is the points it added to the 100-point composite (weight × sub-score).
- Cash flow +19.2/30.0
- 1% rule +9.1/10.0
- ARV discount +7.5/15.0
- DSCR +6.0/10.0
- Schools +4.1/10.0
- Livability +4.0/5.0
- Rent growth +3.2/5.0
- Condition / age +2.5/5.0
- Appreciation +0.0/10.0
$120,000
🖨 Deal sheet (PDF) 📄 Offer letter ✓ Due diligence
Listing remarks
Embrace the Sunset Hills Condo lifestyle. This unit is nestled in a secure gated community at Broward's heart. Enjoy a well-lit space with abundant closet room, an open kitchen, and alluring tile floors. Experience easy access to commercial center, offices, schools, and major expressways.
Key facts
- Tile floors
- Abundant closet room
- Open kitchen
Tags
Property features AI
Finance
- Other: Pets allowed with restrictions
- HOA & community: Monthly association fee; Association fee includes grounds maintenance; Elevation access (elevator); Community pool
Exterior
- Parking: One parking space
- Utilities: Cable available
- Home design: 4-story building; Unit entry on 4th level; Attached property
- Construction: Block construction; Resale property
- Exterior features: Association pool
Interior
- Kitchen: Dishwasher; Microwave; Refrigerator
- Bathrooms: 1 full bathroom
- Interior features: Other interior features
Neighborhood map
What this means for you Summary
Snapshot
- This is a 1-bed/1.0-bath condo listed at $120k.
Deal economics
- At list price, monthly cash flow is $129 ($2k/yr) — positive.
- The deal already cash-flows at list — no discount required.
- Meets the 1% rule at list price ($2k rent vs $120k).
- Recommended offer: $106k (12.0% below list) — sets the bar for market timing.
- Cap rate 7.6% vs local median 5.6% in Lauderdale Lakes — top-decile yield for the area; either an underpriced asset or a hidden risk that comps aren't pricing in. Stress-test before assuming the spread holds.
Location & tenants
- Location reads 81/100 on livability (#100 in FL, #1,527 nationally) — a professional / high-income tenant draw. Strengths: commute A+, cost of living A+, housing A+; Watch: crime D+, amenities F, employment F.
- Broward (suburban): math 42% / reading 53% proficiency, ranked #46 of 73 in FL (top 63%) — families likely to look elsewhere, expect single-tenant / working-renter base with shorter leases.
- Zoned schools: Nova Blanche Forman Elementary (math 35% / reading 55%, grade D-, #1,271 of 2,144 statewide, top 60%, 769 students, 72% FRL); Nova Middle School (math 44% / reading 53%, grade C-, #274 of 571 statewide, top 50%, 1,284 students, 68% FRL); Nova High School (math 22% / reading 56%, grade F, #312 of 667 statewide, top 48%, 2,227 students, 59% FRL) — zoned schools average 66% FRL vs 51% district-wide (15 pts higher); higher-poverty schools than district average — tighter screening recommended.
- Market conditions: Rents rising (+2.8%/yr); 590 active listings in the ZIP; 40 comparable units currently listed for rent nearby; rentals at typical pace (median 23d on market — plan ~3-4 weeks tenant-placement turnaround); 2,111 units permitted in Broward County in 2024 (1,265 in 5+ unit buildings).
- This rent runs 38% of the median local income ($54k/yr) — at the standard rent-burdened threshold; future hikes will face affordability resistance.
Forward outlook
- Local home prices are declining (-3.0%/yr); year-one equity from $830 of loan paydown is wiped out by about $4k of value loss. Plan a longer hold.
- Broward County population projected at +34% by 2050 — long-run rental-demand tailwind backs the buy-and-hold thesis.
Negotiation context
- It's been on market 427 days — a 12% lower offer ($106k) is reasonable based on typical stale-listing flexibility.
- 11 sale attempts since 13y ago; this cycle's ask is 7900% above the opening price — seller raised mid-cycle; expect resistance to lowballs.
- Current owner paid $75k; list at $120k implies a 60% gain — meaningful room to come down on a strong offer.
Questions for the listing agent
- It's been on market 427 days. Have you received any prior offers? Is the seller open to a 12% concession, seller financing, or rate buy-down credit?
- Built in 1979 — when were the roof, HVAC, electrical panel, plumbing, and water heater last replaced?
- What does the HOA fee cover, when was the last increase, and are there any pending special assessments or reserve-fund shortfalls?
- Any open or pending special assessments — roof, HVAC, plumbing, elevator, façade? What's the per-unit balance and payoff schedule, and is the seller paying it off at close or rolling it to the buyer?
- Why hasn't it sold? Are there any deal-killer items the seller is aware of (foundation, flood, title, zoning, code violations)?
- Is there a deadline driving the sale (1031 exchange, divorce, estate, relocation)? That informs how much negotiation room exists.
- Crime grade is D in this area — have there been break-ins, vandalism, or insurance claims at this property in the last 3 years? What carrier currently insures it and at what premium?
- What's the average days-on-market for RENTAL listings here right now (not sales)? A rising rental-DOM trend means longer vacancies and softer asking-rent achievability than the comps imply.
- What's the recent tenant-quality profile in this submarket — average credit score on applications, eviction rate, late-payment / NSF rate, and stable-employment percentage? A property-management company in the area should have these aggregated.
- How much new apartment / multifamily construction is in the pipeline within 1–3 miles? Heavy new supply (>2% of stock underway) typically softens rents 12–24 months out; light construction supports rent growth.
Investment metrics
- 1% rule
- 1.41% ✓
- Cap rate
- 7.58%
- Cash-on-cash
- 4.59%
- DSCR
- 1.20
- GRM
- 5.9
CMA / ARV
No comps found within radius.
Projected returns pro-forma
-3.0% appreciation · 2.78% rent growth · sell at horizon
- IRR
- -9.3%
- Equity multiple
- 0.66×
- Total profit
- $-11,375
- Equity at exit
- $17,892
- IRR
- 0.1%
- Equity multiple
- 1.00×
- Total profit
- $158
- Equity at exit
- $10,375
Cash invested: $33,600 (down + closing). Projections, not guarantees.
Landlord ↔ Tenant lean methodology
- Overall (STATE)
- 87 Strongly Landlord-Friendly
- State Florida
- 87 Strongly Landlord-Friendly · R+3
- County
- — inherits STATE
- City
- — inherits STATE
ZIP-level market 33311
- Rents YoY
- 2.8%
- Active inventory
- 590
- Price-to-rent
- 5.9×
Monthly cashflow live
- Estimated rent
- $1,691 high interval (Pro) →
- Mortgage (P&I)
- −$629
- Tax from tax record
- −$221 /mo · $2,651/yr
- Insurance
- −$50
- HOA
- −$307
- Vacancy / Maint / Mgmt
- −$355
- Net cashflow
- $129
Break-even live
Sensitivity live
| Price | -10% $196 | -5% $162 | +0% $129 | +5% $95 | +10% $61 |
|---|---|---|---|---|---|
| Rent | -10% $-5 | -5% $62 | +0% $129 | +5% $195 | +10% $262 |
| Rate | -1.0pp $189 | -0.5pp $159 | base $129 | +0.5pp $97 | +1.0pp $66 |
UW: 25.0% down · 7.5% · 30yr · 1.5% tax · 5.0% vac · 8.0% maint · 8.0% mgmt
Financing live
Cash to close
- Down payment
- $30,000
- Closing costs
- $3,600
- Reserves months
- —
- Total cash needed
- —
Loan-product check · same deal, 3 products live
Conventional
25% down · 7.5% · 30yr
- Down + closing
- —
- Monthly P&I
- —
- Monthly cashflow
- —
- DSCR
- —
- Eligible?
- —
Personal DTI + credit; lowest rate.
DSCR
20% down · 8.5% · 30yr
- Down + closing
- —
- Monthly P&I
- —
- Monthly cashflow
- —
- DSCR
- —
- Eligible?
- —
No personal income docs; deal must DSCR.
Hard money
10% down · 12.0% · 12mo
- Down + closing
- —
- Monthly P&I
- —
- Monthly cashflow
- —
- DSCR
- —
- Eligible?
- —
Short-term bridge; refi at stabilization.
Rent comps 40 comps
| Address | Beds | Baths | Sqft | Rent | $/sqft | DOM | Units | Dist |
|---|---|---|---|---|---|---|---|---|
| 3710 NW 21st St #305 Lauderdale Lakes, FL | 2.0 | 2.0 | 1100 | $1,650 | $1.50 | 26d | 1 | 0.01mi |
| 3610 NW 21st St #308 Lauderdale Lakes, FL | 2.0 | 2.0 | 1100 | $1,750 | $1.59 | 24d | 1 | 0.04mi |
| 3610 NW 21st St #413 Lauderdale Lakes, FL | 2.0 | 2.0 | 1100 | $1,750 | $1.59 | 22d | 1 | 0.04mi |
| 3610 NW 21st St Lauderdale Lakes, FL | 1.0–2.0 | 1.0–2.0 | 950 | $1,500 | $1.58 | 26d | 2 | 0.04mi |
| 3700 NW 21st St #203 Lauderdale Lakes, FL | 1.0 | 1.0 | 800 | $1,500 | $1.88 | 22d | 1 | 0.10mi |
| 2725 Somerset Dr Lauderdale Lakes, FL | 1.0–2.0 | 1.0–2.0 | 990 | $1,685 | $1.70 | 26d | 1 | 0.53mi |
| 4160 NW 21st St Lauderhill, FL | 1.0–2.0 | 1.0 | 810 | $1,599 | $1.97 | 1d | 3 | 0.54mi |
| 4160 NW 21st St Lauderhill, FL | 1.0–2.0 | 1.0 | 810 | $1,675 | $2.07 | 26d | 3 | 0.54mi |
| 2871 Somerset Dr #207 Lauderdale Lakes, FL | 1.0 | 1.0 | 644 | $1,400 | $2.17 | 26d | 1 | 0.55mi |
| 4047 NW 16th St #109 Lauderhill, FL | 1.0 | 1.0 | 725 | $1,300 | $1.79 | 26d | 1 | 0.57mi |
| 4240 NW 21st St #134 Lauderhill, FL | 1.0 | 1.0 | 812 | $1,500 | $1.85 | 26d | 1 | 0.58mi |
| 2801 Somerset Dr Lauderdale Lakes, FL | 2.0 | 2.0 | 865 | $1,775 | $2.05 | 26d | 2 | 0.62mi |
| 2851 Somerset Dr Lauderdale Lakes, FL | 1.0–2.0 | 1.0–2.0 | 827 | $1,300 | $1.57 | 5d | 2 | 0.62mi |
| 3507 NW 13th St Unit 3507 Lauderhill, FL | 2.0 | 2.5 | 1120 | $2,450 | $2.19 | 7d | 1 | 0.64mi |
| 2811 Somerset Dr #412 Lauderdale Lakes, FL | 2.0 | 2.0 | 865 | $1,700 | $1.97 | 9d | 1 | 0.66mi |
| 3484 NW 13th St Fort Lauderdale, FL | 2.0 | 2.5 | 1120 | $2,100 | $1.88 | 26d | 1 | 0.67mi |
| 2700 NW 39th Way Lauderdale Lakes, FL | 2.0–3.0 | 1.0–1.5 | 858 | $1,750 | $2.04 | 1d | 6 | 0.67mi |
| 2841 Somerset Dr Lauderdale Lakes, FL | 1.0 | 1.0 | 696 | $1,598 | $2.30 | 13d | 3 | 0.69mi |
| 3021 NW 17th St Fort Lauderdale, FL | 2.0 | 1.0 | 910 | $1,375 | $1.51 | 1d | 1 | 0.70mi |
| 2821 Somerset Dr #217 Lauderdale Lakes, FL | 1.0 | 1.0 | 748 | $1,400 | $1.87 | 4d | 1 | 0.72mi |
| 2070 NW 43rd Ter #6 Lauderhill, FL | 1.0 | 1.0 | 600 | $1,600 | $2.67 | 24d | 1 | 0.72mi |
| 2800 Somerset Dr Unit 418J Lauderdale Lakes, FL | 2.0 | 2.0 | 1010 | $1,800 | $1.78 | 17d | 1 | 0.75mi |
| 4121 NW 26th St Unit T16 Lauderhill, FL | 1.0 | 1.5 | 750 | $1,500 | $2.00 | 26d | 1 | 0.76mi |
| 2830 Somerset Dr Lauderdale Lakes, FL | 2.0 | 2.0 | 1010 | $1,925 | $1.91 | 12d | 2 | 0.77mi |
| 4299 NW 16th St #103 Lauderhill, FL | 1.0 | 1.0 | 700 | $1,400 | $2.00 | 26d | 1 | 0.77mi |
| 4299 NW 16th St #103 Lauderhill, FL | 1.0 | 1.0 | 700 | $1,400 | $2.00 | 9d | 1 | 0.77mi |
| 4141 NW 26th St #316 Lauderhill, FL | 1.0 | 1.0 | 624 | $1,450 | $2.32 | 26d | 1 | 0.78mi |
| 2040 NW 29th Ter Unit 2040 Fort Lauderdale, FL | 2.0 | 1.0 | 916 | $2,400 | $2.62 | 9d | 1 | 0.79mi |
| 2040 NW 29th Ter Unit 2040 Fort Lauderdale, FL | 2.0 | 1.0 | 916 | $2,600 | $2.84 | 17d | 1 | 0.79mi |
| 3390 NW 30th St Unit 3 Lauderdale Lakes, FL | 2.0 | 1.0 | 800 | $1,650 | $2.06 | 26d | 1 | 0.79mi |
| 4491 NW 19th St Lauderhill, FL | 1.0–3.0 | 1.0–2.5 | 1358 | $1,615 | $1.19 | 1d | 37 | 0.81mi |
| 3621 NW 30th Ct Oakland Park, FL | 2.0 | 2.5 | 1104 | $2,695 | $2.44 | 16d | 1 | 0.82mi |
| 4321 NW 16th St Unit 202C Lauderhill, FL | 2.0 | 2.0 | 867 | $1,700 | $1.96 | 26d | 1 | 0.83mi |
| 1490 NW 43rd Ave #206 Lauderhill, FL | 2.0 | 2.0 | 950 | $1,800 | $1.89 | 22d | 1 | 0.84mi |
| 1599 NW 43rd Ave #106 Lauderhill, FL | 1.0 | 1.0 | 730 | $1,499 | $2.05 | 19d | 1 | 0.84mi |
| 1196 NW 40th Ave Lauderhill, FL | 1.0–2.0 | 1.0 | 825 | $1,540 | $1.87 | 3d | 10 | 0.84mi |
| 1501 NW 43rd Ave #204 Lauderhill, FL | 2.0 | 2.0 | 950 | $1,650 | $1.74 | 26d | 1 | 0.88mi |
| 3541 NW 30th Pl Lauderdale Lakes, FL | 1.0–3.0 | 1.0–2.0 | 865 | $1,739 | $2.01 | 0d | 16 | 0.88mi |
| 2029 NW 46th Ave Lauderhill, FL | 1.0 | 1.5 | 800 | $1,500 | $1.88 | 26d | 1 | 0.91mi |
| 2017 NW 46th Ave Unit A110 Lauderhill, FL | 1.0 | 1.5 | 800 | $1,650 | $2.06 | 26d | 1 | 0.91mi |
HOA detail condo
- Monthly dues
- $307 · $3,684/yr
- Likely covers
- security
- Assessments
- None detected in remarks — confirm with the listing agent.
Listing history 35 events
-
2026-02-12price $120,000
-
2026-01-03historical $1,300
-
2025-10-09price $1,300
-
2025-08-29price $1,400
-
2025-07-30$1,500
-
2025-07-16status Active
-
2025-04-03price $130,000
-
2025-03-19price $155,000
-
2025-02-27$160,000 Active
-
2025-01-28historical
-
2024-03-11$140,000 Active
-
2024-03-05historical
-
2023-11-09$160,000 Active
-
2023-11-08historical
-
2023-09-22price $175,000
-
2023-08-14$165,000 Active
-
2022-01-31historical
-
2021-09-01price $125,000
-
2021-01-26price $110,000
-
2020-01-13$95,000 Active
-
2019-12-10soldstatus $75,000
-
2019-12-06soldstatus $75,000 Closed
-
2019-11-07status Active
-
2019-10-11historical Active Under Contract
-
2019-10-11status Active
-
2019-10-09status Pending
-
2019-09-27price $79,000
-
2019-09-10$75,000 Active
-
2013-12-13soldstatus $37,500
-
2013-12-03soldstatus $37,500 Sold
-
2013-11-01status Pending
-
2013-10-17$38,000 Active
-
2004-05-19soldstatus $22,500
-
1984-06-01soldstatus $23,500
-
1980-04-01soldstatus $22,900
ⓘ Source: listings_history table (triggers on properties + properties_extension) + one-shot
backfill from property_details.listing_events for pre-trigger history.
Tax reassessment forecast FL · Resets to sale price
- Current annual tax
- $2,651 · $221/mo
- Projected year-2 tax
- $2,651 · $221/mo
- Expected delta
- $0/yr ($0/mo · 0.0%)
ⓘ Screening estimate from a state-policy table — verify with the county assessor before closing.
Nearby sold comps map
Loading sold comps map…
Walkable amenities ~0.75 mi
Loading nearby amenities…
Taxation est. · year 1
- Rental income
- $20,290
- − Mortgage interest
- −$6,722
- − Property taxes
- −$2,651
- − Insurance
- −$600
- − Repairs & maintenance
- −$1,623
- − Management
- −$1,623
- − HOA
- −$3,684
- − Depreciation
- −$3,491
- Taxable loss
- −$104
- Est. tax savings @ 24.0%
- +$25
- After-tax cash flow
- $1,567/yr
For passive investors: Depreciation is non-cash, so a rental often shows a tax loss while cash-flowing — sheltering income. Rental losses are passive: they offset passive income freely, and up to $25,000/yr can offset ordinary (W-2) income if you actively participate and your MAGI is under $100k (phasing out to $0 by $150k); unused losses carry forward. On sale, claimed depreciation is recaptured at up to 25%, and gains may owe capital-gains tax (a 1031 exchange can defer both). Figures are a year-1 estimate at your 24.0% rate — not tax advice; consult a CPA.
Schools (NCES district)
- District
- Broward
- NCES district ID
- 1200180
- Math proficiency
- 42% ▼ -18.00%
- Reading proficiency
- 53% ▼ -5.00%
- Median HH income
- $52,139
- Composite
- 40.88/100
- National rank
- #3621
- State rank
- #46 of 73 in FL
Livability — Lauderdale Lakes
- Score
- 81/100
- State rank
- #100
- US rank
- #1527
Category grades
Schools grade is shown separately in the Schools card above.
Census & demographics
- Census place
- Lauderdale Lakes, FL
- County
- Broward County · 1,963,430 people
- Metro
- Miami-Fort Lauderdale-Pompano Beach, FL
- Population (ZIP)
- 74,898
- Household income
- $53,973
- Rent vs Own
- Severe rent burden
- 5068.0
Population outlook (Broward County) Hauer SSP2
- Today (2025)
- 2,207,033 people
- By 2030
- 2,360,704 · +7.0%
- By 2040
- 2,661,208 · +20.6%
- By 2050
- 2,946,698 · +33.5%
- By 2075
- 3,602,273 · +63.2%
- By 2100
- 3,970,984 · +79.9%
Race, ethnicity, and origin ACS 2023
- Neighborhood character
- Predominantly Black (77%)
- Race & ethnicity
- Black 77% Two or more races 9% White 9% Hispanic / Latino 9%
- Hispanic origin (detail)
- Mexican 1% Puerto Rican 2% Cuban 1%
- Common ancestry
- Hispanic 15% Lithuanian 1% Romanian 0%
- Foreign-born
- 24% · Canada, Jamaica
- Languages at home
- 78% English-only · French/Haitian/Cajun 14% Spanish 6% Other Indo-European 1%
Political lean MEDSL · Broward
- 2024 margin
- D (+17.0) · D 58.0% · R 41.0%
- 2008→2024 swing
- -17.8pp toward R · 2008: 34.7pp · 2024: 17.0pp
- All cycles
- 2024: D+17.0 2020: D+29.8 2016: D+35.0 2012: D+34.9 2008: D+34.7
Not yet ingested
- Civics
- —
Market trends
- HPI YoY
- ▼ -300.68%
- Current HPI
- 535.2504
- Rent YoY
- ▲ 2.78%
- Metro
- Miami-Fort Lauderdale-Pompano Beach, FL
- State GDP YoY
- ▲ 3.28%
- F500 in state
- 36
Industry mix (Fortune 500 HQ in FL)
| Industry | F500 HQs | Revenue |
|---|---|---|
| Industrial Technology | 2 | $29B |
|
||
| Insurance | 2 | $17B |
|
||
| Retail | 1 | $60B |
|
||
| Technology Distribution | 1 | $58B |
|
||
| Homebuilding | 1 | $35B |
|
||
| Technology Manufacturing | 1 | $35B |
|
||
Price history
+424.0% since first listed35 events — show timeline
- 2026-02-12 Price Changed $120,000 MARMLS
- 2026-01-03 Rental Removed $1,300 MARMLS
- 2025-10-09 Price Changed $1,300 MARMLS
- 2025-08-29 Price Changed $1,400 MARMLS
- 2025-07-30 Listed for Rent $1,500 MARMLS
- 2025-07-16 Relisted — MARMLS
- 2025-04-03 Price Changed $130,000 MARMLS
- 2025-03-19 Price Changed $155,000 MARMLS
- 2025-02-27 Listed $160,000 MARMLS
- 2025-01-28 Listing Removed — MARMLS
- 2024-03-11 Listed $140,000 MARMLS
- 2024-03-05 Listing Removed — MARMLS
- 2023-11-09 Listed $160,000 MARMLS
- 2023-11-08 Listing Removed — MARMLS
- 2023-09-22 Price Changed $175,000 MARMLS
- 2023-08-14 Listed $165,000 MARMLS
- 2022-01-31 Listing Removed — MARMLS
- 2021-09-01 Price Changed $125,000 MARMLS
- 2021-01-26 Price Changed $110,000 MARMLS
- 2020-01-13 Listed $95,000 MARMLS
- 2019-12-10 Sold (Public Records) $75,000 Public Records
- 2019-12-06 Sold (MLS) $75,000 MARMLS
- 2019-11-07 Relisted — MARMLS
- 2019-10-11 Contingent — MARMLS
- 2019-10-11 Relisted — MARMLS
- 2019-10-09 Pending — MARMLS
- 2019-09-27 Price Changed $79,000 MARMLS
- 2019-09-10 Listed $75,000 MARMLS
- 2013-12-13 Sold (Public Records) $37,500 Public Records
- 2013-12-03 Sold (MLS) $37,500 MARMLS
- 2013-11-01 Pending — MARMLS
- 2013-10-17 Listed $38,000 MARMLS
- 2004-05-19 Sold (Public Records) $22,500 Public Records
- 1984-06-01 Sold (Public Records) $23,500 Public Records
- 1980-04-01 Sold (Public Records) $22,900 Public Records
Property tax history
+12.5%/yrLatest (2025): $2,651 · +8.3% YoY. Source: county tax records.
Cash-flow waterfall
monthlySold comps — $/sqft
last 12 mo · ≤1 miLoading sold comps…