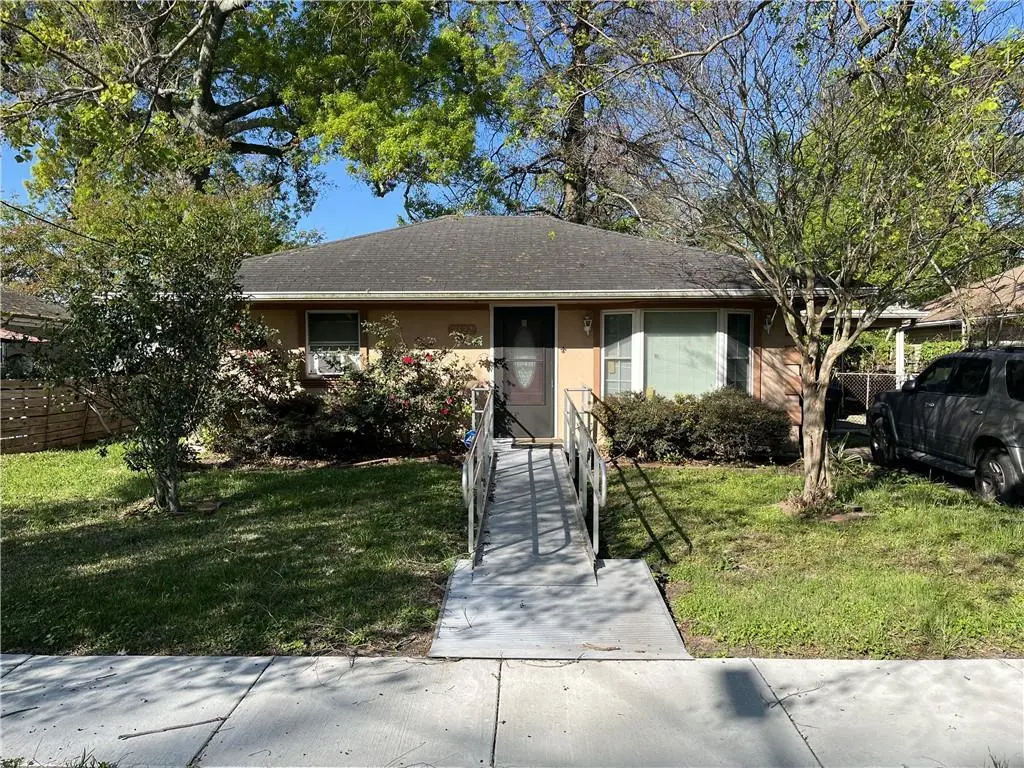
4522 Gallier Dr · New Orleans, LA
Flood risk 8/10 · Major
- FEMA flood zone
- X (shaded)
- Chance of flooding over 30 yrs
- 0.6%
- Est. flood insurance / yr
- $507 – $1,088
Fire risk 1/10 · Minimal
- Est. fire insurance / yr
- $1,269 – $2,357
Heat risk 10/10 · Severe
- Hot days now (above 107°F)
- 7 days/yr
- Hot days in 30 yrs
- 21 days/yr
Wind risk 10/10 · Severe
- Chance of severe wind over 30 yrs
- 99.0%
Air-quality risk 3/10 · Minor
- Unhealthy air days now
- 3 days/yr
- Unhealthy air days in 30 yrs
- 3 days/yr
Risk factors via First Street. Map © Google.
Why this score? — see what drove the B+ grade
The composite is a weighted blend of 9 inputs, each scored 0–100. Each bar is that input's sub-score; the figure is the points it added to the 100-point composite (weight × sub-score).
- Cash flow +30.0/30.0
- ARV discount +15.0/15.0
- 1% rule +10.0/10.0
- DSCR +10.0/10.0
- Livability +4.0/5.0
- Condition / age +2.5/5.0
- Rent growth +2.4/5.0
- Schools +1.6/10.0
- Appreciation +0.0/10.0
$85,000
🖨 Deal sheet (PDF) 📄 Offer letter ✓ Due diligence
Listing remarks MLS
Good Investment in Gentilly Woods! This property provides a great opportunity to add to your rental portfolio or a quick fix and flip with cosmetic updates. The roof was replaced in 2023. Property is priced with repairs in mind. Schedule your showing and submit your offers. Property being sold as-is. Seller to make no repairs. Inspections are for informational purposes only.
Key facts
- Roof replaced
- 5,858 sq ft lot
- Parking
Tags
Neighborhood map
What this means for you Summary
Snapshot
- This is a 2-bed/1.0-bath single-family listed at $85k.
Deal economics
- At list price, monthly cash flow is $665 ($8k/yr) — positive.
- The deal already cash-flows at list — no discount required.
- Meets the 1% rule at list price ($2k rent vs $85k).
- Cap rate 16.6% vs local median 4.4% in New Orleans — top-decile yield for the area; either an underpriced asset or a hidden risk that comps aren't pricing in. Stress-test before assuming the spread holds.
Location & tenants
- Location reads 81/100 on livability (#3 in LA, #1,383 nationally) — a professional / high-income tenant draw. Strengths: amenities A+, commute A+, health & safety A+; Watch: crime C-, employment D.
- Orleans Parish (urban): math 11% / reading 27% proficiency, ranked #69 of 98 in LA (top 70%) — low school quality limits family demand, transient renter base, plan for 1-2y turnover; 68% free/reduced lunch — lower-income household profile, screen leases tightly.
- Market conditions: Rents soft (-0.2%/yr); 224 active listings in the ZIP; 40 comparable units currently listed for rent nearby; rentals at typical pace (median 25d on market — plan ~3-4 weeks tenant-placement turnaround); lower-income renter base — watch delinquency; 710 units permitted in Orleans Parish in 2024 (244 in 5+ unit buildings).
- At $1,669/mo this rent would consume 48% of the median local household income ($42k/yr) (locally 1767% of renters already pay >50% of income on rent) — very limited rent-growth headroom before tenants either downsize or default.
Forward outlook
- Local home prices are declining (-3.0%/yr); year-one equity from $588 of loan paydown is wiped out by about $3k of value loss. Plan a longer hold.
- Orleans County population projected at +61% by 2050 — long-run rental-demand tailwind backs the buy-and-hold thesis.
- At projected returns (-3.0% appreciation + 0.0% rent growth), your $24k cash investment doubles in ~4 years — after that, you're playing with house money.
Negotiation context
- Only 10 days on market — expect competitive offers; lowballing is unlikely to land.
- 2 sale attempts with the ask held roughly flat each time — persistent listings suggest the price (not the market) is what's stuck; bring a comps-based counter.
- Current owner paid $57k; 49% above their basis — modest negotiation headroom, anchor on the comps not their cost.
Risks & watch-outs
- Watch-outs: flood insurance adds $66/mo.
- Climate carrying-cost: severe flood risk; severe wind risk, 99% chance of damaging wind over 30y; extreme-heat days projected 7→21/yr by 2055 (HVAC capex compounding) — expect insurance premiums to compound above CPI over the hold.
Questions for the listing agent
- Built in 1978 — when were the roof, HVAC, electrical panel, plumbing, and water heater last replaced?
- What's the actual annual flood-insurance premium (NFIP or private), and is the property in a SFHA with mandatory coverage?
- Is there a deadline driving the sale (1031 exchange, divorce, estate, relocation)? That informs how much negotiation room exists.
- What's the average days-on-market for RENTAL listings here right now (not sales)? A rising rental-DOM trend means longer vacancies and softer asking-rent achievability than the comps imply.
- What's the recent tenant-quality profile in this submarket — average credit score on applications, eviction rate, late-payment / NSF rate, and stable-employment percentage? A property-management company in the area should have these aggregated.
- How much new for-sale + rental construction is in the pipeline within 1–3 miles? Heavy new supply typically softens prices + rents 12–24 months out; constrained supply supports both.
Investment metrics
- 1% rule
- 1.96% ✓
- Cap rate
- 16.62%
- Cash-on-cash
- 36.88%
- DSCR
- 2.64
- GRM
- 4.2
CMA / ARV
- ARV (on-the-fly)
- $143,058
- Comps found
- 12
Show comp detail 12 sales within ~0.75 mi
| Address | Dist | Beds/Ba | Sqft | Sold | Price | $/sf | Match |
|---|---|---|---|---|---|---|---|
| 5012 Stephen Girard Ave | 0.10mi | 3/1.0 (+1) | 1,150 (-9%) | 2mo | $130,000 | $113 | 73 |
| 4842 Pauline Dr | 0.21mi | 3/2.0 (+1) | 1,236 (-2%) | 12mo | $223,500 | $181 | 67 |
| 4501 Mirabeau Ave | 0.30mi | 2/1.0 | 1,233 (-3%) | 19mo | $37,500 | $30 | 66 |
| 5061 Stephen Girard Ave | 0.15mi | 3/2.0 (+1) | 1,390 (+10%) | 5mo | $87,500 | $63 | 63 |
| 4516 Louisa Dr | 0.26mi | 3/1.0 (+1) | 1,213 (-4%) | 20mo | $121,506 | $100 | 60 |
| 4514 Metropolitan St | 0.31mi | 3/2.0 (+1) | 1,350 (+7%) | 12mo | $185,000 | $137 | 56 |
| 4951 Feliciana Dr | 0.41mi | 3/1.0 (+1) | 1,118 (-12%) | 4mo | $102,268 | $91 | 53 |
| 4309 Dreux Ave | 0.56mi | 3/2.0 (+1) | 1,348 (+6%) | 7mo | $207,000 | $154 | 48 |
| 5647 Pauline Dr | 0.72mi | 2/1.5 | 1,224 (-3%) | 14mo | $138,000 | $113 | 47 |
| 4978 Kendall Dr | 0.41mi | 3/2.0 (+1) | 1,450 (+14%) | 1mo | $205,000 | $141 | 46 |
| 5108 Feliciana Dr | 0.47mi | 3/1.5 (+1) | 1,147 (-9%) | 13mo | $129,000 | $112 | 44 |
| 5034 Dreux Ave | 0.42mi | 3/2.0 (+1) | 1,408 (+11%) | 20mo | $210,000 | $149 | 36 |
Match score weights: distance 35% · size 25% · config 20% · recency 20%. Top-matched comps best support the ARV.
Projected returns pro-forma
-3.0% appreciation · 0.0% rent growth · sell at horizon
- IRR
- 25.2%
- Equity multiple
- 2.00×
- Total profit
- $23,749
- Equity at exit
- $12,674
- IRR
- 30.9%
- Equity multiple
- 3.38×
- Total profit
- $56,572
- Equity at exit
- $7,349
Cash invested: $23,800 (down + closing). Projections, not guarantees.
Landlord ↔ Tenant lean methodology
- Overall (STATE)
- 90 Strongly Landlord-Friendly
- State Louisiana
- 90 Strongly Landlord-Friendly · R+12
- County
- — inherits STATE
- City
- — inherits STATE
ZIP-level market 70126
- Home prices YoY
- -17.0%
- Rents YoY
- -0.2%
- Active inventory
- 224
- Price-to-rent
- 4.2×
Monthly cashflow live
- Estimated rent
- $1,669 high interval (Pro) →
- Mortgage (P&I)
- −$446
- Tax est. 1.5%
- −$106 /mo · $1,275/yr
- Insurance
- −$35
- Flood insurance flood zone
- −$66 /mo · $798/yr
- HOA
- −$0
- Vacancy / Maint / Mgmt
- −$351
- Net cashflow
- $665
Break-even live
Sensitivity live
| Price | -10% $724 | -5% $694 | +0% $665 | +5% $636 | +10% $606 |
|---|---|---|---|---|---|
| Rent | -10% $533 | -5% $599 | +0% $665 | +5% $731 | +10% $797 |
| Rate | -1.0pp $708 | -0.5pp $687 | base $665 | +0.5pp $643 | +1.0pp $620 |
UW: 25.0% down · 7.5% · 30yr · 1.5% tax · 5.0% vac · 8.0% maint · 8.0% mgmt
Financing live
Cash to close
- Down payment
- $21,250
- Closing costs
- $2,550
- Reserves months
- —
- Total cash needed
- —
Loan-product check · same deal, 3 products live
Conventional
25% down · 7.5% · 30yr
- Down + closing
- —
- Monthly P&I
- —
- Monthly cashflow
- —
- DSCR
- —
- Eligible?
- —
Personal DTI + credit; lowest rate.
DSCR
20% down · 8.5% · 30yr
- Down + closing
- —
- Monthly P&I
- —
- Monthly cashflow
- —
- DSCR
- —
- Eligible?
- —
No personal income docs; deal must DSCR.
Hard money
10% down · 12.0% · 12mo
- Down + closing
- —
- Monthly P&I
- —
- Monthly cashflow
- —
- DSCR
- —
- Eligible?
- —
Short-term bridge; refi at stabilization.
Rent comps 40 comps
| Address | Beds | Baths | Sqft | Rent | $/sqft | DOM | Units | Dist |
|---|---|---|---|---|---|---|---|---|
| 4722 Mithra St New Orleans, LA | 3.0 | 1.5 | 1295 | $1,600 | $1.24 | 24d | 1 | 0.48mi |
| 5401 Montegut Dr New Orleans, LA | 1.0 | 1.0 | 1000 | $1,200 | $1.20 | 16d | 1 | 0.60mi |
| 5550 Press Dr New Orleans, LA | 3.0 | 2.0 | 1640 | $2,000 | $1.22 | 16d | 1 | 0.75mi |
| 4681 Eastern St New Orleans, LA | 2.0 | 1.0 | 1100 | $1,400 | $1.27 | 16d | 1 | 0.76mi |
| 5747 Pauline Dr New Orleans, LA | 3.0 | 1.0 | 1300 | $1,400 | $1.08 | 12d | 1 | 0.81mi |
| 4211 Downman Rd New Orleans, LA | 2.0 | 1.0 | 900 | $1,250 | $1.39 | 24d | 1 | 0.83mi |
| 2844 Hiawatha St New Orleans, LA | 2.0 | 1.0 | 975 | $1,475 | $1.51 | 24d | 1 | 0.85mi |
| 4936 Baccich St New Orleans, LA | 3.0 | 1.0 | 1053 | $1,700 | $1.61 | 24d | 1 | 0.85mi |
| 4767 Lafaye St New Orleans, LA | 3.0 | 2.0 | 1469 | $2,000 | $1.36 | 24d | 1 | 0.87mi |
| 5920 Boeing St New Orleans, LA | 3.0 | 1.5 | 1340 | $1,400 | $1.04 | 24d | 1 | 0.90mi |
| 5925 Pauline Dr New Orleans, LA | 3.0 | 2.0 | 1566 | $2,325 | $1.48 | 16d | 1 | 0.92mi |
| 4441 Cessna Ct New Orleans, LA | 3.0 | 1.5 | 1400 | $1,600 | $1.14 | 24d | 1 | 0.93mi |
| 2754 Jasmine St New Orleans, LA | 3.0 | 1.0 | 1020 | $1,750 | $1.72 | 24d | 1 | 0.93mi |
| 4522 Shalimar Dr New Orleans, LA | 3.0 | 2.0 | 1350 | $1,850 | $1.37 | 24d | 1 | 1.04mi |
| 4527 Shalimar Dr New Orleans, LA | 3.0 | 1.5 | 1174 | $1,550 | $1.32 | 24d | 1 | 1.07mi |
| 5172 Venus St Unit 5172 New Orleans, LA | 3.0 | 2.5 | 1864 | $2,450 | $1.31 | 24d | 1 | 1.11mi |
| 2650 Gladiolus St New Orleans, LA | 2.0 | 1.0 | 900 | $1,600 | $1.78 | 24d | 1 | 1.11mi |
| 4722 Shalimar Dr New Orleans, LA | 3.0 | 2.0 | 1157 | $1,400 | $1.21 | 24d | 1 | 1.11mi |
| 4023 Franklin Ave New Orleans, LA | 3.0 | 2.0 | 1000 | $1,700 | $1.70 | 3d | 1 | 1.13mi |
| 2702 Clover St New Orleans, LA | 2.0 | 2.0 | 880 | $1,300 | $1.48 | 24d | 1 | 1.16mi |
| 5905 Lafaye St New Orleans, LA | 3.0 | 1.0 | 911 | $1,700 | $1.87 | 24d | 1 | 1.17mi |
| 3316 Metropolitan St New Orleans, LA | 3.0 | 2.0 | 1184 | $1,700 | $1.44 | 24d | 1 | 1.19mi |
| 3718 Franklin Ave New Orleans, LA | 2.0 | 1.0 | 1601 | $1,800 | $1.12 | 12d | 1 | 1.25mi |
| 2646 Elder St New Orleans, LA | 3.0 | 3.0 | 1284 | $2,200 | $1.71 | 17d | 1 | 1.31mi |
| 2644 Elder St New Orleans, LA | 3.0 | 3.0 | 1284 | $2,200 | $1.71 | 17d | 1 | 1.31mi |
| 7404 Sussex Pl New Orleans, LA | 2.0 | 1.5 | 1400 | $1,450 | $1.04 | 3d | 1 | 1.33mi |
| 4745 Francis Dr New Orleans, LA | 3.0 | 2.0 | 1311 | $1,550 | $1.18 | 16d | 1 | 1.34mi |
| 2558 Acacia St New Orleans, LA | 2.0 | 1.0 | 900 | $1,500 | $1.67 | 24d | 1 | 1.34mi |
| 4819 21 Francis Dr New Orleans, LA | 3.0 | 1.0 | 1272 | $1,880 | $1.48 | 4d | 1 | 1.36mi |
| 2425 Jonquil St New Orleans, LA | 2.0 | 2.0 | 1038 | $1,500 | $1.45 | 24d | 1 | 1.37mi |
| 6036 Franklin Ave New Orleans, LA | 2.0 | 1.0 | 898 | $1,200 | $1.34 | 17d | 1 | 1.38mi |
| 6226 Lafaye St New Orleans, LA | 2.0 | 2.0 | 1137 | $2,600 | $2.29 | 12d | 1 | 1.38mi |
| 6226 Lafaye St New Orleans, LA | 2.0 | 2.0 | 1137 | $2,600 | $2.29 | 44d | 1 | 1.38mi |
| 2508 Myrtle St New Orleans, LA | 1.0 | 1.0 | 1100 | $1,250 | $1.14 | 24d | 1 | 1.42mi |
| 5704 Count Ln New Orleans, LA | 3.0 | 1.5 | 1572 | $1,700 | $1.08 | 24d | 1 | 1.44mi |
| 2509 Sage St New Orleans, LA | 3.0 | 1.0 | 1250 | $1,650 | $1.32 | 22d | 1 | 1.45mi |
| 7611 Mayfair Pl New Orleans, LA | 2.0 | 1.5 | 1440 | $1,450 | $1.01 | 4d | 1 | 1.46mi |
| 7702 Belcrest Pl New Orleans, LA | 3.0 | 1.5 | 1150 | $1,650 | $1.43 | 24d | 1 | 1.47mi |
| 6530 Peoples Ave New Orleans, LA | 3.0 | 2.0 | 1200 | $1,800 | $1.50 | 24d | 1 | 1.48mi |
| 4616 Marigny St New Orleans, LA | 2.0 | 1.0 | 1020 | $1,750 | $1.72 | 22d | 1 | 1.48mi |
Listing history 6 events
-
2026-04-27status Pending 377-char remark
Show marketing remark (377 chars)
Good Investment in Gentilly Woods! This property provides a great opportunity to add to your rental portfolio or a quick fix and flip with cosmetic updates. The roof was replaced in 2023. Property is priced with repairs in mind. Schedule your showing and submit your offers. Property being sold as-is. Seller to make no repairs. Inspections are for informational purposes only.
-
2026-04-27status Pending
Show marketing remark (377 chars)
Good Investment in Gentilly Woods! This property provides a great opportunity to add to your rental portfolio or a quick fix and flip with cosmetic updates. The roof was replaced in 2023. Property is priced with repairs in mind. Schedule your showing and submit your offers. Property being sold as-is. Seller to make no repairs. Inspections are for informational purposes only.
-
2026-04-15$85,000 Active 377-char remark
Show marketing remark (377 chars)
Good Investment in Gentilly Woods! This property provides a great opportunity to add to your rental portfolio or a quick fix and flip with cosmetic updates. The roof was replaced in 2023. Property is priced with repairs in mind. Schedule your showing and submit your offers. Property being sold as-is. Seller to make no repairs. Inspections are for informational purposes only.
-
2026-04-15$85,000 Active
Show marketing remark (377 chars)
Good Investment in Gentilly Woods! This property provides a great opportunity to add to your rental portfolio or a quick fix and flip with cosmetic updates. The roof was replaced in 2023. Property is priced with repairs in mind. Schedule your showing and submit your offers. Property being sold as-is. Seller to make no repairs. Inspections are for informational purposes only.
-
1994-12-12soldstatus $57,000
-
1983-01-19soldstatus $46,000
ⓘ Source: listings_history table (triggers on properties + properties_extension) + one-shot
backfill from property_details.listing_events for pre-trigger history.
Climate risk First Street
- Flood 8/10 Severe FEMA zone X (shaded) · 60% chance over 30 yrs
- Wildfire 1/10 Low
- Heat 10/10 Extreme 7 d/yr ≥107°F today · 21 d/yr by 30 yrs out
- Wind 10/10 Extreme 99% chance of damaging wind over 30 yrs
- Air quality 3/10 Moderate 3 unhealthy d/yr today · 3 by 30 yrs out
Nearby sold comps map
Loading sold comps map…
Walkable amenities ~0.75 mi
Loading nearby amenities…
Taxation est. · year 1
- Rental income
- $20,032
- − Mortgage interest
- −$4,761
- − Property taxes
- −$1,275
- − Insurance
- −$1,222
- − Repairs & maintenance
- −$1,603
- − Management
- −$1,603
- − Depreciation
- −$2,473
- Taxable income
- $7,095
- Est. tax owed @ 24.0%
- −$1,703
- After-tax cash flow
- $6,276/yr
For passive investors: Depreciation is non-cash, so a rental often shows a tax loss while cash-flowing — sheltering income. Rental losses are passive: they offset passive income freely, and up to $25,000/yr can offset ordinary (W-2) income if you actively participate and your MAGI is under $100k (phasing out to $0 by $150k); unused losses carry forward. On sale, claimed depreciation is recaptured at up to 25%, and gains may owe capital-gains tax (a 1031 exchange can defer both). Figures are a year-1 estimate at your 24.0% rate — not tax advice; consult a CPA.
Schools (NCES district)
- District
- Orleans Parish
- NCES district ID
- 2201170
- Math proficiency
- 11% ▼ -52.00%
- Reading proficiency
- 27% ▼ -46.00%
- Median HH income
- $37,011
- Composite
- 15.78/100
- National rank
- #9271
- State rank
- #69 of 98 in LA
Livability — New Orleans
- Score
- 81/100
- State rank
- #3
- US rank
- #1383
Category grades
Schools grade is shown separately in the Schools card above.
Census & demographics
- Census place
- New Orleans, LA
- County
- Orleans Parish · 338,817 people
- City population
- 338,817
- Metro
- New Orleans-Metairie, LA
- Population (ZIP)
- 27,047
- Household income
- $41,709
- Rent vs Own
- Severe rent burden
- 1767.0
Population outlook (Orleans County) Hauer SSP2
- Today (2025)
- 513,025 people
- By 2030
- 575,781 · +12.2%
- By 2040
- 700,174 · +36.5%
- By 2050
- 826,541 · +61.1%
- By 2075
- 1,123,374 · +119.0%
- By 2100
- 1,355,609 · +164.2%
Race, ethnicity, and origin ACS 2023
- Neighborhood character
- Predominantly Black (85%)
- Race & ethnicity
- Black 85% Hispanic / Latino 6% Two or more races 5% White 5%
- Hispanic origin (detail)
- Common ancestry
- Lithuanian 1% Italian 1%
- Foreign-born
- 4% · Canada, Vietnam
- Languages at home
- 94% English-only · Spanish 5% Other Indo-European 1%
Political lean MEDSL · Orleans
- 2024 margin
- Solid D (+67.0) · D 82.2% · R 15.2% · Other 2.7%
- 2008→2024 swing
- +6.7pp toward D · 2008: 60.3pp · 2024: 67.0pp
- All cycles
- 2024: D+67.0 2020: D+68.2 2016: D+66.2 2012: D+62.5 2008: D+60.3
Not yet ingested
- Civics
- —
Market trends
- HPI YoY
- ▼ -36.35%
- Current HPI
- 177.355
- Rent YoY
- ▼ -0.24%
- Metro
- New Orleans-Metairie, LA
- State GDP YoY
- ▲ 3.29%
- F500 in state
- 10
Industry mix (Fortune 500 HQ in LA)
| Industry | F500 HQs | Revenue |
|---|---|---|
| Telecommunications | 2 | $23B |
|
||
| Utilities | 1 | $12B |
|
||
| Wholesale / Distribution | 1 | $5B |
|
||
| Advertising | 1 | $2B |
|
||
Price history
+84.8% since first listed6 events — show timeline
- 2026-04-27 Pending — AcadianaMLS
- 2026-04-27 Pending — GSREIN
- 2026-04-15 Listed $85,000 GSREIN
- 2026-04-15 Listed $85,000 AcadianaMLS
- 1994-12-12 Sold (Public Records) $57,000 Public Records
- 1983-01-19 Sold (Public Records) $46,000 Public Records
Property tax history
+0.8%/yrLatest (2026): $77 · +0.0% YoY. Source: county tax records.
Cash-flow waterfall
monthlySold comps — $/sqft
last 12 mo · ≤1 miLoading sold comps…