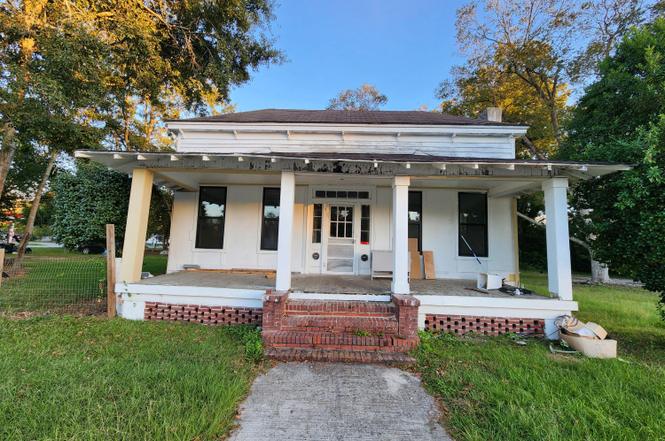
905 Peak St · Holly Hill, SC
Flood risk No data
- FEMA flood zone
- —
- Chance of flooding over 30 yrs
- —
- Est. flood insurance / yr
- —
Fire risk No data
- Est. fire insurance / yr
- —
Heat risk No data
- Hot days now (above threshold)
- —
- Hot days in 30 yrs
- —
Wind risk No data
- Chance of severe wind over 30 yrs
- —
Air-quality risk No data
- Unhealthy air days now
- —
- Unhealthy air days in 30 yrs
- —
Risk factors via First Street. Map © Google.
Why this score? — see what drove the C- grade
The composite is a weighted blend of 9 inputs, each scored 0–100. Each bar is that input's sub-score; the figure is the points it added to the 100-point composite (weight × sub-score).
- Cash flow +15.4/30.0
- Appreciation +7.9/10.0
- ARV discount +7.5/15.0
- Schools +5.0/10.0
- DSCR +4.7/10.0
- 1% rule +4.2/10.0
- Livability +2.9/5.0
- Rent growth +2.5/5.0
- Condition / age +2.5/5.0
$145,000
🖨 Deal sheet (PDF) 📄 Offer letter ✓ Due diligence
Listing remarks
Own a piece of local history! Possibly the oldest home in town, this classic Southern residence features a columned front porch, wide side porch, and timeless siding--now paired with new front siding and commercial-grade windows. Inside: 10′ ceilings, multiple fireplaces, wainscoting, and a kitchen with custom cabinets and island, ready for your appliances. Primary bath updated; a former 3rd bedroom was started as a second bath. Heavy lifting done--commercial-grade rewiring, new subfloors, plumbing updates, conditioned crawl space, newer water heater--with many finishes conveying. Still needed: roof, more windows/siding, complete 2nd bath/3rd BR, drywall/trim. Sold as-is--bring your c
Key facts
- 0.37 acre lot
- Built 1957
- Listed 227 days
Property features AI
Exterior
- Utilities: Public sewer
- Home design: Single-family detached residential property
- Exterior features: No additional structures; No subdivision
Interior
- Bedrooms: 3 bedrooms
- Bathrooms: 1 bathroom
- Interior features: Family room; Entrance foyer; Living/dining combo; Pantry; Other
Neighborhood map
What this means for you Summary
Snapshot
- This is a 3-bed/1.0-bath single-family listed at $145k.
Deal economics
- At list price, monthly cash flow is $55 ($657/yr) — positive.
- The deal already cash-flows at list — no discount required.
- To meet the 1% rule (rent ≥ 1% of price), the offer needs to be $134k (7.7% below list).
- Recommended offer: $128k (12.0% below list) — sets the bar for market timing.
- Cap rate 6.7% vs local median 2.0% in Holly Hill — top-decile yield for the area; either an underpriced asset or a hidden risk that comps aren't pricing in. Stress-test before assuming the spread holds.
Location & tenants
- Location reads 57/100 on livability (#282 in SC) — a working-class tenant base; expect higher turnover. Strengths: cost of living A+, health & safety A+, housing B; Watch: crime F, amenities F, commute F.
- Zoned schools: Holly Hill Elementary (math 30%, 326 students, 100% FRL); Holly Hill-Roberts Middle (math 15%, 418 students, 100% FRL).
- Market conditions: 92 active listings in the ZIP; 87 units permitted in Orangeburg County in 2024 (0 in 5+ unit buildings).
Forward outlook
- In year one you build about $9k of equity ($1k loan paydown + $8k appreciation (5.8% local appreciation)).
- Orangeburg County population projected at -27% by 2050 — secular population decline; favor cash flow + early exit over multi-decade hold.
- At projected returns (5.8% appreciation + 3.0% rent growth), your $41k cash investment doubles in ~4 years — after that, you're playing with house money.
- By year 4, paydown + projected appreciation supports a ~$32k cash-out refi (75% LTV) — recoverable capital for the next deal without selling this one.
Negotiation context
- It's been on market 228 days — a 12% lower offer ($128k) is reasonable based on typical stale-listing flexibility.
Risks & watch-outs
- Watch-outs: built in 1957 — expect roof / HVAC / electrical / plumbing capex.
Questions for the listing agent
- It's been on market 228 days. Have you received any prior offers? Is the seller open to a 12% concession, seller financing, or rate buy-down credit?
- Built in 1957 — when were the roof, HVAC, electrical panel, plumbing, and water heater last replaced?
- Why hasn't it sold? Are there any deal-killer items the seller is aware of (foundation, flood, title, zoning, code violations)?
- Is there a deadline driving the sale (1031 exchange, divorce, estate, relocation)? That informs how much negotiation room exists.
- Schools are F-rated, which usually means shorter tenancies and higher turnover. Who's the typical renter profile here, and what's been the actual vacancy rate?
- Crime grade is F in this area — have there been break-ins, vandalism, or insurance claims at this property in the last 3 years? What carrier currently insures it and at what premium?
- What's the average days-on-market for RENTAL listings here right now (not sales)? A rising rental-DOM trend means longer vacancies and softer asking-rent achievability than the comps imply.
- What's the recent tenant-quality profile in this submarket — average credit score on applications, eviction rate, late-payment / NSF rate, and stable-employment percentage? A property-management company in the area should have these aggregated.
- How much new for-sale + rental construction is in the pipeline within 1–3 miles? Heavy new supply typically softens prices + rents 12–24 months out; constrained supply supports both.
Investment metrics
- 1% rule
- 0.92% ✗
- Cap rate
- 6.75%
- Cash-on-cash
- 1.62%
- DSCR
- 1.07
- GRM
- 9.0
CMA / ARV
- ARV (on-the-fly)
- $309,240
- Comps found
- 9
Show comp detail 9 sales within ~0.75 mi
| Address | Dist | Beds/Ba | Sqft | Sold | Price | $/sf | Match |
|---|---|---|---|---|---|---|---|
| 2719 Eutaw Rd | 0.14mi | 3/1.0 | 1,880 (+9%) | 19mo | $252,000 | $134 | 62 |
| 8109 Old State Rd | 0.70mi | 3/2.0 | 1,847 (+8%) | 1mo | $130,000 | $70 | 50 |
| 2512 Eutaw Rd | 0.46mi | 3/2.0 | 1,533 (-11%) | 12mo | $299,000 | $195 | 46 |
| 724 Peake St | 0.22mi | 4/2.0 (+1) | 1,926 (+12%) | 20mo | $240,000 | $125 | 44 |
| 1287 Carolina Ave | 0.46mi | 3/2.0 | 1,500 (-13%) | 13mo | $270,000 | $180 | 42 |
| 367 Walters Rd | 0.69mi | 4/2.0 (+1) | 1,774 (+3%) | 20mo | $329,999 | $186 | 37 |
| 1301 Bennett Cir | 0.66mi | 3/2.0 | 1,969 (+15%) | 6mo | $365,000 | $185 | 36 |
| 362 Walters Rd | 0.71mi | 4/2.0 (+1) | 1,774 (+3%) | 23mo | $332,910 | $188 | 33 |
| 359 Walters Rd | 0.73mi | 4/2.0 (+1) | 1,774 (+3%) | 23mo | $311,035 | $175 | 32 |
Match score weights: distance 35% · size 25% · config 20% · recency 20%. Top-matched comps best support the ARV.
Projected returns pro-forma
5.85% appreciation · 3.0% rent growth · sell at horizon
- IRR
- 16.3%
- Equity multiple
- 2.09×
- Total profit
- $44,083
- Equity at exit
- $89,783
- IRR
- 16.3%
- Equity multiple
- 4.14×
- Total profit
- $127,327
- Equity at exit
- $161,647
Cash invested: $40,600 (down + closing). Projections, not guarantees.
Landlord ↔ Tenant lean methodology
- Overall (STATE)
- 90 Strongly Landlord-Friendly
- State South Carolina
- 90 Strongly Landlord-Friendly · R+6
- County
- — inherits STATE
- City
- — inherits STATE
ZIP-level market 29059
- Home prices YoY
- 2.5%
- Active inventory
- 92
- Price-to-rent
- 9.0×
Monthly cashflow live
- Estimated rent
- $1,338 medium interval (Pro) →
- Mortgage (P&I)
- −$760
- Tax est. 1.5%
- −$181 /mo · $2,175/yr
- Insurance
- −$60
- HOA
- −$0
- Vacancy / Maint / Mgmt
- −$281
- Net cashflow
- $55
Break-even live
Sensitivity live
| Price | -10% $155 | -5% $105 | +0% $55 | +5% $5 | +10% $-45 |
|---|---|---|---|---|---|
| Rent | -10% $-51 | -5% $2 | +0% $55 | +5% $108 | +10% $160 |
| Rate | -1.0pp $128 | -0.5pp $92 | base $55 | +0.5pp $17 | +1.0pp $-21 |
UW: 25.0% down · 7.5% · 30yr · 1.5% tax · 5.0% vac · 8.0% maint · 8.0% mgmt
Financing live
Cash to close
- Down payment
- $36,250
- Closing costs
- $4,350
- Reserves months
- —
- Total cash needed
- —
Loan-product check · same deal, 3 products live
Conventional
25% down · 7.5% · 30yr
- Down + closing
- —
- Monthly P&I
- —
- Monthly cashflow
- —
- DSCR
- —
- Eligible?
- —
Personal DTI + credit; lowest rate.
DSCR
20% down · 8.5% · 30yr
- Down + closing
- —
- Monthly P&I
- —
- Monthly cashflow
- —
- DSCR
- —
- Eligible?
- —
No personal income docs; deal must DSCR.
Hard money
10% down · 12.0% · 12mo
- Down + closing
- —
- Monthly P&I
- —
- Monthly cashflow
- —
- DSCR
- —
- Eligible?
- —
Short-term bridge; refi at stabilization.
Listing history 22 events
-
2026-06-19days on market $145,000 Active 228 DOM
-
2026-06-18days on market $145,000 Active 227 DOM
-
2026-06-17days on market $145,000 Active 226 DOM
-
2026-06-16days on market $145,000 Active 225 DOM
-
2026-06-15days on market $145,000 Active 224 DOM
-
2026-06-14days on market $145,000 Active 222 DOM
-
2026-06-12days on market $145,000 Active 221 DOM
-
2026-06-09days on market $145,000 Active 218 DOM
-
2026-06-08days on market $145,000 Active 217 DOM
-
2026-06-07days on market $145,000 Active 216 DOM
-
2026-06-07days on market $145,000 Active 215 DOM
-
2026-06-04days on market $145,000 Active 212 DOM
-
2026-06-02days on market $145,000 Active 211 DOM
-
2026-06-01days on market $145,000 Active 210 DOM
-
2026-05-31days on market $145,000 Active 209 DOM
-
2026-05-31days on market $145,000 Active 208 DOM
-
2026-02-13price $145,000
-
2026-01-23price $149,000
-
2026-01-06price $155,000
-
2025-12-11price $159,000
-
2025-11-17price $169,000
-
2025-11-03$180,000 Active
ⓘ Source: listings_history table (triggers on properties + properties_extension) + one-shot
backfill from property_details.listing_events for pre-trigger history.
Nearby sold comps map
Loading sold comps map…
Walkable amenities ~0.75 mi
Loading nearby amenities…
Taxation est. · year 1
- Rental income
- $16,053
- − Mortgage interest
- −$8,122
- − Property taxes
- −$2,175
- − Insurance
- −$725
- − Repairs & maintenance
- −$1,284
- − Management
- −$1,284
- − Depreciation
- −$4,218
- Taxable loss
- −$1,756
- Est. tax savings @ 24.0%
- +$421
- After-tax cash flow
- $1,078/yr
For passive investors: Depreciation is non-cash, so a rental often shows a tax loss while cash-flowing — sheltering income. Rental losses are passive: they offset passive income freely, and up to $25,000/yr can offset ordinary (W-2) income if you actively participate and your MAGI is under $100k (phasing out to $0 by $150k); unused losses carry forward. On sale, claimed depreciation is recaptured at up to 25%, and gains may owe capital-gains tax (a 1031 exchange can defer both). Figures are a year-1 estimate at your 24.0% rate — not tax advice; consult a CPA.
Schools (NCES district)
No district data.
Livability — Holly Hill
- Score
- 57/100
- State rank
- #282
- US rank
- #22105
Category grades
Schools grade is shown separately in the Schools card above.
Census & demographics
- Census place
- Holly Hill, SC
- City population
- 5,234
- Population (ZIP)
- 5,234
Population outlook (Orangeburg County) Hauer SSP2
- Today (2025)
- 82,698 people
- By 2030
- 78,615 · -4.9%
- By 2040
- 69,308 · -16.2%
- By 2050
- 60,629 · -26.7%
- By 2075
- 42,678 · -48.4%
- By 2100
- 28,136 · -66.0%
Race, ethnicity, and origin ACS 2023
- Neighborhood character
- Majority Black (57%)
- Race & ethnicity
- Black 57% White 39% Native American 2% Two or more races 1%
- Common ancestry
- Lithuanian 0%
- Foreign-born
- 1% · Canada
- Languages at home
- 99% English-only · Arabic 1%
Political lean MEDSL · Orangeburg
- 2024 margin
- Strong D (+24.6) · D 61.8% · R 37.2% · Other 1.1%
- 2008→2024 swing
- -13.5pp toward R · 2008: 38.1pp · 2024: 24.6pp
- All cycles
- 2024: D+24.6 2020: D+33.2 2016: D+37.0 2012: D+43.5 2008: D+38.1
Not yet ingested
- Civics
- —
Market trends
- HPI YoY
- ▲ 5.85%
- Current HPI
- 237.6204
- Rent YoY
- —
- Metro
- —
- State GDP YoY
- ▲ 4.51%
- F500 in state
- 2
Industry mix (Fortune 500 HQ in SC)
| Industry | F500 HQs | Revenue |
|---|---|---|
| Packaging | 1 | $7B |
|
||
Price history
-19.4% since first listed6 events — show timeline
- 2026-02-13 Price Changed $145,000 Charleston Trident MLS
- 2026-01-23 Price Changed $149,000 Charleston Trident MLS
- 2026-01-06 Price Changed $155,000 Charleston Trident MLS
- 2025-12-11 Price Changed $159,000 Charleston Trident MLS
- 2025-11-17 Price Changed $169,000 Charleston Trident MLS
- 2025-11-03 Listed $180,000 Charleston Trident MLS
Cash-flow waterfall
monthlySold comps — $/sqft
last 12 mo · ≤1 miLoading sold comps…