 Multi-family
19500 Arnold · California City, CA
Flood risk 1/10 · Minimal
- FEMA flood zone
- X (unshaded)
- Chance of flooding over 30 yrs
- 0.0%
- Est. flood insurance / yr
- $507 – $1,088
Fire risk 1/10 · Minimal
- Est. fire insurance / yr
- $659 – $1,223
Heat risk 8/10 · Major
- Hot days now (above 101°F)
- 7 days/yr
- Hot days in 30 yrs
- 19 days/yr
Wind risk 1/10 · Minimal
- Chance of severe wind over 30 yrs
- —
Air-quality risk 7/10 · Major
- Unhealthy air days now
- 13 days/yr
- Unhealthy air days in 30 yrs
- 15 days/yr
Risk factors via First Street. Map © Google.
Why this score? — see what drove the C grade
The composite is a weighted blend of 9 inputs, each scored 0–100. Each bar is that input's sub-score; the figure is the points it added to the 100-point composite (weight × sub-score).
- Cash flow +17.6/30.0
- Appreciation +10.0/10.0
- ARV discount +7.5/15.0
- DSCR +5.5/10.0
- 1% rule +3.9/10.0
- Rent growth +3.9/5.0
- Condition / age +2.5/5.0
- Livability +2.2/5.0
- Schools +2.1/10.0
$268,400
🖨 Deal sheet 📄 Offer letter ✓ Due diligence
Multi-family units
County records classify this as Multi-Family (2-4 Unit). Listing-text estimate: 1 unit. estimate disagrees with records
Listing remarks MLS
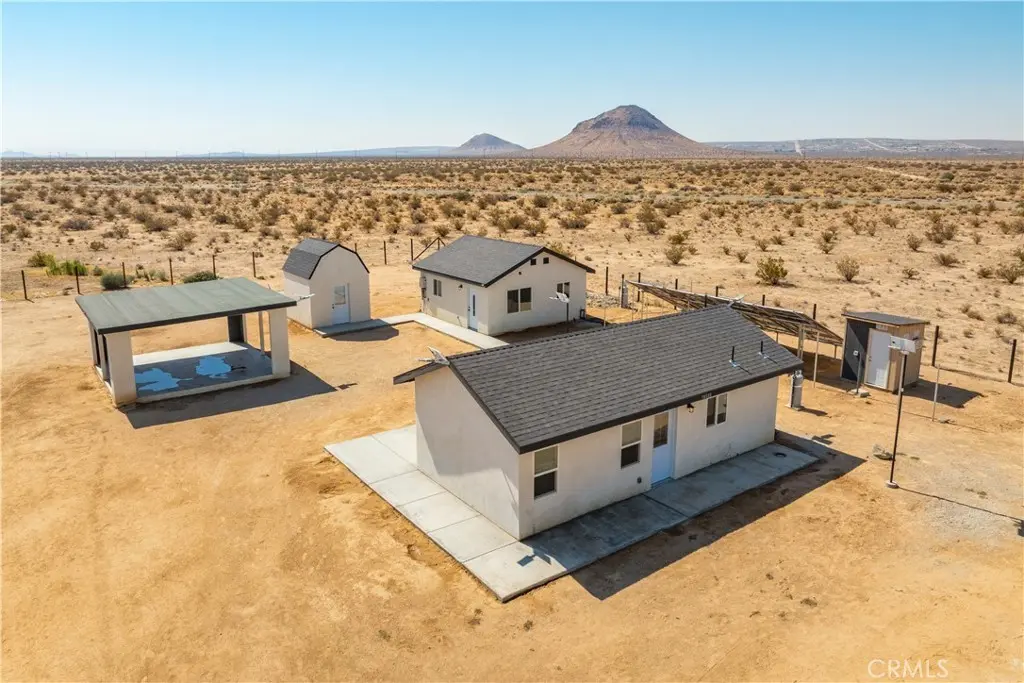
Investor opportunity in California City with multi-unit income potential. Situated on a spacious 0.53-acre lot, this property features two detached newer construction mini homes (built in 2024), each offering 1 bedroom and 1 bathroom ( one is 465 sq ft and the other is 400 sq ft). Ideal for investors or owner-live in one and rent the other, or maximize as a dual-income property. Fully off-grid with 100% paid solar (16 panels, 540W each) and battery backup, offering significant cost savings with no electric bill. Property is connected to public water (Cal City Water), septic, and propane, and includes 220V power, mini-split AC/heat in both units, and washer/dryer hookups (in one unit). The fully fenced lot also features an oversized finished shed with loft and electricity plus a gazebo/outdoor space, adding usability and appeal for tenants or extended living. Located near Edwards Air Force Base, this property is well-positioned for strong rental demand, making it ideal for long-term, mid-term, or potential short-term rental use (buyer to verify). One unit has previously rented for $850/month (short-term), with additional income potential. Conveniently located near Central Park, Tierra Del Sol Golf Course, shopping, and dining. A versatile property with strong cash flow potential and long-term upside.
Key facts
- Paid solar
- Fully off-grid
- Spacious lot
Tags
Property features AI
Finance
- Other: Lot features: 0-1 unit per acre; Road surface is unpaved
- HOA & community: Rural community
Exterior
- Utilities: Water connected; District/public water source; Propane available; Electricity not available; Sewer not available / septic type unknown; Utilities: see remarks
- Home design: Single-story property; No common walls (standalone units); No accessory dwelling unit
- Construction: Total building area 865; Two buildings; Year built source: other
- Exterior features: No pool
Interior
- Bedrooms: Each unit has 2 bedrooms (2 units total)
- Heating & cooling: Ductless heating; Ductless cooling
- Interior features: Entry level is 1
- Laundry & utility: Laundry on-site with gas and electric dryer hookups; Laundry details: see remarks
Neighborhood map
What this means for you Summary
Snapshot
- This is a 4-bed/?-bath multifamily listed at $268k.
Deal economics
- At list price, monthly cash flow is $211 ($3k/yr) — positive.
- The deal already cash-flows at list — no discount required.
- To meet the 1% rule (rent ≥ 1% of price), the offer needs to be $238k (11.5% below list).
- Recommended offer: $238k (11.5% below list) — sets the bar for 1% rule.
- Cap rate 7.2% vs local median 5.2% in California City — top-decile yield for the area; either an underpriced asset or a hidden risk that comps aren't pricing in. Stress-test before assuming the spread holds.
Location & tenants
- Location reads 44/100 on livability (#1,329 in CA) — a working-class tenant base; expect higher turnover. Strengths: housing A+; Watch: schools F, crime F, amenities F.
- Mojave Unified (town): math 25% / reading 25% proficiency, ranked #411 of 517 in CA (top 80%) — low school quality limits family demand, transient renter base, plan for 1-2y turnover; 76% free/reduced lunch — lower-income household profile, screen leases tightly.
- Market conditions: Rents rising fast (+5.5%/yr); 703 active listings in the ZIP; 3,244 units permitted in Kern County in 2024 (73 in 5+ unit buildings).
- At $2,376/mo this rent would consume 48% of the median local household income ($60k/yr) (locally 883% of renters already pay >50% of income on rent) — very limited rent-growth headroom before tenants either downsize or default.
Forward outlook
- In year one you build about $29k of equity ($2k loan paydown + $27k appreciation (10.0% local appreciation)).
- Kern County population projected at +17% by 2050 — long-run rental-demand tailwind backs the buy-and-hold thesis.
- At projected returns (10.0% appreciation + 5.5% rent growth), your $75k cash investment doubles in ~3 years — after that, you're playing with house money.
- By year 2, paydown + projected appreciation supports a ~$46k cash-out refi (75% LTV) — recoverable capital for the next deal without selling this one.
Negotiation context
- It's been on market 45 days — a 3% lower offer ($260k) is reasonable based on typical stale-listing flexibility.
- 3 sale attempts since 2y ago with the ask held roughly flat each time — persistent listings suggest the price (not the market) is what's stuck; bring a comps-based counter.
Risks & watch-outs
- Climate carrying-cost: extreme-heat days projected 7→19/yr by 2055 (HVAC capex compounding) — expect insurance premiums to compound above CPI over the hold.
Questions for the listing agent
- It's been on market 45 days. Have you received any prior offers? Is the seller open to a 11% concession, seller financing, or rate buy-down credit?
- Is there a deadline driving the sale (1031 exchange, divorce, estate, relocation)? That informs how much negotiation room exists.
- Schools are F-rated, which usually means shorter tenancies and higher turnover. Who's the typical renter profile here, and what's been the actual vacancy rate?
- Crime grade is F in this area — have there been break-ins, vandalism, or insurance claims at this property in the last 3 years? What carrier currently insures it and at what premium?
- What's the average days-on-market for RENTAL listings here right now (not sales)? A rising rental-DOM trend means longer vacancies and softer asking-rent achievability than the comps imply.
- What's the recent tenant-quality profile in this submarket — average credit score on applications, eviction rate, late-payment / NSF rate, and stable-employment percentage? A property-management company in the area should have these aggregated.
- How much new apartment / multifamily construction is in the pipeline within 1–3 miles? Heavy new supply (>2% of stock underway) typically softens rents 12–24 months out; light construction supports rent growth.
Investment metrics
- 1% rule
- 0.89% ✗
- Cap rate
- 7.24%
- Cash-on-cash
- 3.38%
- DSCR
- 1.15
- GRM
- 9.4
CMA / ARV
No comps found within radius.
Projected returns pro-forma
10.0% appreciation · 5.45% rent growth · sell at horizon
- IRR
- 27.5%
- Equity multiple
- 3.20×
- Total profit
- $165,567
- Equity at exit
- $241,796
- IRR
- 24.7%
- Equity multiple
- 7.52×
- Total profit
- $490,260
- Equity at exit
- $521,442
Cash invested: $75,152 (down + closing). Projections, not guarantees.
Landlord ↔ Tenant lean methodology
- Overall (STATE)
- 18 Strongly Tenant-Friendly
- State California
- 18 Strongly Tenant-Friendly · D+13
- County
- — inherits STATE
- City
- — inherits STATE
ZIP-level market 93505
- Home prices YoY
- 13.0%
- Rents YoY
- 5.5%
- Active inventory
- 703
- Price-to-rent
- 18.8×
Monthly cashflow live
- Estimated rent
- $2,376 medium interval (Pro) →
- Mortgage (P&I)
- −$1,408
- Tax from tax record
- −$146 /mo · $1,754/yr
- Insurance
- −$112
- HOA
- −$0
- Vacancy / Maint / Mgmt
- −$499
- Net cashflow
- $211
Break-even live
2-unit breakdown (identical units grouped — click to expand)
| Units | Beds | Baths | Est. rent |
|---|---|---|---|
| 2× units | 1 | 1 | $2,376 |
| #1 | 1 | 1 | $1,188 |
| #2 | 1 | 1 | $1,188 |
| Total (2 units) | $2,376 | ||
UW: 25.0% down · 7.5% · 30yr · 1.5% tax · 5.0% vac · 8.0% maint · 8.0% mgmt
Financing live
Cash to close
- Down payment
- $67,100
- Closing costs
- $8,052
- Reserves months
- —
- Total cash needed
- —
Loan-product check · same deal, 3 products live
Conventional
25% down · 7.5% · 30yr
- Down + closing
- —
- Monthly P&I
- —
- Monthly cashflow
- —
- DSCR
- —
- Eligible?
- —
Personal DTI + credit; lowest rate.
DSCR
20% down · 8.5% · 30yr
- Down + closing
- —
- Monthly P&I
- —
- Monthly cashflow
- —
- DSCR
- —
- Eligible?
- —
No personal income docs; deal must DSCR.
Hard money
10% down · 12.0% · 12mo
- Down + closing
- —
- Monthly P&I
- —
- Monthly cashflow
- —
- DSCR
- —
- Eligible?
- —
Short-term bridge; refi at stabilization.
Listing history 19 events
-
2026-06-18days on market $268,400 Active 45 DOM
-
2026-06-17days on market $268,400 Active 44 DOM
-
2026-06-16days on market $268,400 Active 43 DOM
-
2026-06-15days on market $268,400 Active 42 DOM
-
2026-06-14days on market $268,400 Active 40 DOM
-
2026-06-13days on market $268,400 Active 39 DOM
-
2026-06-10days on market $268,400 Active 37 DOM
-
2026-06-09days on market $268,400 Active 36 DOM
-
2026-06-08days on market $268,400 Active 35 DOM
-
2026-06-07days on market $268,400 Active 34 DOM
-
2026-06-05days on market $268,400 Active 31 DOM
-
2026-06-03days on market $268,400 Active 30 DOM
-
2026-06-03days on market $268,400 Active 29 DOM
-
2026-06-01days on market $268,400 Active 28 DOM
-
2026-05-31days on market $268,400 Active 27 DOM
-
2026-05-04$268,400 Active 1320-char remark
-
2026-05-01$268,400 Active 1322-char remark
Show marketing remark (1322 chars)
Investor opportunity in California City with multi-unit income potential. Situated on a spacious 0.53-acre lot, this property features two detached newer construction mini homes (built in 2024), each offering 1 bedroom and 1 bathroom ( one is 465 sq ft and the other is 400 sq ft). Ideal for investors or owner-live in one and rent the other, or maximize as a dual-income property. Fully off-grid with 100% paid solar (16 panels, 540W each) and battery backup, offering significant cost savings with no electric bill. Property is connected to public water (Cal City Water), septic, and propane, and includes 220V power, mini-split AC/heat in both units, and washer/dryer hookups (in one unit). The fully fenced lot also features an oversized finished shed with loft and electricity plus a gazebo/outdoor space, adding usability and appeal for tenants or extended living. Located near Edwards Air Force Base, this property is well-positioned for strong rental demand, making it ideal for long-term, mid-term, or potential short-term rental use (buyer to verify). One unit has previously rented for $850/month (short-term), with additional income potential. Conveniently located near Central Park, Tierra Del Sol Golf Course, shopping, and dining. A versatile property with strong cash flow potential and long-term upside.
-
2024-08-16historical
-
2024-07-10$299,000 Active
ⓘ Source: listings_history table (triggers on properties + properties_extension) + one-shot
backfill from property_details.listing_events for pre-trigger history.
Tax reassessment forecast CA · Resets to sale price
- Current annual tax
- $1,754 · $146/mo
- Projected year-2 tax
- $2,040 · $170/mo
- Expected delta
- +$285/yr (+$24/mo · 16.3%)
ⓘ Screening estimate from a state-policy table — verify with the county assessor before closing.
Climate risk First Street
- Flood 1/10 Low FEMA zone X (unshaded) · 0% chance over 30 yrs
- Wildfire 1/10 Low
- Heat 8/10 Severe 7 d/yr ≥101°F today · 19 d/yr by 30 yrs out
- Wind 1/10 Low
- Air quality 7/10 Severe 13 unhealthy d/yr today · 15 by 30 yrs out
Nearby sold comps map
Loading sold comps map…
Walkable amenities ~0.75 mi
Loading nearby amenities…
Taxation est. · year 1
- Rental income
- $28,512
- − Mortgage interest
- −$15,035
- − Property taxes
- −$1,754
- − Insurance
- −$1,342
- − Repairs & maintenance
- −$2,281
- − Management
- −$2,281
- − Depreciation
- −$7,808
- Taxable loss
- −$1,989
- Est. tax savings @ 24.0%
- +$477
- After-tax cash flow
- $3,015/yr
For passive investors: Depreciation is non-cash, so a rental often shows a tax loss while cash-flowing — sheltering income. Rental losses are passive: they offset passive income freely, and up to $25,000/yr can offset ordinary (W-2) income if you actively participate and your MAGI is under $100k (phasing out to $0 by $150k); unused losses carry forward. On sale, claimed depreciation is recaptured at up to 25%, and gains may owe capital-gains tax (a 1031 exchange can defer both). Figures are a year-1 estimate at your 24.0% rate — not tax advice; consult a CPA.
Schools (NCES district)
- District
- Mojave Unified
- NCES district ID
- 0625230
- Math proficiency
- 25% ▲ 11.00%
- Reading proficiency
- 25% ▼ -1.00%
- Median HH income
- $43,017
- Composite
- 21.4/100
- National rank
- #8350
- State rank
- #411 of 517 in CA
Livability — California City
- Score
- 44/100
- State rank
- #1329
- US rank
- #26753
Category grades
Schools grade is shown separately in the Schools card above.
Census & demographics
- Census place
- California City, CA
- County
- Kern County · 710,371 people
- City population
- 14,353
- Metro
- Bakersfield, CA
- Population (ZIP)
- 14,353
- Household income
- $59,827
- Rent vs Own
- Severe rent burden
- 883.0
Population outlook (Kern County) Hauer SSP2
- Today (2025)
- 947,286 people
- By 2030
- 978,984 · +3.3%
- By 2040
- 1,045,018 · +10.3%
- By 2050
- 1,105,232 · +16.7%
- By 2075
- 1,229,538 · +29.8%
- By 2100
- 1,238,059 · +30.7%
Race, ethnicity, and origin ACS 2023
- Neighborhood character
- Highly diverse neighborhood (Simpson 0.70)
- Race & ethnicity
- Hispanic / Latino 40% White 30% Black 22% Two or more races 16% Native American 3% Asian 1%
- Hispanic origin (detail)
- Mexican 29%
- Common ancestry
- Italian 3% Lithuanian 1% Romanian 1%
- Foreign-born
- 13% · Canada, Dominican Republic
- Languages at home
- 68% English-only · Spanish 29%
Political lean MEDSL · Kern
- 2024 margin
- Strong R (+21.1) · D 38.2% · R 59.3% · Other 2.5%
- 2008→2024 swing
- -3.3pp toward R · 2008: -17.8pp · 2024: -21.1pp
- All cycles
- 2024: R+21.1 2020: R+10.2 2016: R+15.0 2012: R+20.9 2008: R+17.8
Not yet ingested
- Civics
- —
Market trends
- HPI YoY
- ▲ 46.32%
- Current HPI
- 402.4192
- Rent YoY
- ▲ 5.45%
- Metro
- Bakersfield, CA
- State GDP YoY
- ▲ 3.21%
- F500 in state
- 116
Industry mix (Fortune 500 HQ in CA)
| Industry | F500 HQs | Revenue |
|---|---|---|
| Technology | 27 | $1,492B |
|
||
| Financial Services | 3 | $174B |
|
||
| Retail | 3 | $44B |
|
||
| Insurance | 3 | $26B |
|
||
| Media / Entertainment | 2 | $115B |
|
||
| Pharmaceuticals / Biotech | 2 | $62B |
|
||
Price history
-10.2% since first listed4 events — show timeline
- 2026-05-04 Listed $268,400 CRMLS
- 2026-05-01 Listed $268,400 AVMLS
- 2024-08-16 Listing Removed — CRMLS
- 2024-07-10 Listed $299,000 CRMLS
Property tax history
+21.8%/yrLatest (2025): $1,754 · +1.2% YoY. Source: county tax records.
Cash-flow waterfall
monthlySold comps — $/sqft
last 12 mo · ≤1 miLoading sold comps…