1137 14th Ave · Augusta-Richmond County consolidated government (balance), GA
Flood risk 6/10 · Moderate
- FEMA flood zone
- AE
- Chance of flooding over 30 yrs
- 0.75%
- Est. flood insurance / yr
- $1,737 – $8,500
Fire risk 1/10 · Minimal
- Est. fire insurance / yr
- $963 – $1,789
Heat risk 8/10 · Major
- Hot days now (above 108°F)
- 7 days/yr
- Hot days in 30 yrs
- 17 days/yr
Wind risk 6/10 · Moderate
- Chance of severe wind over 30 yrs
- 67.0%
Air-quality risk 3/10 · Minor
- Unhealthy air days now
- 3 days/yr
- Unhealthy air days in 30 yrs
- 3 days/yr
Risk factors via First Street. Map © Google.
Why this score? — see what drove the B+ grade
The composite is a weighted blend of 9 inputs, each scored 0–100. Each bar is that input's sub-score; the figure is the points it added to the 100-point composite (weight × sub-score).
- Cash flow +30.0/30.0
- 1% rule +10.0/10.0
- DSCR +10.0/10.0
- Appreciation +9.1/10.0
- ARV discount +7.5/15.0
- Livability +2.5/5.0
- Condition / age +2.5/5.0
- Rent growth +2.2/5.0
- Schools +1.3/10.0
$30,000
🖨 Deal sheet 📄 Offer letter ✓ Due diligence
Listing remarks MLS
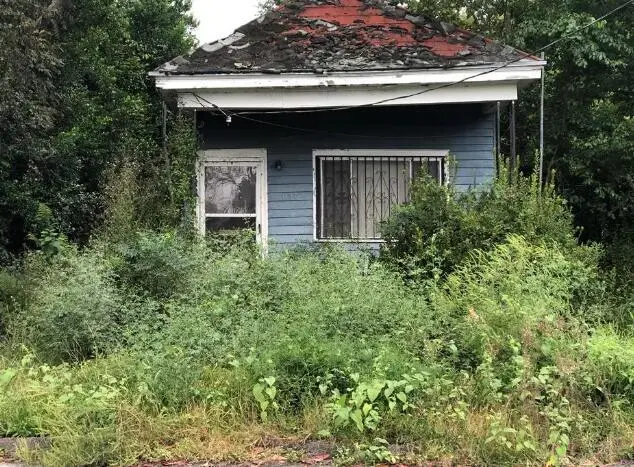
Investor Alert! Prime opportunity at 1137 11th Ave. Property is being sold strictly AS-IS with no seller disclosures. Home may be torn down, allowing for new construction and full utilization of the lot. Perfect for investors, builders, or developers looking to create a modern home or multi-unit project (verify local zoning and permits). Bring your plans and vision. This is a rare chance to capitalize on land value and redevelopment potential! Buyer to verify all information, including lot size, zoning, utilities, and permitting.
Key facts
- New construction
- Land value
- 7,405 sq ft lot
Tags
Neighborhood map
What this means for you Summary
Snapshot
- This is a 2-bed/1.0-bath single-family listed at $30k.
Deal economics
- At list price, monthly cash flow is $274 ($3k/yr) — positive.
- The deal already cash-flows at list — no discount required.
- Meets the 1% rule at list price ($1k rent vs $30k).
- Recommended offer: $29k (3.0% below list) — sets the bar for market timing.
- Cap rate 34.3% vs local median 5.3% in Augusta-Richmond County consolidated government (balance) — top-decile yield for the area; either an underpriced asset or a hidden risk that comps aren't pricing in. Stress-test before assuming the spread holds.
Location & tenants
- Location reads: area grade B — affects rentability + tenant quality, not the cash-flow math above.
- Richmond County (urban): math 12% / reading 20% proficiency, ranked #154 of 174 in GA (top 88%) — low school quality limits family demand, transient renter base, plan for 1-2y turnover; 72% free/reduced lunch — lower-income household profile, screen leases tightly.
- Market conditions: Rents soft (-1.3%/yr); 129 active listings in the ZIP; 36 comparable units currently listed for rent nearby; rentals at typical pace (median 24d on market — plan ~3-4 weeks tenant-placement turnaround); 47% of comp listings sitting > 30 days — soft ceiling on asking rent; lower-income renter base — watch delinquency; 561 units permitted in Richmond County in 2024 (0 in 5+ unit buildings).
- At $1,163/mo this rent would consume 55% of the median local household income ($25k/yr) (locally 2063% of renters already pay >50% of income on rent) — very limited rent-growth headroom before tenants either downsize or default.
Forward outlook
- In year one you build about $3k of equity ($207 loan paydown + $2k appreciation (8.2% local appreciation)).
- Richmond County population projected to shrink 5% by 2050 — rents likely to lag national; underwrite the cash flow, not the appreciation.
- At projected returns (8.2% appreciation + 0.0% rent growth), your $8k cash investment doubles in ~2 years — after that, you're playing with house money.
Negotiation context
- It's been on market 38 days — a 3% lower offer ($29k) is reasonable based on typical stale-listing flexibility.
- 4 sale attempts since 6y ago with the ask held roughly flat each time — persistent listings suggest the price (not the market) is what's stuck; bring a comps-based counter.
- Current owner paid $6k; list at $30k implies a 400% gain — meaningful room to come down on a strong offer.
Risks & watch-outs
- Watch-outs: flood insurance adds $427/mo; built in 1916 — expect roof / HVAC / electrical / plumbing capex.
- Climate carrying-cost: in FEMA flood zone AE (mandatory federal flood insurance); major wind risk, 67% chance of damaging wind over 30y; extreme-heat days projected 7→17/yr by 2055 (HVAC capex compounding) — expect insurance premiums to compound above CPI over the hold.
Questions for the listing agent
- It's been on market 38 days. Have you received any prior offers? Is the seller open to a 3% concession, seller financing, or rate buy-down credit?
- Built in 1916 — when were the roof, HVAC, electrical panel, plumbing, and water heater last replaced?
- What's the actual annual flood-insurance premium (NFIP or private), and is the property in a SFHA with mandatory coverage?
- Is there a deadline driving the sale (1031 exchange, divorce, estate, relocation)? That informs how much negotiation room exists.
- What's the average days-on-market for RENTAL listings here right now (not sales)? A rising rental-DOM trend means longer vacancies and softer asking-rent achievability than the comps imply.
- What's the recent tenant-quality profile in this submarket — average credit score on applications, eviction rate, late-payment / NSF rate, and stable-employment percentage? A property-management company in the area should have these aggregated.
- How much new for-sale + rental construction is in the pipeline within 1–3 miles? Heavy new supply typically softens prices + rents 12–24 months out; constrained supply supports both.
Investment metrics
- 1% rule
- 3.88% ✓
- Cap rate
- 34.31%
- Cash-on-cash
- 100.05%
- DSCR
- 5.45
- GRM
- 2.1
CMA / ARV
- ARV (median comp)
- $7,131
- List price
- $30,000
- Delta
- 320.73%
- Verdict
- OVERPRICED
- Comps
- 3 within 2.0 mi
Show comp detail 3 sales within ~0.75 mi
| Address | Dist | Beds/Ba | Sqft | Sold | Price | $/sf | Match |
|---|---|---|---|---|---|---|---|
| 1112 7th Ave | 0.45mi | 2/1.0 | 880 (+8%) | 4mo | $62,000 | $70 | 63 |
| 2021 Shirley Ave | 0.64mi | 2/1.0 | 872 (+7%) | 18mo | $60,000 | $69 | 44 |
| 216 Calvary Drive Dr | 0.71mi | 2/1.0 | 917 (+12%) | 24mo | $109,900 | $120 | 26 |
Match score weights: distance 35% · size 25% · config 20% · recency 20%. Top-matched comps best support the ARV.
Projected returns pro-forma
8.18% appreciation · 0.0% rent growth · sell at horizon
- IRR
- 48.2%
- Equity multiple
- 4.22×
- Total profit
- $27,020
- Equity at exit
- $23,161
- IRR
- 40.8%
- Equity multiple
- 8.12×
- Total profit
- $59,789
- Equity at exit
- $46,330
Cash invested: $8,400 (down + closing). Projections, not guarantees.
Landlord ↔ Tenant lean methodology
- Overall (STATE)
- 90 Strongly Landlord-Friendly
- State Georgia
- 90 Strongly Landlord-Friendly · R+3
- County
- — inherits STATE
- City
- — inherits STATE
ZIP-level market 30901
- Home prices YoY
- 4.1%
- Rents YoY
- -1.3%
- Active inventory
- 129
- Price-to-rent
- 2.1×
Monthly cashflow live
- Estimated rent
- $1,163 high interval (Pro) →
- Mortgage (P&I)
- −$157
- Tax from tax record
- −$49 /mo · $585/yr
- Insurance
- −$12
- Flood insurance flood zone
- −$427 /mo · $5,118/yr
- HOA
- −$0
- Vacancy / Maint / Mgmt
- −$244
- Net cashflow
- $274
Break-even live
UW: 25.0% down · 7.5% · 30yr · 1.5% tax · 5.0% vac · 8.0% maint · 8.0% mgmt
Financing live
Cash to close
- Down payment
- $7,500
- Closing costs
- $900
- Reserves months
- —
- Total cash needed
- —
Loan-product check · same deal, 3 products live
Conventional
25% down · 7.5% · 30yr
- Down + closing
- —
- Monthly P&I
- —
- Monthly cashflow
- —
- DSCR
- —
- Eligible?
- —
Personal DTI + credit; lowest rate.
DSCR
20% down · 8.5% · 30yr
- Down + closing
- —
- Monthly P&I
- —
- Monthly cashflow
- —
- DSCR
- —
- Eligible?
- —
No personal income docs; deal must DSCR.
Hard money
10% down · 12.0% · 12mo
- Down + closing
- —
- Monthly P&I
- —
- Monthly cashflow
- —
- DSCR
- —
- Eligible?
- —
Short-term bridge; refi at stabilization.
Rent comps 36 comps
| Address | Beds | Baths | Sqft | Rent | $/sqft | DOM | Units | Dist |
|---|---|---|---|---|---|---|---|---|
| 2230 Hollis Rd Augusta, GA | 2.0 | 1.0 | 1000 | $975 | $0.97 | 43d | 1 | 0.29mi |
| 1750 Essie McIntyre Blvd Augusta, GA | 2.0 | 1.0 | 720 | $950 | $1.32 | 43d | 1 | 0.67mi |
| 1610 Cornell Dr Augusta, GA | 3.0 | 1.0 | 1025 | $1,100 | $1.07 | 23d | 1 | 0.82mi |
| 1610 Cornell Dr Augusta, GA | 3.0 | 1.0 | 1025 | $1,100 | $1.07 | 43d | 1 | 0.82mi |
| 2125 Kennedy Dr Augusta, GA | 2.0 | 1.0 | 750 | $795 | $1.06 | 14d | 1 | 0.91mi |
| 2128 Roosevelt Dr Augusta, GA | 3.0 | 2.0 | 1050 | $1,340 | $1.28 | 23d | 1 | 0.94mi |
| 1425 Lee Beard Way Augusta, GA | 1.0–2.0 | 1.0 | 776 | $1,181 | $1.52 | 43d | 1 | 1.14mi |
| 2020 Garr Dr Augusta, GA | 3.0 | 1.0 | 1100 | $1,200 | $1.09 | 14d | 1 | 1.17mi |
| 1480 Wrightsboro Rd Augusta, GA | 1.0 | 1.0 | 775 | $1,628 | $2.10 | 14d | 1 | 1.18mi |
| 1480 Wrightsboro Rd Augusta, GA | 1.0–3.0 | 1.0–2.0 | 1046 | $1,862 | $1.78 | 21d | 13 | 1.18mi |
| 1601 12th St Unit 1601 Augusta, GA | 2.0 | 1.0 | 550 | $875 | $1.59 | 43d | 1 | 1.19mi |
| 1601 12th St Unit 1603 Augusta, GA | 1.0 | 1.0 | 550 | $875 | $1.59 | 21d | 1 | 1.19mi |
| 2726 Landing Loop Dr Augusta, GA | 3.0 | 2.0 | 1008 | $1,025 | $1.02 | 44d | 1 | 1.21mi |
| 1712 Kissingbower Rd Augusta, GA | 2.0 | 1.0 | 1072 | $1,400 | $1.31 | 14d | 1 | 1.25mi |
| 1328 Baker Ave Augusta, GA | 2.0 | 1.0 | 761 | $975 | $1.28 | 43d | 1 | 1.27mi |
| 1313 Wilson St Apt C Augusta, GA | 2.0 | 2.0 | 900 | $1,350 | $1.50 | 43d | 1 | 1.29mi |
| 1912 Richmond Ave Unit 1912 Augusta, GA | 2.0 | 1.0 | 812 | $1,195 | $1.47 | 14d | 1 | 1.31mi |
| 2401 Norfolk St Augusta, GA | 2.0 | 1.0 | 991 | $949 | $0.96 | 43d | 1 | 1.35mi |
| 2201 Walden Dr Unit DRIVEA2 Augusta, GA | 2.0 | 1.5 | 1063 | $1,050 | $0.99 | 43d | 1 | 1.36mi |
| 2201 Walden Dr Unit DRIVEB2 Augusta, GA | 2.0 | 1.5 | 1063 | $1,100 | $1.03 | 43d | 1 | 1.36mi |
| 2201 Walden Dr Augusta, GA | 2.0 | 1.0 | 1063 | $1,100 | $1.03 | 43d | 1 | 1.36mi |
| 1506 Pendleton Rd Augusta, GA | 2.0 | 1.0 | 1026 | $1,300 | $1.27 | 43d | 1 | 1.37mi |
| 1506 Pendleton Rd Augusta, GA | 2.0 | 1.0 | 1026 | $1,300 | $1.27 | 23d | 1 | 1.37mi |
| 1239 Holden Dr Augusta, GA | 3.0 | 1.0 | 816 | $1,095 | $1.34 | 14d | 1 | 1.41mi |
| 1246 Holden Dr Augusta, GA | 3.0 | 1.0 | 816 | $1,195 | $1.46 | 14d | 1 | 1.42mi |
| 1244 Holden Dr Augusta, GA | 3.0 | 1.0 | 816 | $1,195 | $1.46 | 14d | 1 | 1.43mi |
| 1940 Haynie Dr Unit Main Augusta, GA | 3.0 | 1.5 | 840 | $1,500 | $1.79 | 23d | 1 | 1.44mi |
| 1940 Haynie Dr Unit Main Augusta, GA | 3.0 | 1.5 | 840 | $1,500 | $1.79 | 43d | 1 | 1.44mi |
| 1940 Haynie Dr Unit 2 Augusta, GA | 1.0 | 1.0 | 840 | $850 | $1.01 | 23d | 1 | 1.44mi |
| 2016 Central Ave Unit A Augusta, GA | 1.0 | 1.0 | 900 | $1,000 | $1.11 | 23d | 1 | 1.44mi |
| 1240 Holden Dr Augusta, GA | 2.0 | 1.0 | 675 | $1,095 | $1.62 | 43d | 1 | 1.46mi |
| 2219 Archer Augusta, GA | 2.0 | 2.0 | 1103 | $1,495 | $1.36 | 43d | 1 | 1.47mi |
| 2221 Archer LN Augusta, GA | 2.0 | 2.0 | 1103 | $1,495 | $1.36 | 43d | 1 | 1.48mi |
| 2205 Southgate Dr Augusta, GA | 1.0–2.0 | 1.0–1.5 | 770 | $1,099 | $1.43 | 14d | 7 | 1.49mi |
| 2219 Walden Dr Unit A6 Augusta, GA | 2.0 | 1.0 | 800 | $850 | $1.06 | 23d | 1 | 1.49mi |
| 2219 Walden Dr Unit C4 Augusta, GA | 1.0 | 1.0 | 600 | $750 | $1.25 | 23d | 1 | 1.49mi |
Listing history 21 events
-
2026-06-18days on market $30,000 Active 38 DOM
-
2026-06-17days on market $30,000 Active 37 DOM
-
2026-06-16days on market $30,000 Active 36 DOM
-
2026-06-15days on market $30,000 Active 35 DOM
-
2026-06-14days on market $30,000 Active 33 DOM
-
2026-06-10days on market $30,000 Active 30 DOM
-
2026-06-09days on market $30,000 Active 29 DOM
-
2026-06-08days on market $30,000 Active 28 DOM
-
2026-06-07days on market $30,000 Active 27 DOM
-
2026-06-03days on market $30,000 Active 23 DOM
-
2026-06-02days on market $30,000 Active 22 DOM
-
2026-06-01days on market $30,000 Active 21 DOM
-
2026-05-31days on market $30,000 Active 20 DOM
-
2026-05-30days on market $30,000 Active 19 DOM
-
2026-05-11historical
-
2026-02-23$30,000 Active
Show marketing remark (538 chars)
Investor Alert! Prime opportunity at 1137 11th Ave. Property is being sold strictly AS-IS with no seller disclosures. Home may be torn down, allowing for new construction and full utilization of the lot. Perfect for investors, builders, or developers looking to create a modern home or multi-unit project (verify local zoning and permits). Bring your plans and vision. This is a rare chance to capitalize on land value and redevelopment potential! Buyer to verify all information, including lot size, zoning, utilities, and permitting.
-
2026-02-23$30,000 Active 538-char remark
Show marketing remark (538 chars)
Investor Alert! Prime opportunity at 1137 11th Ave. Property is being sold strictly AS-IS with no seller disclosures. Home may be torn down, allowing for new construction and full utilization of the lot. Perfect for investors, builders, or developers looking to create a modern home or multi-unit project (verify local zoning and permits). Bring your plans and vision. This is a rare chance to capitalize on land value and redevelopment potential! Buyer to verify all information, including lot size, zoning, utilities, and permitting.
-
2020-10-01soldstatus $6,000
-
2020-10-01soldstatus $6,000
-
2020-09-12$3,000
-
2020-09-12$3,000
ⓘ Source: listings_history table (triggers on properties + properties_extension) + one-shot
backfill from property_details.listing_events for pre-trigger history.
Tax reassessment forecast GA · Resets to sale price
- Current annual tax
- $585 · $49/mo
- Projected year-2 tax
- $585 · $49/mo
- Expected delta
- $0/yr ($0/mo · 0.0%)
ⓘ Screening estimate from a state-policy table — verify with the county assessor before closing.
Climate risk First Street
- Flood 6/10 Major FEMA zone AE · 75% chance over 30 yrs
- Wildfire 1/10 Low
- Heat 8/10 Severe 7 d/yr ≥108°F today · 17 d/yr by 30 yrs out
- Wind 6/10 Major 67% chance of damaging wind over 30 yrs
- Air quality 3/10 Moderate 3 unhealthy d/yr today · 3 by 30 yrs out
Nearby sold comps map
Loading sold comps map…
Walkable amenities ~0.75 mi
Loading nearby amenities…
Taxation est. · year 1
- Rental income
- $13,958
- − Mortgage interest
- −$1,680
- − Property taxes
- −$585
- − Insurance
- −$5,268
- − Repairs & maintenance
- −$1,117
- − Management
- −$1,117
- − Depreciation
- −$873
- Taxable income
- $3,318
- Est. tax owed @ 24.0%
- −$796
- After-tax cash flow
- $2,489/yr
For passive investors: Depreciation is non-cash, so a rental often shows a tax loss while cash-flowing — sheltering income. Rental losses are passive: they offset passive income freely, and up to $25,000/yr can offset ordinary (W-2) income if you actively participate and your MAGI is under $100k (phasing out to $0 by $150k); unused losses carry forward. On sale, claimed depreciation is recaptured at up to 25%, and gains may owe capital-gains tax (a 1031 exchange can defer both). Figures are a year-1 estimate at your 24.0% rate — not tax advice; consult a CPA.
Schools (NCES district)
- District
- Richmond County
- NCES district ID
- 1304380
- Math proficiency
- 12% ▼ -9.00%
- Reading proficiency
- 20% ▼ -6.00%
- Median HH income
- $38,069
- Composite
- 13.43/100
- National rank
- #9524
- State rank
- #154 of 174 in GA
Livability — Augusta-Richmond County consolidated government (balance)
No livability data for this city. (Only ~50 U.S. cities are tracked.)
Census & demographics
- Census place
- Augusta-Richmond County consolidated government (balance), GA
- County
- Richmond County · 190,917 people
- City population
- 154,035
- Metro
- Augusta-Richmond County, GA-SC
- Population (ZIP)
- 16,484
- Household income
- $25,163
- Rent vs Own
- Severe rent burden
- 2063.0
Population outlook (Richmond County) Hauer SSP2
- Today (2025)
- 200,753 people
- By 2030
- 200,232 · -0.3%
- By 2040
- 196,813 · -2.0%
- By 2050
- 190,347 · -5.2%
- By 2075
- 172,496 · -14.1%
- By 2100
- 146,284 · -27.1%
Race, ethnicity, and origin ACS 2023
- Neighborhood character
- Predominantly Black (78%)
- Race & ethnicity
- Black 78% White 15% Two or more races 4% Hispanic / Latino 2%
- Common ancestry
- Lithuanian 1% Slovak 1%
- Foreign-born
- 1% · Canada
- Languages at home
- 97% English-only · Spanish 1%
Political lean MEDSL · Richmond
- 2024 margin
- Solid D (+36.1) · D 67.8% · R 31.7%
- 2008→2024 swing
- +4.3pp toward D · 2008: 31.8pp · 2024: 36.1pp
- All cycles
- 2024: D+36.1 2020: D+37.2 2016: D+32.4 2012: D+33.8 2008: D+31.8
Not yet ingested
- Civics
- —
Market trends
- HPI YoY
- ▲ 8.18%
- Current HPI
- 206.3145
- Rent YoY
- ▼ -1.31%
- Metro
- Augusta-Richmond County, GA-SC
- State GDP YoY
- ▲ 2.66%
- F500 in state
- 28
Industry mix (Fortune 500 HQ in GA)
| Industry | F500 HQs | Revenue |
|---|---|---|
| Paper / Packaging | 2 | $29B |
|
||
| Retail | 1 | $160B |
|
||
| Transportation / Logistics | 1 | $91B |
|
||
| Airlines | 1 | $62B |
|
||
| Consumer Goods | 1 | $47B |
|
||
| Utilities | 1 | $25B |
|
||
Price history
+900.0% since first listed7 events — show timeline
- 2026-05-11 Listing Removed — Hive MLS
- 2026-02-23 Listed $30,000 Hive MLS
- 2026-02-23 Listed $30,000 Hive MLS
- 2020-10-01 Sold (MLS) $6,000 Hive MLS
- 2020-10-01 Sold (MLS) $6,000 Hive MLS
- 2020-09-12 Listed $3,000 Hive MLS
- 2020-09-12 Listed $3,000 Hive MLS
Property tax history
+2.0%/yrLatest (2025): $585 · -6.5% YoY. Source: county tax records.
Cash-flow waterfall
monthlySold comps — $/sqft
last 12 mo · ≤1 miLoading sold comps…