970 E 4th St · Superior, NE
Flood risk 1/10 · Minimal
- FEMA flood zone
- X (unshaded)
- Chance of flooding over 30 yrs
- 0.0%
- Est. flood insurance / yr
- $473 – $860
Fire risk 5/10 · Moderate
- Est. fire insurance / yr
- $1,161 – $2,155
Heat risk 4/10 · Minor
- Hot days now (above 105°F)
- 7 days/yr
- Hot days in 30 yrs
- 16 days/yr
Wind risk 2/10 · Minimal
- Chance of severe wind over 30 yrs
- —
Air-quality risk 2/10 · Minimal
- Unhealthy air days now
- 1 days/yr
- Unhealthy air days in 30 yrs
- 1 days/yr
Risk factors via First Street. Map © Google.
Why this score? — see what drove the B- grade
The composite is a weighted blend of 9 inputs, each scored 0–100. Each bar is that input's sub-score; the figure is the points it added to the 100-point composite (weight × sub-score).
- Cash flow +30.0/30.0
- DSCR +10.0/10.0
- Appreciation +8.2/10.0
- 1% rule +8.0/10.0
- Livability +3.8/5.0
- Schools +3.7/10.0
- Rent growth +2.5/5.0
- Condition / age +2.5/5.0
- ARV discount +0.0/15.0
$78,000
🖨 Deal sheet (PDF) 📄 Offer letter ✓ Due diligence
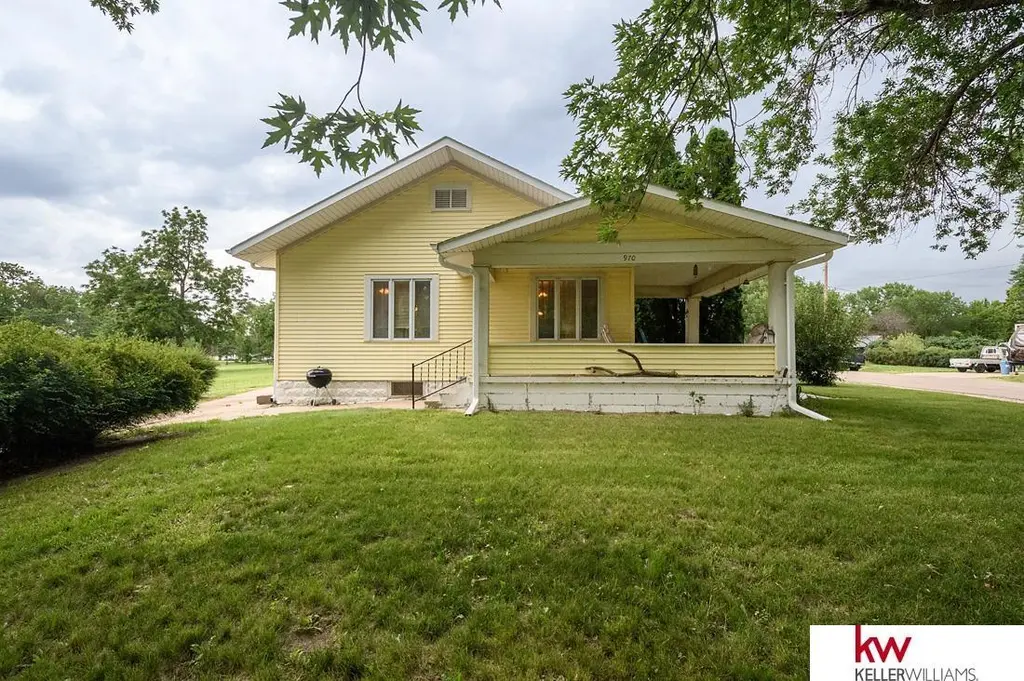
Listing remarks
Welcome home to this charming bungalow nestled on a mature, shaded lot in Superior! From the inviting covered front porch to the character-filled interior, this home offers comfort and versatility throughout. The main floor features a spacious living room, formal dining room, kitchen, and a bonus office/den that could serve a variety of needs. Two bedrooms and a ¾ bathroom complete the main level. Downstairs, you'll find additional usable space with a bonus living area, laundry room, and a second ¾ bathroom, providing plenty of storage and future potential. Outside, enjoy the established yard with mature trees and a detached 2-car garage. Whether you're looking for your first
Key facts
- Covered front porch
- Bonus living area
- Bonus office den
Tags
Property features AI
Exterior
- Parking: Detached 2-car garage; Two covered parking spaces
- Utilities: Public water; Public sewer
- Home design: Single-family residence; Residential property; Built in 1915; One story
- Construction: Block foundation
- Exterior features: Front porch; Lot approximately 0.2 acre (60 x 150); Lot up to 1/4 acre
Interior
- Bedrooms: Primary bedroom on the main floor; Second bedroom on the main floor
- Bathrooms: Two total bathrooms; One full bathroom on the main floor; One bathroom below grade
- Heating & cooling: Natural gas forced-air heating; Central air conditioning
- Interior features: Partially finished basement; No fireplaces
Neighborhood map
What this means for you Summary
Snapshot
- This is a 2-bed/2.0-bath single-family listed at $78k.
Deal economics
- At list price, monthly cash flow is $303 ($4k/yr) — positive.
- The deal already cash-flows at list — no discount required.
- Meets the 1% rule at list price ($1k rent vs $78k).
Location & tenants
- Location reads 75/100 on livability (#106 in NE, #4,283 nationally) — a middle-class / working-renter tenant base. Strengths: crime A+, cost of living A+, housing A+; Watch: employment D+, amenities F, commute F.
- Superior Public Schools (rural): math 40% / reading 43% proficiency, ranked #207 of 245 in NE (top 84%) — families likely to look elsewhere, expect single-tenant / working-renter base with shorter leases.
- Zoned schools: Superior Elementary School (math 27% / reading 42%, grade F, #390 of 502 statewide, top 80%, 196 students, 48% FRL); Superior Middle School (math 27% / reading 32%, grade F, #113 of 128 statewide, top 89%, 84 students, 52% FRL); Superior Sr High School (math 30% / reading 50%, grade F, #182 of 261 statewide, top 70%, 130 students, 52% FRL) — zoned schools average 51% FRL vs 32% district-wide (19 pts higher); higher-poverty schools than district average — tighter screening recommended.
- Market conditions: 17 active listings in the ZIP; 8 units permitted in Nuckolls County in 2024 (0 in 5+ unit buildings).
Forward outlook
- In year one you build about $5k of equity ($539 loan paydown + $5k appreciation (6.3% local appreciation)).
- Nuckolls County population projected at -16% by 2050 — secular population decline; favor cash flow + early exit over multi-decade hold.
- At projected returns (6.3% appreciation + 3.0% rent growth), your $22k cash investment doubles in ~3 years — after that, you're playing with house money.
- By year 7, paydown + projected appreciation supports a ~$36k cash-out refi (75% LTV) — recoverable capital for the next deal without selling this one.
Negotiation context
- Only 5 days on market — expect competitive offers; lowballing is unlikely to land.
Risks & watch-outs
- Watch-outs: built in 1915 — expect roof / HVAC / electrical / plumbing capex.
- Climate carrying-cost: moderate wildfire risk — expect insurance premiums to compound above CPI over the hold.
Questions for the listing agent
- Built in 1915 — when were the roof, HVAC, electrical panel, plumbing, and water heater last replaced?
- Is there a deadline driving the sale (1031 exchange, divorce, estate, relocation)? That informs how much negotiation room exists.
- Schools are D-rated, which usually means shorter tenancies and higher turnover. Who's the typical renter profile here, and what's been the actual vacancy rate?
- What's the average days-on-market for RENTAL listings here right now (not sales)? A rising rental-DOM trend means longer vacancies and softer asking-rent achievability than the comps imply.
- What's the recent tenant-quality profile in this submarket — average credit score on applications, eviction rate, late-payment / NSF rate, and stable-employment percentage? A property-management company in the area should have these aggregated.
- How much new for-sale + rental construction is in the pipeline within 1–3 miles? Heavy new supply typically softens prices + rents 12–24 months out; constrained supply supports both.
Investment metrics
- 1% rule
- 1.30% ✓
- Cap rate
- 10.95%
- Cash-on-cash
- 16.64%
- DSCR
- 1.74
- GRM
- 6.4
CMA / ARV
- ARV (on-the-fly)
- $61,200
- Comps found
- 3
Show comp detail 3 sales within ~0.75 mi
| Address | Dist | Beds/Ba | Sqft | Sold | Price | $/sf | Match |
|---|---|---|---|---|---|---|---|
| 705 E 6th St | 0.25mi | 3/1.5 (+1) | 1,222 (+2%) | 17mo | $105,000 | $86 | 64 |
| 522 N Dakota St | 0.44mi | 2/1.0 | 1,032 (-14%) | 9mo | $25,000 | $24 | 45 |
| 915 N Commercial Ave | 0.70mi | 2/1.0 | 1,128 (-6%) | 23mo | $58,000 | $51 | 34 |
Match score weights: distance 35% · size 25% · config 20% · recency 20%. Top-matched comps best support the ARV.
Projected returns pro-forma
6.33% appreciation · 3.0% rent growth · sell at horizon
- IRR
- 29.9%
- Equity multiple
- 2.98×
- Total profit
- $43,335
- Equity at exit
- $50,675
- IRR
- 27.6%
- Equity multiple
- 6.13×
- Total profit
- $111,970
- Equity at exit
- $93,347
Cash invested: $21,840 (down + closing). Projections, not guarantees.
Landlord ↔ Tenant lean methodology
- Overall (STATE)
- 83 Strongly Landlord-Friendly
- State Nebraska
- 83 Strongly Landlord-Friendly · R+13
- County
- — inherits STATE
- City
- — inherits STATE
ZIP-level market 68978
- Home prices YoY
- 4.3%
- Active inventory
- 17
- Price-to-rent
- 6.4×
Monthly cashflow live
- Estimated rent
- $1,012 medium interval (Pro) →
- Mortgage (P&I)
- −$409
- Tax from tax record
- −$56 /mo · $666/yr
- Insurance
- −$32
- HOA
- −$0
- Vacancy / Maint / Mgmt
- −$213
- Net cashflow
- $303
Break-even live
Sensitivity live
| Price | -10% $347 | -5% $325 | +0% $303 | +5% $281 | +10% $259 |
|---|---|---|---|---|---|
| Rent | -10% $223 | -5% $263 | +0% $303 | +5% $343 | +10% $383 |
| Rate | -1.0pp $342 | -0.5pp $323 | base $303 | +0.5pp $283 | +1.0pp $262 |
UW: 25.0% down · 7.5% · 30yr · 1.5% tax · 5.0% vac · 8.0% maint · 8.0% mgmt
Financing live
Cash to close
- Down payment
- $19,500
- Closing costs
- $2,340
- Reserves months
- —
- Total cash needed
- —
Loan-product check · same deal, 3 products live
Conventional
25% down · 7.5% · 30yr
- Down + closing
- —
- Monthly P&I
- —
- Monthly cashflow
- —
- DSCR
- —
- Eligible?
- —
Personal DTI + credit; lowest rate.
DSCR
20% down · 8.5% · 30yr
- Down + closing
- —
- Monthly P&I
- —
- Monthly cashflow
- —
- DSCR
- —
- Eligible?
- —
No personal income docs; deal must DSCR.
Hard money
10% down · 12.0% · 12mo
- Down + closing
- —
- Monthly P&I
- —
- Monthly cashflow
- —
- DSCR
- —
- Eligible?
- —
Short-term bridge; refi at stabilization.
Listing history 5 events
-
2026-06-08status $78,000 Pending 5 DOM
-
2026-06-07statusdays on market $78,000 Active 5 DOM
-
2026-06-07days on market $78,000 New 4 DOM
-
2026-06-02remarks 685-char remark
-
2026-06-02$78,000 New 1 DOM
ⓘ Source: listings_history table (triggers on properties + properties_extension) + one-shot
backfill from property_details.listing_events for pre-trigger history.
Tax reassessment forecast NE · Resets to sale price
- Current annual tax
- $666 · $56/mo
- Projected year-2 tax
- $1,349 · $112/mo
- Expected delta
- +$683/yr (+$57/mo · 102.5%)
ⓘ Screening estimate from a state-policy table — verify with the county assessor before closing.
Climate risk First Street
- Flood 1/10 Low FEMA zone X (unshaded) · 0% chance over 30 yrs
- Wildfire 5/10 Major
- Heat 4/10 Moderate 7 d/yr ≥105°F today · 16 d/yr by 30 yrs out
- Wind 2/10 Low
- Air quality 2/10 Low 1 unhealthy d/yr today · 1 by 30 yrs out
Nearby sold comps map
Loading sold comps map…
Walkable amenities ~0.75 mi
Loading nearby amenities…
Taxation est. · year 1
- Rental income
- $12,149
- − Mortgage interest
- −$4,369
- − Property taxes
- −$666
- − Insurance
- −$390
- − Repairs & maintenance
- −$972
- − Management
- −$972
- − Depreciation
- −$2,269
- Taxable income
- $2,511
- Est. tax owed @ 24.0%
- −$603
- After-tax cash flow
- $3,031/yr
For passive investors: Depreciation is non-cash, so a rental often shows a tax loss while cash-flowing — sheltering income. Rental losses are passive: they offset passive income freely, and up to $25,000/yr can offset ordinary (W-2) income if you actively participate and your MAGI is under $100k (phasing out to $0 by $150k); unused losses carry forward. On sale, claimed depreciation is recaptured at up to 25%, and gains may owe capital-gains tax (a 1031 exchange can defer both). Figures are a year-1 estimate at your 24.0% rate — not tax advice; consult a CPA.
Schools (NCES district)
- District
- Superior Public Schools
- NCES district ID
- 3100029
- Math proficiency
- 40% ▼ -2.00%
- Reading proficiency
- 43% ▼ -2.00%
- Median HH income
- $34,509
- Composite
- 36.62/100
- National rank
- #9257
- State rank
- #207 of 245 in NE
Livability — Superior
- Score
- 75/100
- State rank
- #106
- US rank
- #4283
Category grades
Schools grade is shown separately in the Schools card above.
Census & demographics
- Census place
- Superior, NE
- Population (ZIP)
- 2,382
Population outlook (Nuckolls County) Hauer SSP2
- Today (2025)
- 3,977 people
- By 2030
- 3,854 · -3.1%
- By 2040
- 3,601 · -9.5%
- By 2050
- 3,341 · -16.0%
- By 2075
- 3,101 · -22.0%
- By 2100
- 2,582 · -35.1%
Race, ethnicity, and origin ACS 2023
- Neighborhood character
- Predominantly White (92%)
- Race & ethnicity
- White 92% Two or more races 5% Hispanic / Latino 3%
- Common ancestry
- Lithuanian 2% Danish 1% Hungarian 1%
- Foreign-born
- 2% · Canada
- Languages at home
- 98% English-only · Spanish 1%
Political lean MEDSL · Nuckolls
- 2024 margin
- Solid R (+63.6) · D 17.7% · R 81.3% · Other 1.0%
- 2008→2024 swing
- -25.8pp toward R · 2008: -37.9pp · 2024: -63.6pp
- All cycles
- 2024: R+63.6 2020: R+62.8 2016: R+63.2 2012: R+45.9 2008: R+37.9
Not yet ingested
- Civics
- —
Market trends
- HPI YoY
- ▲ 6.33%
- Current HPI
- 154.5161
- Rent YoY
- —
- Metro
- —
- State GDP YoY
- ▲ 0.68%
- F500 in state
- 2
Industry mix (Fortune 500 HQ in NE)
| Industry | F500 HQs | Revenue |
|---|---|---|
| Conglomerate | 1 | $371B |
|
||
Price history
1 event — show timeline
- 2026-06-02 Listed $78,000 GPRMLS
Property tax history
-1.8%/yrLatest (2025): $666 · +3.0% YoY. Source: county tax records.
Cash-flow waterfall
monthlySold comps — $/sqft
last 12 mo · ≤1 miLoading sold comps…