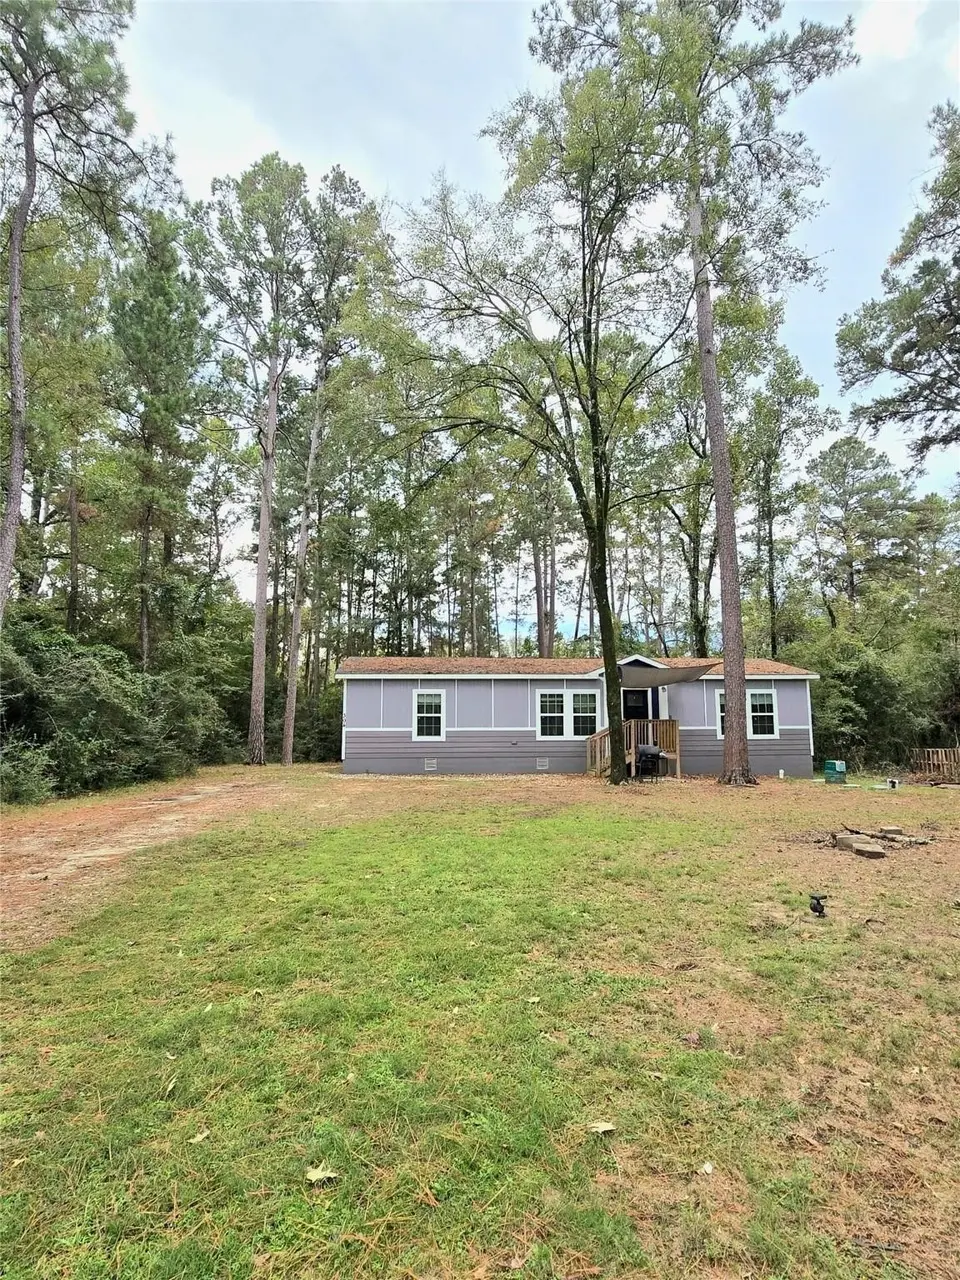
304 N Walnut Dr · Westwood Shores, TX
Flood risk 1/10 · Minimal
- FEMA flood zone
- —
- Chance of flooding over 30 yrs
- 0.0%
- Est. flood insurance / yr
- —
Fire risk 4/10 · Minor
- Est. fire insurance / yr
- $1,222 – $2,270
Heat risk 8/10 · Major
- Hot days now (above 111°F)
- 7 days/yr
- Hot days in 30 yrs
- 24 days/yr
Wind risk 8/10 · Major
- Chance of severe wind over 30 yrs
- 92.0%
Air-quality risk 1/10 · Minimal
- Unhealthy air days now
- 0 days/yr
- Unhealthy air days in 30 yrs
- 0 days/yr
Risk factors via First Street. Map © Google.
Why this score? — see what drove the D grade
The composite is a weighted blend of 9 inputs, each scored 0–100. Each bar is that input's sub-score; the figure is the points it added to the 100-point composite (weight × sub-score).
- Cash flow +11.7/30.0
- ARV discount +7.5/15.0
- Appreciation +4.7/10.0
- 1% rule +3.9/10.0
- DSCR +3.4/10.0
- Livability +3.1/5.0
- Rent growth +2.5/5.0
- Condition / age +2.5/5.0
- Schools +2.3/10.0
$150,000
🖨 Deal sheet 📄 Offer letter ✓ Due diligence
Listing remarks MLS
3 bedroom 2 bath located in The Landing on Lake Livingston. Neighborhood amenities include a boat launch, a clubhouse, fishing pier, and park. A beautiful quiet home, nestled in the trees near the lake and golf course. It is a very peaceful place to be.
Key facts
- Fishing pier
- Clubhouse
- Boat launch
Tags
Neighborhood map
What this means for you Summary
Snapshot
- This is a 3-bed/2.0-bath manufactured listed at $150k.
Deal economics
- At list price, monthly cash flow is $-45 ($-536/yr) — negative.
- To cash-flow at today's rent, offer at most $142k (5.3% below list).
- To meet the 1% rule (rent ≥ 1% of price), the offer needs to be $133k (11.2% below list).
- Recommended offer: $132k (12.0% below list) — sets the bar for market timing.
- Cap rate 5.9% vs local median 3.6% in Westwood Shores — top-decile yield for the area; either an underpriced asset or a hidden risk that comps aren't pricing in. Stress-test before assuming the spread holds.
Location & tenants
- Location reads 62/100 on livability (#914 in TX) — a middle-class / working-renter tenant base. Strengths: crime A+, cost of living A+, housing A+; Watch: schools F, amenities F, commute F.
- Trinity ISD (rural): math 27% / reading 29% proficiency, ranked #682 of 826 in TX (top 83%) — low school quality limits family demand, transient renter base, plan for 1-2y turnover.
- Market conditions: 468 active listings in the ZIP; 1 units permitted in Trinity County in 2024 (0 in 5+ unit buildings).
Forward outlook
- In year one you build about $262 of equity ($1k loan paydown + $-775 appreciation (-0.5% local appreciation)).
- Trinity County population projected at -13% by 2050 — secular population decline; favor cash flow + early exit over multi-decade hold.
Negotiation context
- It's been on market 158 days — a 12% lower offer ($132k) is reasonable based on typical stale-listing flexibility.
- 4 sale attempts since 4y ago; this cycle's ask has dropped $40k (21%) from the opening price — seller is motivated, your offer sets the floor, not the list.
Risks & watch-outs
- Climate carrying-cost: severe wind risk, 92% chance of damaging wind over 30y; extreme-heat days projected 7→24/yr by 2055 (HVAC capex compounding) — expect insurance premiums to compound above CPI over the hold.
Questions for the listing agent
- What do current leases actually rent for vs. the listed asking? Can we see a recent rent roll and the last 12 months of T-12 income?
- It's been on market 158 days. Have you received any prior offers? Is the seller open to a 12% concession, seller financing, or rate buy-down credit?
- What does the HOA fee cover, when was the last increase, and are there any pending special assessments or reserve-fund shortfalls?
- Why hasn't it sold? Are there any deal-killer items the seller is aware of (foundation, flood, title, zoning, code violations)?
- Is there a deadline driving the sale (1031 exchange, divorce, estate, relocation)? That informs how much negotiation room exists.
- Schools are F-rated, which usually means shorter tenancies and higher turnover. Who's the typical renter profile here, and what's been the actual vacancy rate?
- The area grade is low — what's the realistic commute time and amenity access for the typical tenant pool here? Any planned neighborhood developments (good or bad) we should know about?
- What's the average days-on-market for RENTAL listings here right now (not sales)? A rising rental-DOM trend means longer vacancies and softer asking-rent achievability than the comps imply.
- What's the recent tenant-quality profile in this submarket — average credit score on applications, eviction rate, late-payment / NSF rate, and stable-employment percentage? A property-management company in the area should have these aggregated.
- How much new for-sale + rental construction is in the pipeline within 1–3 miles? Heavy new supply typically softens prices + rents 12–24 months out; constrained supply supports both.
Investment metrics
- 1% rule
- 0.89% ✗
- Cap rate
- 5.94%
- Cash-on-cash
- -1.28%
- DSCR
- 0.94
- GRM
- 9.4
CMA / ARV
- ARV (median comp)
- $325,000
- List price
- $150,000
- Delta
- -53.85%
- Verdict
- UNDERPRICED
- Comps
- 1 within 2.0 mi
Projected returns pro-forma
-0.52% appreciation · 3.0% rent growth · sell at horizon
- IRR
- -5.7%
- Equity multiple
- 0.74×
- Total profit
- $-10,785
- Equity at exit
- $39,719
- IRR
- 0.7%
- Equity multiple
- 1.07×
- Total profit
- $2,873
- Equity at exit
- $44,780
Cash invested: $42,000 (down + closing). Projections, not guarantees.
Landlord ↔ Tenant lean methodology
- Overall (STATE)
- 87 Strongly Landlord-Friendly
- State Texas
- 87 Strongly Landlord-Friendly · R+5
- County
- — inherits STATE
- City
- — inherits STATE
ZIP-level market 75862
- Home prices YoY
- -0.3%
- Active inventory
- 468
- Price-to-rent
- 9.4×
Monthly cashflow live
- Estimated rent
- $1,332 medium interval (Pro) →
- Mortgage (P&I)
- −$787
- Tax from tax record
- −$138 /mo · $1,655/yr
- Insurance
- −$62
- HOA
- −$110
- Vacancy / Maint / Mgmt
- −$280
- Net cashflow
- $-45
Break-even live
UW: 25.0% down · 7.5% · 30yr · 1.5% tax · 5.0% vac · 8.0% maint · 8.0% mgmt
Financing live
Cash to close
- Down payment
- $37,500
- Closing costs
- $4,500
- Reserves months
- —
- Total cash needed
- —
Loan-product check · same deal, 3 products live
Conventional
25% down · 7.5% · 30yr
- Down + closing
- —
- Monthly P&I
- —
- Monthly cashflow
- —
- DSCR
- —
- Eligible?
- —
Personal DTI + credit; lowest rate.
DSCR
20% down · 8.5% · 30yr
- Down + closing
- —
- Monthly P&I
- —
- Monthly cashflow
- —
- DSCR
- —
- Eligible?
- —
No personal income docs; deal must DSCR.
Hard money
10% down · 12.0% · 12mo
- Down + closing
- —
- Monthly P&I
- —
- Monthly cashflow
- —
- DSCR
- —
- Eligible?
- —
Short-term bridge; refi at stabilization.
HOA detail
- Monthly dues
- $110 · $1,320/yr
Listing history 31 events
-
2026-06-19days on market $150,000 Active 158 DOM
-
2026-06-18days on market $150,000 Active 157 DOM
-
2026-06-17days on market $150,000 Active 156 DOM
-
2026-06-16days on market $150,000 Active 155 DOM
-
2026-06-15days on market $150,000 Active 154 DOM
-
2026-06-14days on market $150,000 Active 152 DOM
-
2026-06-13days on market $150,000 Active 151 DOM
-
2026-06-10days on market $150,000 Active 149 DOM
-
2026-06-09days on market $150,000 Active 148 DOM
-
2026-06-08days on market $150,000 Active 147 DOM
-
2026-06-07days on market $150,000 Active 146 DOM
-
2026-06-05days on market $150,000 Active 143 DOM
-
2026-06-02days on market $150,000 Active 141 DOM
-
2026-06-01days on market $150,000 Active 140 DOM
-
2026-05-31days on market $150,000 Active 139 DOM
-
2026-05-30days on market $150,000 Active 138 DOM
-
2026-04-28price $150,000 254-char remark
Show marketing remark (254 chars)
3 bedroom 2 bath located in The Landing on Lake Livingston. Neighborhood amenities include a boat launch, a clubhouse, fishing pier, and park. A beautiful quiet home, nestled in the trees near the lake and golf course. It is a very peaceful place to be.
-
2026-04-22price $160,000 254-char remark
Show marketing remark (254 chars)
3 bedroom 2 bath located in The Landing on Lake Livingston. Neighborhood amenities include a boat launch, a clubhouse, fishing pier, and park. A beautiful quiet home, nestled in the trees near the lake and golf course. It is a very peaceful place to be.
-
2026-04-15price $177,000 254-char remark
Show marketing remark (254 chars)
3 bedroom 2 bath located in The Landing on Lake Livingston. Neighborhood amenities include a boat launch, a clubhouse, fishing pier, and park. A beautiful quiet home, nestled in the trees near the lake and golf course. It is a very peaceful place to be.
-
2026-01-12$190,000 Active 254-char remark
Show marketing remark (254 chars)
3 bedroom 2 bath located in The Landing on Lake Livingston. Neighborhood amenities include a boat launch, a clubhouse, fishing pier, and park. A beautiful quiet home, nestled in the trees near the lake and golf course. It is a very peaceful place to be.
-
2025-11-23historical
-
2025-10-25$190,000 Active
-
2025-06-30historical
-
2025-06-06price $179,000
-
2025-05-09$185,000 Active
-
2023-04-20soldstatus Sold
-
2023-03-27status Pending
-
2023-03-15status Option Pending
-
2023-02-01price $179,900
-
2022-11-24price $189,900
-
2022-09-21$195,000 Active
ⓘ Source: listings_history table (triggers on properties + properties_extension) + one-shot
backfill from property_details.listing_events for pre-trigger history.
Tax reassessment forecast TX · Resets to sale price
- Current annual tax
- $1,655 · $138/mo
- Projected year-2 tax
- $2,745 · $229/mo
- Expected delta
- +$1,090/yr (+$91/mo · 65.8%)
ⓘ Screening estimate from a state-policy table — verify with the county assessor before closing.
Climate risk First Street
- Flood 1/10 Low 0% chance over 30 yrs
- Wildfire 4/10 Moderate
- Heat 8/10 Severe 7 d/yr ≥111°F today · 24 d/yr by 30 yrs out
- Wind 8/10 Severe 92% chance of damaging wind over 30 yrs
- Air quality 1/10 Low 0 unhealthy d/yr today · 0 by 30 yrs out
Nearby sold comps map
Loading sold comps map…
Walkable amenities ~0.75 mi
Loading nearby amenities…
Taxation est. · year 1
- Rental income
- $15,985
- − Mortgage interest
- −$8,402
- − Property taxes
- −$1,655
- − Insurance
- −$750
- − Repairs & maintenance
- −$1,279
- − Management
- −$1,279
- − HOA
- −$1,320
- − Depreciation
- −$4,364
- Taxable loss
- −$3,064
- Est. tax savings @ 24.0%
- +$735
- After-tax cash flow
- $199/yr
For passive investors: Depreciation is non-cash, so a rental often shows a tax loss while cash-flowing — sheltering income. Rental losses are passive: they offset passive income freely, and up to $25,000/yr can offset ordinary (W-2) income if you actively participate and your MAGI is under $100k (phasing out to $0 by $150k); unused losses carry forward. On sale, claimed depreciation is recaptured at up to 25%, and gains may owe capital-gains tax (a 1031 exchange can defer both). Figures are a year-1 estimate at your 24.0% rate — not tax advice; consult a CPA.
Schools (NCES district)
- District
- Trinity ISD
- NCES district ID
- 4843200
- Math proficiency
- 27% ▼ -2.00%
- Reading proficiency
- 29% ▲ 1.00%
- Median HH income
- $37,104
- Composite
- 23.31/100
- National rank
- #7919
- State rank
- #682 of 826 in TX
Livability — Westwood Shores
- Score
- 62/100
- State rank
- #914
- US rank
- #16347
Category grades
Schools grade is shown separately in the Schools card above.
Census & demographics
- Population (ZIP)
- 10,030
Population outlook (Trinity County) Hauer SSP2
- Today (2025)
- 13,746 people
- By 2030
- 13,333 · -3.0%
- By 2040
- 12,542 · -8.8%
- By 2050
- 11,942 · -13.1%
- By 2075
- 10,871 · -20.9%
- By 2100
- 9,784 · -28.8%
Race, ethnicity, and origin ACS 2023
- Neighborhood character
- Predominantly White (74%)
- Race & ethnicity
- White 74% Hispanic / Latino 12% Black 10% Two or more races 7%
- Hispanic origin (detail)
- Mexican 11%
- Common ancestry
- Lithuanian 3% Serbian 2% Slovak 2%
- Foreign-born
- 4% · Canada
- Languages at home
- 89% English-only · Spanish 9% French/Haitian/Cajun 2%
Political lean MEDSL · Trinity
- 2024 margin
- Solid R (+67.0) · D 16.2% · R 83.2%
- 2008→2024 swing
- -31.3pp toward R · 2008: -35.7pp · 2024: -67.0pp
- All cycles
- 2024: R+67.0 2020: R+61.3 2016: R+59.9 2012: R+46.9 2008: R+35.7
Not yet ingested
- Civics
- —
Market trends
- HPI YoY
- ▼ -0.52%
- Current HPI
- 174.6638
- Rent YoY
- —
- Metro
- —
- State GDP YoY
- ▲ 3.95%
- F500 in state
- 110
Industry mix (Fortune 500 HQ in TX)
| Industry | F500 HQs | Revenue |
|---|---|---|
| Energy | 16 | $1,198B |
|
||
| Technology | 5 | $198B |
|
||
| Engineering / Construction | 4 | $72B |
|
||
| Energy Services | 3 | $60B |
|
||
| Utilities | 3 | $41B |
|
||
| Healthcare | 2 | $330B |
|
||
Price history
-23.1% since first listed15 events — show timeline
- 2026-04-28 Price Changed $150,000 HARMLS
- 2026-04-22 Price Changed $160,000 HARMLS
- 2026-04-15 Price Changed $177,000 HARMLS
- 2026-01-12 Listed $190,000 HARMLS
- 2025-11-23 Listing Removed — HARMLS
- 2025-10-25 Listed $190,000 HARMLS
- 2025-06-30 Listing Removed — HARMLS
- 2025-06-06 Price Changed $179,000 HARMLS
- 2025-05-09 Listed $185,000 HARMLS
- 2023-04-20 Sold (MLS) — HARMLS
- 2023-03-27 Pending — HARMLS
- 2023-03-15 Pending — HARMLS
- 2023-02-01 Price Changed $179,900 HARMLS
- 2022-11-24 Price Changed $189,900 HARMLS
- 2022-09-21 Listed $195,000 HARMLS
Property tax history
+58.5%/yrLatest (2025): $1,655 · -15.7% YoY. Source: county tax records.
Cash-flow waterfall
monthlySold comps — $/sqft
last 12 mo · ≤1 miLoading sold comps…