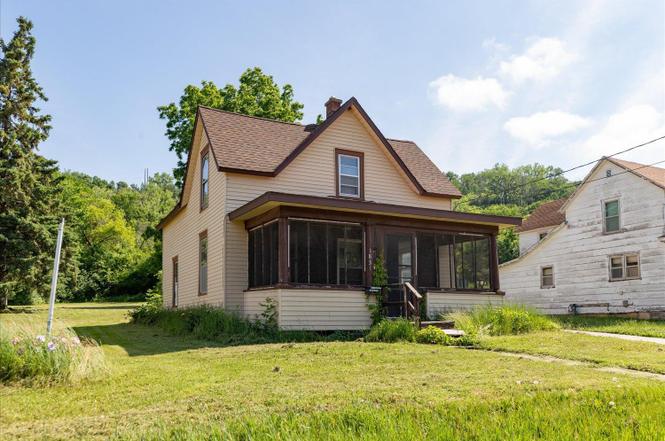
1831 Bush St · Red Wing, MN
Flood risk 1/10 · Minimal
- FEMA flood zone
- X (unshaded)
- Chance of flooding over 30 yrs
- 0.0%
- Est. flood insurance / yr
- $473 – $860
Fire risk 2/10 · Minimal
- Est. fire insurance / yr
- $888 – $1,650
Heat risk 2/10 · Minimal
- Hot days now (above 100°F)
- 7 days/yr
- Hot days in 30 yrs
- 15 days/yr
Wind risk 2/10 · Minimal
- Chance of severe wind over 30 yrs
- —
Air-quality risk 1/10 · Minimal
- Unhealthy air days now
- 0 days/yr
- Unhealthy air days in 30 yrs
- 0 days/yr
Risk factors via First Street. Map © Google.
Why this score? — see what drove the C grade
The composite is a weighted blend of 9 inputs, each scored 0–100. Each bar is that input's sub-score; the figure is the points it added to the 100-point composite (weight × sub-score).
- Cash flow +24.0/30.0
- DSCR +7.7/10.0
- ARV discount +7.5/15.0
- 1% rule +6.1/10.0
- Livability +4.0/5.0
- Schools +3.5/10.0
- Rent growth +2.5/5.0
- Condition / age +2.5/5.0
- Appreciation +0.0/10.0
$150,000
🖨 Deal sheet (PDF) 📄 Offer letter ✓ Due diligence
Listing remarks MLS
AN ENORMOUS REAR-YARD PROVIDES ABUNDANT SPACE FOR GARDEN OR PLAY. MANY RECENT UPDATES INCLUDE: MAINTENANCE FREE SIDING, LIGHT-OAK KITCHEN CABINETS, A NEWER FURNACE AND WATER HEATER, AND A NEW REFRIGERATOR.
Key facts
- Screened front porch
- Separate dining room
- Main-level half bath
Tags
Property features AI
Exterior
- Parking: Detached or on-site garage (1-car); Concrete parking surface; Garage dimensions approximately 22x20
- Utilities: City water; City sewer; Natural gas fuel; 100 amp electric service with circuit breakers
- Home design: Residential property; One-and-a-half story layout; Entry includes a front porch
- Construction: Concrete construction materials; Block foundation; Other structures: garage(s) and storage shed
- Exterior features: Enclosed, front and screened porch; Light tree coverage; Garage(s) and storage shed on the property
Interior
- Kitchen: Range; Refrigerator; Eat-in kitchen
- Bedrooms: 3 bedrooms (all are on upper and main levels as noted: two upper bedrooms and one main-level bedroom); Bedroom sizes include 19x14, 13x11, and 9x14
- Bathrooms: One full bathroom on the upper level; Half bathroom on the main floor
- Heating & cooling: Forced air heating; Window air conditioning units
- Interior features: Ceiling fans; Kitchen window; Porch; Walk-in closet; Partial unfinished basement
- Laundry & utility: Washer and dryer; Gas water heater; Main-level laundry
Neighborhood map
What this means for you Summary
Snapshot
- This is a 3-bed/1.5-bath single-family listed at $150k.
Deal economics
- At list price, monthly cash flow is $294 ($4k/yr) — positive.
- The deal already cash-flows at list — no discount required.
- Meets the 1% rule at list price ($2k rent vs $150k).
- Cap rate 8.6% vs local median 3.5% in Red Wing — top-decile yield for the area; either an underpriced asset or a hidden risk that comps aren't pricing in. Stress-test before assuming the spread holds.
Location & tenants
- Location reads 81/100 on livability (#64 in MN, #1,570 nationally) — a professional / high-income tenant draw. Strengths: cost of living A+, housing A+, health & safety A+; Watch: amenities D.
- Red Wing Public School District (rural): math 36% / reading 44% proficiency, ranked #220 of 301 in MN (top 73%) — families likely to look elsewhere, expect single-tenant / working-renter base with shorter leases.
- Zoned schools: Burnside Elementary (math 47% / reading 50%, grade D, #480 of 857 statewide, top 56%, 522 students, 42% FRL); Twin Bluff School (math 40% / reading 40%, grade F, #147 of 258 statewide, top 57%, 534 students, 37% FRL); Red Wing Senior High (math 31% / reading 44%, grade F, #280 of 471 statewide, top 59%, 866 students, 37% FRL).
- Market conditions: 145 active listings in the ZIP; 6 comparable units currently listed for rent nearby; rentals lingering (median 46d on market — plan ~5-8 weeks vacancy on turnover, expect pricing pressure); 67% of comp listings sitting > 30 days — soft ceiling on asking rent; 86 units permitted in Goodhue County in 2024 (0 in 5+ unit buildings).
Forward outlook
- Local home prices are declining (-3.0%/yr); year-one equity from $1k of loan paydown is wiped out by about $4k of value loss. Plan a longer hold.
- Goodhue County population projected at -11% by 2050 — secular population decline; favor cash flow + early exit over multi-decade hold.
Negotiation context
- Only 11 days on market — expect competitive offers; lowballing is unlikely to land.
- 2 sale attempts since 28y ago with the ask held roughly flat each time — persistent listings suggest the price (not the market) is what's stuck; bring a comps-based counter.
- Current owner paid $65k; list at $150k implies a 131% gain — meaningful room to come down on a strong offer.
Risks & watch-outs
- Watch-outs: built in 1870 — expect roof / HVAC / electrical / plumbing capex.
Questions for the listing agent
- Built in 1870 — when were the roof, HVAC, electrical panel, plumbing, and water heater last replaced?
- Is there a deadline driving the sale (1031 exchange, divorce, estate, relocation)? That informs how much negotiation room exists.
- What's the average days-on-market for RENTAL listings here right now (not sales)? A rising rental-DOM trend means longer vacancies and softer asking-rent achievability than the comps imply.
- What's the recent tenant-quality profile in this submarket — average credit score on applications, eviction rate, late-payment / NSF rate, and stable-employment percentage? A property-management company in the area should have these aggregated.
- How much new for-sale + rental construction is in the pipeline within 1–3 miles? Heavy new supply typically softens prices + rents 12–24 months out; constrained supply supports both.
Investment metrics
- 1% rule
- 1.11% ✓
- Cap rate
- 8.64%
- Cash-on-cash
- 8.39%
- DSCR
- 1.37
- GRM
- 7.5
CMA / ARV
No comps found within radius.
Projected returns pro-forma
-3.0% appreciation · 3.0% rent growth · sell at horizon
- IRR
- -3.6%
- Equity multiple
- 0.87×
- Total profit
- $-5,597
- Equity at exit
- $22,365
- IRR
- 6.1%
- Equity multiple
- 1.46×
- Total profit
- $19,255
- Equity at exit
- $12,969
Cash invested: $42,000 (down + closing). Projections, not guarantees.
Landlord ↔ Tenant lean methodology
- Overall (STATE)
- 46 Balanced
- State Minnesota
- 46 Balanced · D+2
- County
- — inherits STATE
- City
- — inherits STATE
ZIP-level market 55066
- Home prices YoY
- -28.1%
- Active inventory
- 145
- Price-to-rent
- 7.5×
Monthly cashflow live
- Estimated rent
- $1,659 high interval (Pro) →
- Mortgage (P&I)
- −$787
- Tax from tax record
- −$168 /mo · $2,016/yr
- Insurance
- −$62
- HOA
- −$0
- Lot rent
- −$0
- Vacancy / Maint / Mgmt
- −$348
- Net cashflow
- $294
Break-even live
Sensitivity live
| Price | -10% $378 | -5% $336 | +0% $294 | +5% $251 | +10% $209 |
|---|---|---|---|---|---|
| Rent | -10% $162 | -5% $228 | +0% $294 | +5% $359 | +10% $425 |
| Rate | -1.0pp $369 | -0.5pp $332 | base $294 | +0.5pp $255 | +1.0pp $215 |
UW: 25.0% down · 7.5% · 30yr · 1.5% tax · 5.0% vac · 8.0% maint · 8.0% mgmt
Financing live
Cash to close
- Down payment
- $37,500
- Closing costs
- $4,500
- Reserves months
- —
- Total cash needed
- —
Loan-product check · same deal, 3 products live
Conventional
25% down · 7.5% · 30yr
- Down + closing
- —
- Monthly P&I
- —
- Monthly cashflow
- —
- DSCR
- —
- Eligible?
- —
Personal DTI + credit; lowest rate.
DSCR
20% down · 8.5% · 30yr
- Down + closing
- —
- Monthly P&I
- —
- Monthly cashflow
- —
- DSCR
- —
- Eligible?
- —
No personal income docs; deal must DSCR.
Hard money
10% down · 12.0% · 12mo
- Down + closing
- —
- Monthly P&I
- —
- Monthly cashflow
- —
- DSCR
- —
- Eligible?
- —
Short-term bridge; refi at stabilization.
Rent comps 6 comps
| Address | Beds | Baths | Sqft | Rent | $/sqft | DOM | Units | Dist |
|---|---|---|---|---|---|---|---|---|
| 222 Bush St Unit 111 Red Wing, MN | 2.0 | 1.0 | 998 | $1,895 | $1.90 | 46d | 1 | 1.17mi |
| 222 Bush St Unit 12 Red Wing, MN | 2.0 | 1.0 | 1007 | $1,900 | $1.89 | 46d | 1 | 1.17mi |
| 222 Bush St Unit 115 Red Wing, MN | 2.0 | 1.0 | 948 | $1,800 | $1.90 | 46d | 1 | 1.17mi |
| 821 W 5th St Unit 2 Red Wing, MN | 2.0 | 1.0 | 950 | $1,150 | $1.21 | 15d | 1 | 1.18mi |
| 205 Plum St Apt 2 Red Wing, MN | 2.0 | 1.0 | 825 | $1,550 | $1.88 | 46d | 1 | 1.18mi |
| 821 W 5th St Apt 5 Red Wing, MN | 2.0 | 1.0 | 950 | $1,300 | $1.37 | 0d | 1 | 1.19mi |
Listing history 8 events
-
2026-06-22days on market $150,000 Active 11 DOM
-
2026-06-21days on market $150,000 Active 10 DOM
-
2026-06-18days on market $150,000 Active 7 DOM
-
2026-06-17days on market $150,000 Active 6 DOM
-
2026-06-16days on market $150,000 Active 5 DOM
-
2026-06-15days on market $150,000 Active 4 DOM
-
2026-06-13remarks 699-char remark
-
2026-06-13$150,000 Active 2 DOM
ⓘ Source: listings_history table (triggers on properties + properties_extension) + one-shot
backfill from property_details.listing_events for pre-trigger history.
Tax reassessment forecast MN · Partial reset (capped growth)
- Current annual tax
- $2,016 · $168/mo
- Projected year-2 tax
- $2,016 · $168/mo
- Expected delta
- $0/yr ($0/mo · 0.0%)
ⓘ Screening estimate from a state-policy table — verify with the county assessor before closing.
Climate risk First Street
- Flood 1/10 Low FEMA zone X (unshaded) · 0% chance over 30 yrs
- Wildfire 2/10 Low
- Heat 2/10 Low 7 d/yr ≥100°F today · 15 d/yr by 30 yrs out
- Wind 2/10 Low
- Air quality 1/10 Low 0 unhealthy d/yr today · 0 by 30 yrs out
Nearby sold comps map
Loading sold comps map…
Walkable amenities ~0.75 mi
Loading nearby amenities…
Taxation est. · year 1
- Rental income
- $19,909
- − Mortgage interest
- −$8,402
- − Property taxes
- −$2,016
- − Insurance
- −$750
- − Repairs & maintenance
- −$1,593
- − Management
- −$1,593
- − Depreciation
- −$4,364
- Taxable income
- $1,192
- Est. tax owed @ 24.0%
- −$286
- After-tax cash flow
- $3,237/yr
For passive investors: Depreciation is non-cash, so a rental often shows a tax loss while cash-flowing — sheltering income. Rental losses are passive: they offset passive income freely, and up to $25,000/yr can offset ordinary (W-2) income if you actively participate and your MAGI is under $100k (phasing out to $0 by $150k); unused losses carry forward. On sale, claimed depreciation is recaptured at up to 25%, and gains may owe capital-gains tax (a 1031 exchange can defer both). Figures are a year-1 estimate at your 24.0% rate — not tax advice; consult a CPA.
Schools (NCES district)
- District
- Red Wing Public School District
- NCES district ID
- 2730480
- Math proficiency
- 36% ▼ -13.00%
- Reading proficiency
- 44% ▼ -11.00%
- Median HH income
- $53,206
- Composite
- 34.77/100
- National rank
- #5122
- State rank
- #220 of 301 in MN
Livability — Red Wing
- Score
- 81/100
- State rank
- #64
- US rank
- #1570
Category grades
Schools grade is shown separately in the Schools card above.
Census & demographics
- Census place
- Red Wing, MN
- County
- Goodhue County · 19,226 people
- City population
- 19,226
- Metro
- Red Wing, MN
- Population (ZIP)
- 19,226
- Household income
- $73,584
- Rent vs Own
- Severe rent burden
- 504.0
Population outlook (Goodhue County) Hauer SSP2
- Today (2025)
- 46,532 people
- By 2030
- 46,185 · -0.7%
- By 2040
- 44,531 · -4.3%
- By 2050
- 41,532 · -10.7%
- By 2075
- 33,745 · -27.5%
- By 2100
- 23,716 · -49.0%
Race, ethnicity, and origin ACS 2023
- Neighborhood character
- Predominantly White (87%)
- Race & ethnicity
- White 87% Hispanic / Latino 6% Two or more races 4% Black 3%
- Hispanic origin (detail)
- Mexican 3%
- Common ancestry
- Portuguese 14% Romanian 3% Scottish 2%
- Foreign-born
- 4% · Canada
- Languages at home
- 95% English-only · Spanish 4%
Political lean MEDSL · Goodhue
- 2024 margin
- R (+16.4) · D 40.8% · R 57.3% · Other 1.9%
- 2008→2024 swing
- -15.1pp toward R · 2008: -1.4pp · 2024: -16.4pp
- All cycles
- 2024: R+16.4 2020: R+14.8 2016: R+18.0 2012: R+3.0 2008: R+1.4
Not yet ingested
- Civics
- —
Market trends
- HPI YoY
- ▼ -97.16%
- Current HPI
- 247.9899
- Rent YoY
- —
- Metro
- Red Wing, MN
- State GDP YoY
- ▲ 2.41%
- F500 in state
- 34
Industry mix (Fortune 500 HQ in MN)
| Industry | F500 HQs | Revenue |
|---|---|---|
| Healthcare | 2 | $407B |
|
||
| Retail | 2 | $150B |
|
||
| Consumer Goods | 2 | $32B |
|
||
| Industrial Machinery | 2 | $6B |
|
||
| Agriculture | 1 | $40B |
|
||
| Healthcare / Medical Devices | 1 | $32B |
|
||
Price history
+114.7% since first listed6 events — show timeline
- 2026-06-12 Listed $150,000 NORTHSTARMLS as Distributed by MLS Grid
- 2026-06-10 Coming Soon $150,000 NORTHSTARMLS as Distributed by MLS Grid
- 1998-09-25 Sold (Public Records) $65,000 Public Records
- 1998-09-25 Sold (MLS) $65,000 NORTHSTARMLS as Distributed by MLS Grid
- 1998-09-02 Listing Removed — NORTHSTARMLS as Distributed by MLS Grid
- 1998-05-20 Listed $69,850 NORTHSTARMLS as Distributed by MLS Grid
Property tax history
+4.3%/yrLatest (2025): $2,016 · -3.2% YoY. Source: county tax records.
Cash-flow waterfall
monthlySold comps — $/sqft
last 12 mo · ≤1 miLoading sold comps…