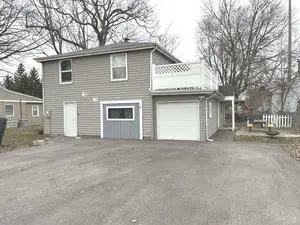
2604 Fair Oak Ln · McHenry, IL
Flood risk 3/10 · Minor
- FEMA flood zone
- X (unshaded)
- Chance of flooding over 30 yrs
- 0.12%
- Est. flood insurance / yr
- $507 – $1,088
Fire risk 2/10 · Minimal
- Est. fire insurance / yr
- $804 – $1,492
Heat risk 2/10 · Minimal
- Hot days now (above 100°F)
- 7 days/yr
- Hot days in 30 yrs
- 14 days/yr
Wind risk 2/10 · Minimal
- Chance of severe wind over 30 yrs
- —
Air-quality risk 2/10 · Minimal
- Unhealthy air days now
- 1 days/yr
- Unhealthy air days in 30 yrs
- 2 days/yr
Risk factors via First Street. Map © Google.
Why this score? — see what drove the D- grade
The composite is a weighted blend of 9 inputs, each scored 0–100. Each bar is that input's sub-score; the figure is the points it added to the 100-point composite (weight × sub-score).
- Appreciation +10.0/10.0
- Cash flow +8.2/30.0
- Livability +3.8/5.0
- 1% rule +2.9/10.0
- Schools +2.7/10.0
- Rent growth +2.5/5.0
- Condition / age +2.5/5.0
- DSCR +2.2/10.0
- ARV discount +2.2/15.0
$269,900
🖨 Deal sheet 📄 Offer letter ✓ Due diligence
Listing remarks
Totally upgraded two-unit property in a beautiful location near Chain O'Lakes. IT HAS BEEN CONTINUALLY RENOVATED SINCE THE TIME OF PURCHASE. A septic and private well were made in 2009. FURNACE (2015), AC UNIT (2015), ELECTRICAL AND PLUMBING 2014, WATER HEATER 2021, BOTH APARTMENTS WERE RENOVATED. FIRST FLOOR - COMMON AREA LAUNDRY. LARGE BEAUTIFUL 2ND FLOOR TERRACE. ENLARGED DRIVEWAY AT FRONT AND MUCH MORE. One car garage.
Key facts
- Large balcony
- Private entrance
- Two story home
Tags
Property features AI
Finance
- Other: Parcel number 0936331020
- Financial info: Special service area: No; Property is a two-unit building with reported rents (unit 1: $1,675; unit 2: $1,600) and security deposits (~$1,600)
Exterior
- Parking: Attached garage owned (1 garage space); Total of 3 parking spaces
- Utilities: Well water; Septic tank sewer
- Home design: Two- to four-unit property; Fee simple ownership; Rehab completed in 2014; Built approximately 81–90 years ago; Built before 1978; Unincorporated location
- Construction: Vinyl siding exterior
- Exterior features: Lot dimensions approximately 84 x 76; Lot is less than 0.25 acre; School bus service noted
Interior
- Kitchen: Each unit includes a stove and refrigerator
- Bedrooms: 4 bedrooms (2 on first and second floor units: each unit has 2 bedrooms)
- Bathrooms: 2 full bathrooms (1 in each unit)
- Heating & cooling: Natural gas forced air heating
- Interior features: 9 total rooms; School bus service available
Neighborhood map
What this means for you Summary
Snapshot
- This is a 2-bed/2.0-bath single-family listed at $270k.
Deal economics
- At list price, monthly cash flow is $-253 ($-3k/yr) — negative.
- To cash-flow at today's rent, offer at most $225k (16.6% below list).
- To meet the 1% rule (rent ≥ 1% of price), the offer needs to be $214k (20.6% below list).
- Recommended offer: $214k (20.6% below list) — sets the bar for 1% rule.
- Cap rate 5.2% vs local median 3.6% in McHenry — top-decile yield for the area; either an underpriced asset or a hidden risk that comps aren't pricing in. Stress-test before assuming the spread holds.
Location & tenants
- Location reads 76/100 on livability (#205 in IL, #3,749 nationally) — a middle-class / working-renter tenant base. Strengths: crime A+, housing A+, health & safety A+; Watch: schools D+, amenities D-, commute F.
- Mchenry Chsd 156 (suburban): math 27% / reading 30% proficiency, ranked #244 of 620 in IL (top 39%) — low school quality limits family demand, transient renter base, plan for 1-2y turnover.
- Market conditions: 152 active listings in the ZIP; 8 comparable units currently listed for rent nearby; rentals at typical pace (median 22d on market — plan ~3-4 weeks tenant-placement turnaround); 1,595 units permitted in McHenry County in 2024 (485 in 5+ unit buildings).
Forward outlook
- In year one you build about $29k of equity ($2k loan paydown + $27k appreciation (10.0% local appreciation)).
- McHenry County population projected at -12% by 2050 — secular population decline; favor cash flow + early exit over multi-decade hold.
- By year 2, paydown + projected appreciation supports a ~$46k cash-out refi (75% LTV) — recoverable capital for the next deal without selling this one.
Negotiation context
- Only 1 days on market — expect competitive offers; lowballing is unlikely to land.
- 5 sale attempts since 13y ago with the ask held roughly flat each time — persistent listings suggest the price (not the market) is what's stuck; bring a comps-based counter.
- Current owner paid $38k; list at $270k implies a 610% gain — meaningful room to come down on a strong offer.
Risks & watch-outs
- Watch-outs: built in 1945 — expect roof / HVAC / electrical / plumbing capex.
Questions for the listing agent
- What do current leases actually rent for vs. the listed asking? Can we see a recent rent roll and the last 12 months of T-12 income?
- Built in 1945 — when were the roof, HVAC, electrical panel, plumbing, and water heater last replaced?
- Is there a deadline driving the sale (1031 exchange, divorce, estate, relocation)? That informs how much negotiation room exists.
- Schools are D-rated, which usually means shorter tenancies and higher turnover. Who's the typical renter profile here, and what's been the actual vacancy rate?
- The area grade is low — what's the realistic commute time and amenity access for the typical tenant pool here? Any planned neighborhood developments (good or bad) we should know about?
- What's the average days-on-market for RENTAL listings here right now (not sales)? A rising rental-DOM trend means longer vacancies and softer asking-rent achievability than the comps imply.
- What's the recent tenant-quality profile in this submarket — average credit score on applications, eviction rate, late-payment / NSF rate, and stable-employment percentage? A property-management company in the area should have these aggregated.
- How much new for-sale + rental construction is in the pipeline within 1–3 miles? Heavy new supply typically softens prices + rents 12–24 months out; constrained supply supports both.
Investment metrics
- 1% rule
- 0.79% ✗
- Cap rate
- 5.17%
- Cash-on-cash
- -4.02%
- DSCR
- 0.82
- GRM
- 10.5
CMA / ARV
- ARV (on-the-fly)
- $241,392
- Comps found
- 5
Show comp detail 5 sales within ~0.75 mi
| Address | Dist | Beds/Ba | Sqft | Sold | Price | $/sf | Match |
|---|---|---|---|---|---|---|---|
| 2917 Virginia Ave | 0.43mi | 2/1.0 | 1,436 (+12%) | 1mo | $270,000 | $188 | 55 |
| 3103 Charlotte Ave | 0.60mi | 3/1.0 (+1) | 1,286 (+0%) | 20mo | $215,000 | $167 | 46 |
| 3320 W Skyway Dr | 0.74mi | 3/2.0 (+1) | 1,344 (+5%) | 11mo | $279,900 | $208 | 44 |
| 3102 Victoria Ave | 0.58mi | 3/1.0 (+1) | 1,191 (-7%) | 13mo | $180,000 | $151 | 41 |
| 3216 Golfview Rd | 0.72mi | 2/1.0 | 1,366 (+6%) | 16mo | $265,000 | $194 | 38 |
Match score weights: distance 35% · size 25% · config 20% · recency 20%. Top-matched comps best support the ARV.
Projected returns pro-forma
10.0% appreciation · 3.0% rent growth · sell at horizon
- IRR
- 21.4%
- Equity multiple
- 2.73×
- Total profit
- $130,933
- Equity at exit
- $243,147
- IRR
- 19.4%
- Equity multiple
- 6.27×
- Total profit
- $398,434
- Equity at exit
- $524,356
Cash invested: $75,572 (down + closing). Projections, not guarantees.
Landlord ↔ Tenant lean methodology
- Overall (STATE)
- 43 Moderately Tenant-Leaning
- State Illinois
- 43 Moderately Tenant-Leaning · D+7
- County
- — inherits STATE
- City
- — inherits STATE
ZIP-level market 60051
- Home prices YoY
- 4.9%
- Active inventory
- 152
- Price-to-rent
- 10.5×
Monthly cashflow live
- Estimated rent
- $2,142 high interval (Pro) →
- Mortgage (P&I)
- −$1,415
- Tax from tax record
- −$418 /mo · $5,016/yr
- Insurance
- −$112
- HOA
- −$0
- Vacancy / Maint / Mgmt
- −$450
- Net cashflow
- $-253
Break-even live
UW: 25.0% down · 7.5% · 30yr · 1.5% tax · 5.0% vac · 8.0% maint · 8.0% mgmt
Financing live
Cash to close
- Down payment
- $67,475
- Closing costs
- $8,097
- Reserves months
- —
- Total cash needed
- —
Loan-product check · same deal, 3 products live
Conventional
25% down · 7.5% · 30yr
- Down + closing
- —
- Monthly P&I
- —
- Monthly cashflow
- —
- DSCR
- —
- Eligible?
- —
Personal DTI + credit; lowest rate.
DSCR
20% down · 8.5% · 30yr
- Down + closing
- —
- Monthly P&I
- —
- Monthly cashflow
- —
- DSCR
- —
- Eligible?
- —
No personal income docs; deal must DSCR.
Hard money
10% down · 12.0% · 12mo
- Down + closing
- —
- Monthly P&I
- —
- Monthly cashflow
- —
- DSCR
- —
- Eligible?
- —
Short-term bridge; refi at stabilization.
Rent comps 8 comps
| Address | Beds | Baths | Sqft | Rent | $/sqft | DOM | Units | Dist |
|---|---|---|---|---|---|---|---|---|
| 2610 S Elmkirk Park McHenry, IL | 3.0 | 1.0 | 1000 | $2,200 | $2.20 | 24d | 1 | 0.20mi |
| 2612 S Elmkirk Park McHenry, IL | 3.0 | 1.0 | 960 | $2,200 | $2.29 | 24d | 1 | 0.20mi |
| 3102 Victoria Ave McHenry, IL | 3.0 | 1.0 | 1191 | $2,400 | $2.02 | 3d | 1 | 0.57mi |
| 1010 Osage Dr McHenry, IL | 2.0 | 1.0 | 1100 | $2,000 | $1.82 | 22d | 1 | 1.20mi |
| 3317 Pearl St McHenry, IL | 3.0 | 2.0 | 1750 | $2,150 | $1.23 | 1d | 1 | 1.20mi |
| 3317 Pearl St Unit NA McHenry, IL | 3.0 | 2.0 | 1750 | $2,150 | $1.23 | 3d | 1 | 1.20mi |
| 902 3rd St Unit 1 McHenry, IL | 2.0 | 1.5 | 1000 | $1,600 | $1.60 | 24d | 1 | 1.28mi |
| 913 3rd St Unit 907 McHenry, IL | 2.0 | 1.0 | 900 | $1,325 | $1.47 | 12d | 1 | 1.32mi |
Listing history 31 events
-
2026-06-18statusdays on market $269,900 Active 1 DOM
-
2026-06-18days on market $269,900 Temporarily No Showings 65 DOM
-
2026-06-17days on market $269,900 Temporarily No Showings 64 DOM
-
2026-06-16days on market $269,900 Temporarily No Showings 63 DOM
-
2026-06-15days on market $269,900 Temporarily No Showings 62 DOM
-
2026-06-13days on market $269,900 Temporarily No Showings 60 DOM
-
2026-06-13days on market $269,900 Temporarily No Showings 59 DOM
-
2026-06-09days on market $269,900 Temporarily No Showings 56 DOM
-
2026-06-08days on market $269,900 Temporarily No Showings 55 DOM
-
2026-06-07days on market $269,900 Temporarily No Showings 54 DOM
-
2026-06-04statusdays on market $269,900 Temporarily No Showings 51 DOM
-
2026-06-03days on market $269,900 Active 50 DOM
-
2026-06-02days on market $269,900 Active 49 DOM
-
2026-06-01days on market $269,900 Active 48 DOM
-
2026-05-31days on market $269,900 Active 47 DOM
-
2026-04-14$269,900 Active
-
2021-09-22status Active Under Contract (Do Not Show)
-
2021-09-22historical
-
2021-09-15Active
-
2021-09-15historical
-
2021-09-01status Temporarily No Showings
-
2021-08-06status Active Under Contract
-
2021-07-29Active
-
2014-01-10soldstatus $38,000 Closed Sale
-
2013-12-23historical Contingent
-
2013-12-10price $44,900 Price Change
-
2013-11-07price $49,900 Price Change
-
2013-10-08price $54,900 Price Change
-
2013-09-05price $59,900 Price Change
-
2013-08-01$74,900 New
-
2006-06-09soldstatus $139,500
ⓘ Source: listings_history table (triggers on properties + properties_extension) + one-shot
backfill from property_details.listing_events for pre-trigger history.
Tax reassessment forecast IL · Partial reset (capped growth)
- Current annual tax
- $5,016 · $418/mo
- Projected year-2 tax
- $5,572 · $464/mo
- Expected delta
- +$555/yr (+$46/mo · 11.1%)
ⓘ Screening estimate from a state-policy table — verify with the county assessor before closing.
Climate risk First Street
- Flood 3/10 Moderate FEMA zone X (unshaded) · 12% chance over 30 yrs
- Wildfire 2/10 Low
- Heat 2/10 Low 7 d/yr ≥100°F today · 14 d/yr by 30 yrs out
- Wind 2/10 Low
- Air quality 2/10 Low 1 unhealthy d/yr today · 2 by 30 yrs out
Nearby sold comps map
Loading sold comps map…
Walkable amenities ~0.75 mi
Loading nearby amenities…
Taxation est. · year 1
- Rental income
- $25,707
- − Mortgage interest
- −$15,119
- − Property taxes
- −$5,016
- − Insurance
- −$1,350
- − Repairs & maintenance
- −$2,057
- − Management
- −$2,057
- − Depreciation
- −$7,852
- Taxable loss
- −$7,742
- Est. tax savings @ 24.0%
- +$1,858
- After-tax cash flow
- $-1,184/yr
For passive investors: Depreciation is non-cash, so a rental often shows a tax loss while cash-flowing — sheltering income. Rental losses are passive: they offset passive income freely, and up to $25,000/yr can offset ordinary (W-2) income if you actively participate and your MAGI is under $100k (phasing out to $0 by $150k); unused losses carry forward. On sale, claimed depreciation is recaptured at up to 25%, and gains may owe capital-gains tax (a 1031 exchange can defer both). Figures are a year-1 estimate at your 24.0% rate — not tax advice; consult a CPA.
Schools (NCES district)
- District
- Mchenry Chsd 156
- NCES district ID
- 1725320
- Math proficiency
- 27% ▼ -7.00%
- Reading proficiency
- 30% ▼ -7.00%
- Median HH income
- $66,681
- Composite
- 26.55/100
- National rank
- #7188
- State rank
- #244 of 620 in IL
Livability — McHenry
- Score
- 76/100
- State rank
- #205
- US rank
- #3749
Category grades
Schools grade is shown separately in the Schools card above.
Census & demographics
- City population
- 31,781
- Population (ZIP)
- 23,931
Population outlook (McHenry County) Hauer SSP2
- Today (2025)
- 305,342 people
- By 2030
- 301,491 · -1.3%
- By 2040
- 288,211 · -5.6%
- By 2050
- 268,430 · -12.1%
- By 2075
- 226,209 · -25.9%
- By 2100
- 181,247 · -40.6%
Race, ethnicity, and origin ACS 2023
- Neighborhood character
- Predominantly White (84%)
- Race & ethnicity
- White 84% Hispanic / Latino 10% Two or more races 6% Asian 2%
- Hispanic origin (detail)
- Mexican 8%
- Common ancestry
- Romanian 12% Slovak 2% Lithuanian 2%
- Foreign-born
- 5% · Canada
- Languages at home
- 92% English-only · Spanish 5% Other Indo-European 2% Russian/Polish/Slavic 1%
Political lean MEDSL · McHenry
- 2024 margin
- Lean R (+5.3) · D 46.6% · R 51.9% · Other 1.5%
- 2008→2024 swing
- -10.6pp toward R · 2008: 5.3pp · 2024: -5.3pp
- All cycles
- 2024: R+5.3 2020: R+2.5 2016: R+8.1 2012: R+8.8 2008: D+5.3
Not yet ingested
- Civics
- —
Market trends
- HPI YoY
- ▲ 28.50%
- Current HPI
- 612.07
- Rent YoY
- —
- Metro
- —
- State GDP YoY
- ▲ 1.59%
- F500 in state
- 60
Industry mix (Fortune 500 HQ in IL)
| Industry | F500 HQs | Revenue |
|---|---|---|
| Insurance | 4 | $201B |
|
||
| Consumer Goods | 4 | $87B |
|
||
| Industrial Machinery | 3 | $64B |
|
||
| Healthcare | 2 | $55B |
|
||
| Retail / Pharmacy | 1 | $148B |
|
||
| Agriculture / Food | 1 | $86B |
|
||
Price history
+93.5% since first listed16 events — show timeline
- 2026-04-14 Listed $269,900 MRED as Distributed by MLS Grid
- 2021-09-22 Pending — MRED as Distributed by MLS Grid
- 2021-09-22 Listing Removed — MRED as Distributed by MLS Grid
- 2021-09-15 Listing Removed — MRED as Distributed by MLS Grid
- 2021-09-15 Listed — MRED as Distributed by MLS Grid
- 2021-09-01 Relisted — MRED as Distributed by MLS Grid
- 2021-08-06 Pending — MRED as Distributed by MLS Grid
- 2021-07-29 Listed — MRED as Distributed by MLS Grid
- 2014-01-10 Sold (MLS) $38,000 MRED as Distributed by MLS Grid
- 2013-12-23 Contingent — MRED as Distributed by MLS Grid
- 2013-12-10 Price Changed $44,900 MRED as Distributed by MLS Grid
- 2013-11-07 Price Changed $49,900 MRED as Distributed by MLS Grid
- 2013-10-08 Price Changed $54,900 MRED as Distributed by MLS Grid
- 2013-09-05 Price Changed $59,900 MRED as Distributed by MLS Grid
- 2013-08-01 Listed $74,900 MRED as Distributed by MLS Grid
- 2006-06-09 Sold (Public Records) $139,500 Public Records
Property tax history
+4.4%/yrLatest (2024): $5,016 · +2.4% YoY. Source: county tax records.
Cash-flow waterfall
monthlySold comps — $/sqft
last 12 mo · ≤1 miLoading sold comps…