1545 E El Rodeo Rd Lot 142 · Fort Mohave, AZ
Flood risk 1/10 · Minimal
- FEMA flood zone
- X (unshaded)
- Chance of flooding over 30 yrs
- 0.0%
- Est. flood insurance / yr
- $507 – $1,088
Fire risk 4/10 · Minor
- Est. fire insurance / yr
- $610 – $1,132
Heat risk 9/10 · Severe
- Hot days now (above 116°F)
- 7 days/yr
- Hot days in 30 yrs
- 16 days/yr
Wind risk 1/10 · Minimal
- Chance of severe wind over 30 yrs
- —
Air-quality risk 1/10 · Minimal
- Unhealthy air days now
- 0 days/yr
- Unhealthy air days in 30 yrs
- 0 days/yr
Risk factors via First Street. Map © Google.
Why this score? — see what drove the D+ grade
The composite is a weighted blend of 9 inputs, each scored 0–100. Each bar is that input's sub-score; the figure is the points it added to the 100-point composite (weight × sub-score).
- Cash flow +21.1/30.0
- DSCR +6.7/10.0
- 1% rule +5.6/10.0
- Livability +3.2/5.0
- Rent growth +2.5/5.0
- Condition / age +2.5/5.0
- ARV discount +2.3/15.0
- Schools +1.3/10.0
- Appreciation +0.0/10.0
$164,000
🖨 Deal sheet 📄 Offer letter ✓ Due diligence
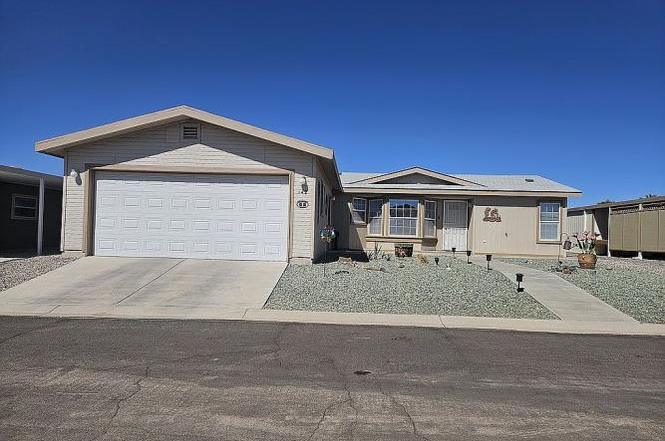
Listing remarks
Ready for retirement or looking to downsize. ? We have the perfect place for you. This 1300 sf 3 bedrooms, 2 bath manufactured home is waiting for you. Built in 2003. This home is located in Arrowhead Ranch 1545 E El Rodeo Road, on Lot 142, Fort Mohave, AZ. Just minutes from shopping, dining, and top-rated medical facilities. The home is a rare find, featuring a double car garage, with a protentinal workshop and plenty of storage room. This home, comes fully furnished. It has some new appliances including new AC unit installed Nov 2021. Vaulted ceilings, with ceiling fans, and skylights. In home laundry room with a fully enclosed large Arizona room, that extends the full length of the home.
Key facts
- New ac unit
- Double car garage
- Manufactured home
Tags
Neighborhood map
What this means for you Summary
Snapshot
- This is a 3-bed/2.0-bath manufactured listed at $164k.
Deal economics
- At list price, monthly cash flow is $235 ($3k/yr) — positive.
- The deal already cash-flows at list — no discount required.
- Meets the 1% rule at list price ($2k rent vs $164k).
- Recommended offer: $144k (12.0% below list) — sets the bar for market timing.
- Cap rate 8.0% vs local median 4.2% in Fort Mohave — top-decile yield for the area; either an underpriced asset or a hidden risk that comps aren't pricing in. Stress-test before assuming the spread holds.
Location & tenants
- Location reads 65/100 on livability (#88 in AZ) — a middle-class / working-renter tenant base. Strengths: cost of living A+, housing A+; Watch: employment C-, health & safety C-, crime D+.
- Colorado River Union High School District (4381) (town): math 13% / reading 17% proficiency, ranked #213 of 249 in AZ (top 86%) — low school quality limits family demand, transient renter base, plan for 1-2y turnover.
- Market conditions: 376 active listings in the ZIP; 7 comparable units currently listed for rent nearby; rentals leasing fast (median 14d on market — plan ~1-2 weeks tenant-placement turnaround); 2,543 units permitted in Mohave County in 2024 (33 in 5+ unit buildings).
- This rent runs 32% of the median local income ($65k/yr) — at the standard rent-burdened threshold; future hikes will face affordability resistance.
Forward outlook
- Local home prices are declining (-3.0%/yr); year-one equity from $1k of loan paydown is wiped out by about $5k of value loss. Plan a longer hold.
- Mohave County population projected to shrink 6% by 2050 — rents likely to lag national; underwrite the cash flow, not the appreciation.
Negotiation context
- It's been on market 235 days — a 12% lower offer ($144k) is reasonable based on typical stale-listing flexibility.
Risks & watch-outs
- Climate carrying-cost: extreme-heat days projected 7→16/yr by 2055 (HVAC capex compounding) — expect insurance premiums to compound above CPI over the hold.
Questions for the listing agent
- It's been on market 235 days. Have you received any prior offers? Is the seller open to a 12% concession, seller financing, or rate buy-down credit?
- Why hasn't it sold? Are there any deal-killer items the seller is aware of (foundation, flood, title, zoning, code violations)?
- Is there a deadline driving the sale (1031 exchange, divorce, estate, relocation)? That informs how much negotiation room exists.
- Schools are F-rated, which usually means shorter tenancies and higher turnover. Who's the typical renter profile here, and what's been the actual vacancy rate?
- Crime grade is D in this area — have there been break-ins, vandalism, or insurance claims at this property in the last 3 years? What carrier currently insures it and at what premium?
- The area grade is low — what's the realistic commute time and amenity access for the typical tenant pool here? Any planned neighborhood developments (good or bad) we should know about?
- What's the average days-on-market for RENTAL listings here right now (not sales)? A rising rental-DOM trend means longer vacancies and softer asking-rent achievability than the comps imply.
- What's the recent tenant-quality profile in this submarket — average credit score on applications, eviction rate, late-payment / NSF rate, and stable-employment percentage? A property-management company in the area should have these aggregated.
- How much new for-sale + rental construction is in the pipeline within 1–3 miles? Heavy new supply typically softens prices + rents 12–24 months out; constrained supply supports both.
Investment metrics
- 1% rule
- 1.06% ✓
- Cap rate
- 8.01%
- Cash-on-cash
- 6.13%
- DSCR
- 1.27
- GRM
- 7.9
CMA / ARV
- ARV (on-the-fly)
- $146,900
- Comps found
- 12
Show comp detail 12 sales within ~0.75 mi
| Address | Dist | Beds/Ba | Sqft | Sold | Price | $/sf | Match |
|---|---|---|---|---|---|---|---|
| 1545 E El Rodeo Rd #59 | 0.05mi | 3/2.0 | 1,300 (0%) | 14mo | $160,000 | $123 | 86 |
| 1545 E El Rodeo Rd #72 | 0.04mi | 2/2.0 (-1) | 1,248 (-4%) | 5mo | $100,000 | $80 | 82 |
| 1545 El Rodeo Rd #167 | 0.18mi | 3/2.0 | 1,300 (0%) | 11mo | $129,900 | $100 | 82 |
| 1545 E El Rodeo Rd #106 | 0.05mi | 3/2.0 | 1,344 (+3%) | 12mo | $185,000 | $138 | 82 |
| 1545 E El Rodeo Rd #48 | 0.18mi | 2/2.0 (-1) | 1,326 (+2%) | 4mo | $137,900 | $104 | 80 |
| 4884 S Baronsgate Way | 0.21mi | 3/2.0 | 1,238 (-5%) | 4mo | $249,900 | $202 | 79 |
| 1545 E El Rodeo Rd #112 | 0.18mi | 2/2.0 (-1) | 1,352 (+4%) | 5mo | $135,000 | $100 | 75 |
| 1545 E El Rodeo Rd #23 | 0.05mi | 2/2.0 (-1) | 1,200 (-8%) | 14mo | $84,000 | $70 | 68 |
| 1545 El Rodeo Rd #64 | 0.18mi | 2/2.0 (-1) | 1,240 (-5%) | 15mo | $105,000 | $85 | 66 |
| 1545 E El Rodeo Rd Lot 18 | 0.18mi | 2/2.0 (-1) | 1,188 (-9%) | 10mo | $156,750 | $132 | 64 |
| 1545 E El Rodeo Rd #11 | 0.05mi | 3/2.0 | 1,493 (+15%) | 12mo | $168,000 | $113 | 62 |
| 5150 S El Ganadero Dr | 0.72mi | 3/2.0 | 1,224 (-6%) | 13mo | $242,500 | $198 | 46 |
Match score weights: distance 35% · size 25% · config 20% · recency 20%. Top-matched comps best support the ARV.
Projected returns pro-forma
-3.0% appreciation · 3.0% rent growth · sell at horizon
- IRR
- -6.8%
- Equity multiple
- 0.75×
- Total profit
- $-11,597
- Equity at exit
- $24,453
- IRR
- 2.8%
- Equity multiple
- 1.20×
- Total profit
- $9,261
- Equity at exit
- $14,180
Cash invested: $45,920 (down + closing). Projections, not guarantees.
Landlord ↔ Tenant lean methodology
- Overall (STATE)
- 87 Strongly Landlord-Friendly
- State Arizona
- 87 Strongly Landlord-Friendly · R+3
- County
- — inherits STATE
- City
- — inherits STATE
ZIP-level market 86426
- Home prices YoY
- -5.2%
- Active inventory
- 376
- Price-to-rent
- 7.9×
Monthly cashflow live
- Estimated rent
- $1,732 high interval (Pro) →
- Mortgage (P&I)
- −$860
- Tax est. 1.5%
- −$205 /mo · $2,460/yr
- Insurance
- −$68
- HOA
- −$0
- Vacancy / Maint / Mgmt
- −$364
- Net cashflow
- $235
Break-even live
UW: 25.0% down · 7.5% · 30yr · 1.5% tax · 5.0% vac · 8.0% maint · 8.0% mgmt
Financing live
Cash to close
- Down payment
- $41,000
- Closing costs
- $4,920
- Reserves months
- —
- Total cash needed
- —
Loan-product check · same deal, 3 products live
Conventional
25% down · 7.5% · 30yr
- Down + closing
- —
- Monthly P&I
- —
- Monthly cashflow
- —
- DSCR
- —
- Eligible?
- —
Personal DTI + credit; lowest rate.
DSCR
20% down · 8.5% · 30yr
- Down + closing
- —
- Monthly P&I
- —
- Monthly cashflow
- —
- DSCR
- —
- Eligible?
- —
No personal income docs; deal must DSCR.
Hard money
10% down · 12.0% · 12mo
- Down + closing
- —
- Monthly P&I
- —
- Monthly cashflow
- —
- DSCR
- —
- Eligible?
- —
Short-term bridge; refi at stabilization.
Rent comps 7 comps
| Address | Beds | Baths | Sqft | Rent | $/sqft | DOM | Units | Dist |
|---|---|---|---|---|---|---|---|---|
| 1579 E Courtney Pl Fort Mohave, AZ | 2.0 | 2.0 | 948 | $999 | $1.05 | 13d | 1 | 0.16mi |
| 5080 S La Calzada Dr Fort Mohave, AZ | 2.0 | 1.0 | 900 | $1,150 | $1.28 | 13d | 1 | 0.31mi |
| 5085 S Jacaranda Pl Fort Mohave, AZ | 3.0 | 2.0 | 1200 | $1,750 | $1.46 | 13d | 1 | 0.37mi |
| 4783 S Whitegate Pl Fort Mohave, AZ | 3.0 | 2.0 | 1448 | $2,100 | $1.45 | 13d | 1 | 0.40mi |
| 4658 S Reyes Adobe Dr Fort Mohave, AZ | 3.0 | 2.0 | 1600 | $2,400 | $1.50 | 13d | 1 | 0.54mi |
| 4272 El Toro Dr Fort Mohave, AZ | 3.0 | 2.0 | 1349 | $1,500 | $1.11 | 13d | 1 | 1.30mi |
| 1933 E Leisure Ln Fort Mohave, AZ | 2.0 | 2.0 | 1370 | $1,500 | $1.09 | 13d | 1 | 1.36mi |
Listing history 17 events
-
2026-06-18days on market $164,000 Active 235 DOM
-
2026-06-17days on market $164,000 Active 234 DOM
-
2026-06-16days on market $164,000 Active 233 DOM
-
2026-06-15days on market $164,000 Active 232 DOM
-
2026-06-14days on market $164,000 Active 230 DOM
-
2026-06-13days on market $164,000 Active 229 DOM
-
2026-06-10days on market $164,000 Active 227 DOM
-
2026-06-09days on market $164,000 Active 226 DOM
-
2026-06-08days on market $164,000 Active 225 DOM
-
2026-06-07days on market $164,000 Active 224 DOM
-
2026-06-05days on market $164,000 Active 221 DOM
-
2026-06-03days on market $164,000 Active 220 DOM
-
2026-06-02days on market $164,000 Active 219 DOM
-
2026-06-01days on market $164,000 Active 218 DOM
-
2026-05-31days on market $164,000 Active 217 DOM
-
2026-05-30days on market $164,000 Active 216 DOM
-
2025-10-22$164,000 Active
ⓘ Source: listings_history table (triggers on properties + properties_extension) + one-shot
backfill from property_details.listing_events for pre-trigger history.
Climate risk First Street
- Flood 1/10 Low FEMA zone X (unshaded) · 0% chance over 30 yrs
- Wildfire 4/10 Moderate
- Heat 9/10 Extreme 7 d/yr ≥116°F today · 16 d/yr by 30 yrs out
- Wind 1/10 Low
- Air quality 1/10 Low 0 unhealthy d/yr today · 0 by 30 yrs out
Nearby sold comps map
Loading sold comps map…
Walkable amenities ~0.75 mi
Loading nearby amenities…
Taxation est. · year 1
- Rental income
- $20,782
- − Mortgage interest
- −$9,187
- − Property taxes
- −$2,460
- − Insurance
- −$820
- − Repairs & maintenance
- −$1,663
- − Management
- −$1,663
- − Depreciation
- −$4,771
- Taxable income
- $219
- Est. tax owed @ 24.0%
- −$53
- After-tax cash flow
- $2,765/yr
For passive investors: Depreciation is non-cash, so a rental often shows a tax loss while cash-flowing — sheltering income. Rental losses are passive: they offset passive income freely, and up to $25,000/yr can offset ordinary (W-2) income if you actively participate and your MAGI is under $100k (phasing out to $0 by $150k); unused losses carry forward. On sale, claimed depreciation is recaptured at up to 25%, and gains may owe capital-gains tax (a 1031 exchange can defer both). Figures are a year-1 estimate at your 24.0% rate — not tax advice; consult a CPA.
Schools (NCES district)
- District
- Colorado River Union High School District (4381)
- NCES district ID
- 0400082
- Math proficiency
- 13% ▼ -17.00%
- Reading proficiency
- 17% ▼ -18.00%
- Median HH income
- $39,132
- Composite
- 12.72/100
- National rank
- #9603
- State rank
- #213 of 249 in AZ
Livability — Fort Mohave
- Score
- 65/100
- State rank
- #88
- US rank
- #13539
Category grades
Schools grade is shown separately in the Schools card above.
Census & demographics
- Census place
- Fort Mohave, AZ
- County
- Mohave County · 181,906 people
- City population
- 15,467
- Metro
- Lake Havasu City-Kingman, AZ
- Population (ZIP)
- 15,467
- Household income
- $64,551
- Rent vs Own
- Severe rent burden
- 207.0
Population outlook (Mohave County) Hauer SSP2
- Today (2025)
- 209,184 people
- By 2030
- 209,674 · +0.2%
- By 2040
- 205,897 · -1.6%
- By 2050
- 196,810 · -5.9%
- By 2075
- 169,454 · -19.0%
- By 2100
- 136,630 · -34.7%
Race, ethnicity, and origin ACS 2023
- Neighborhood character
- Predominantly White (73%)
- Race & ethnicity
- White 73% Hispanic / Latino 18% Two or more races 8% Asian 4%
- Hispanic origin (detail)
- Mexican 14%
- Common ancestry
- Lithuanian 3% Romanian 2% Italian 1%
- Foreign-born
- 7% · Canada
- Languages at home
- 88% English-only · Spanish 7% Tagalog/Filipino 2% Other Asian/Pacific 1%
Political lean MEDSL · Mohave
- 2024 margin
- Solid R (+55.8) · D 21.8% · R 77.6%
- 2008→2024 swing
- -22.9pp toward R · 2008: -32.9pp · 2024: -55.8pp
- All cycles
- 2024: R+55.8 2020: R+51.3 2016: R+51.5 2012: R+42.6 2008: R+32.9
Not yet ingested
- Civics
- —
Market trends
- HPI YoY
- ▼ -15.22%
- Current HPI
- 278.7975
- Rent YoY
- —
- Metro
- Lake Havasu City-Kingman, AZ
- State GDP YoY
- ▲ 4.54%
- F500 in state
- 20
Industry mix (Fortune 500 HQ in AZ)
| Industry | F500 HQs | Revenue |
|---|---|---|
| Technology | 2 | $13B |
|
||
| Mining / Metals | 1 | $23B |
|
||
| Environmental Services | 1 | $16B |
|
||
| Metals / Steel | 1 | $14B |
|
||
| Technology Distribution | 1 | $9B |
|
||
| Homebuilding | 1 | $8B |
|
||
Price history
1 event — show timeline
- 2025-10-22 Listed $164,000 Fizber.com
Cash-flow waterfall
monthlySold comps — $/sqft
last 12 mo · ≤1 miLoading sold comps…