13 A Battery Walk Ct Ct · St. Andrews, SC
Flood risk 1/10 · Minimal
- FEMA flood zone
- X (unshaded)
- Chance of flooding over 30 yrs
- 0.0%
- Est. flood insurance / yr
- $507 – $1,088
Fire risk 3/10 · Minor
- Est. fire insurance / yr
- $783 – $1,453
Heat risk 6/10 · Moderate
- Hot days now (above 108°F)
- 7 days/yr
- Hot days in 30 yrs
- 16 days/yr
Wind risk 6/10 · Moderate
- Chance of severe wind over 30 yrs
- 58.0%
Air-quality risk 3/10 · Minor
- Unhealthy air days now
- 2 days/yr
- Unhealthy air days in 30 yrs
- 3 days/yr
Risk factors via First Street. Map © Google.
Why this score? — see what drove the C+ grade
The composite is a weighted blend of 9 inputs, each scored 0–100. Each bar is that input's sub-score; the figure is the points it added to the 100-point composite (weight × sub-score).
- Cash flow +27.9/30.0
- DSCR +9.9/10.0
- 1% rule +8.5/10.0
- ARV discount +7.5/15.0
- Schools +2.6/10.0
- Livability +2.5/5.0
- Condition / age +2.5/5.0
- Rent growth +2.4/5.0
- Appreciation +0.0/10.0
$159,900
🖨 Deal sheet 📄 Offer letter ✓ Due diligence
Listing remarks
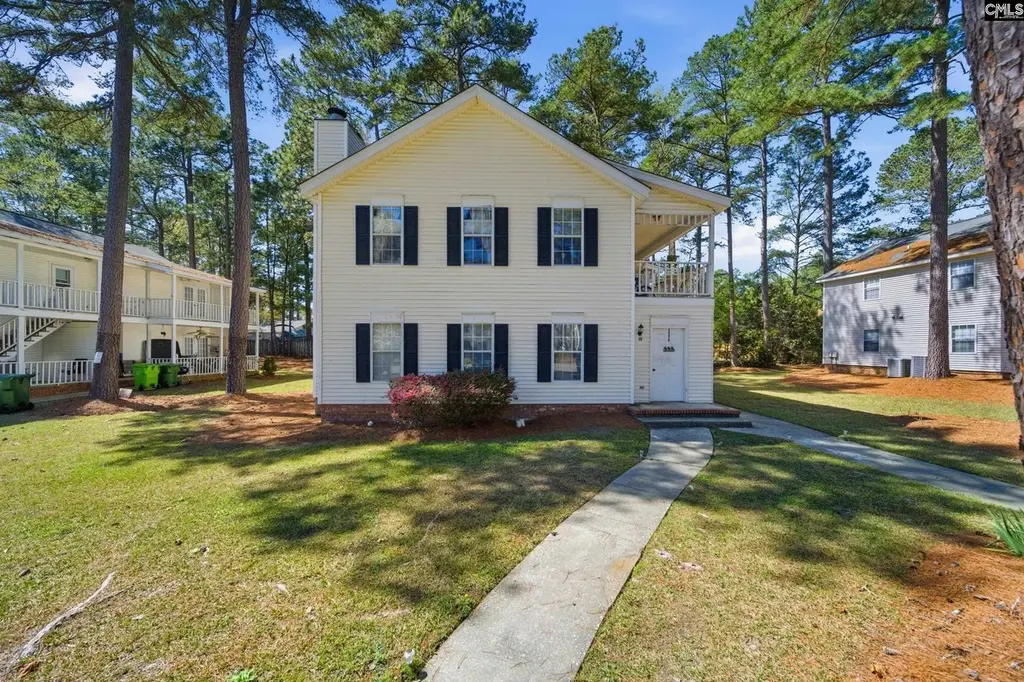
Beautifully Updated 3BR/2BA Condo in Prime Harbison Location Welcome home to this stunning second-level condo, perfectly located near Costco and the Harbison Mall with quick access to shopping, dining, and everyday conveniences. Residents enjoy Harbison Recreation Association amenities, including scenic walking trails and outdoor spaces ideal for an active lifestyle. This spacious home features an open floor plan designed for both comfort and entertaining, plus large covered outdoor porches—perfect for morning coffee or relaxing evenings. The interior offers three bedrooms and two full bathrooms, highlighted by a completely renovated primary bathroom with sleek, modern finishes. Enjoy
Key facts
- Open floor plan
- Wi-fi enabled mirror
- Center island
Tags
Property features AI
Finance
- HOA & community: Has an association; Association maintains front yard
Exterior
- Parking: Two parking spaces
- Utilities: Public water; Public sewer
- Home design: Single-story home
- Construction: Vinyl exterior finish; Slab foundation
- Exterior features: Covered front porch; Covered back porch; Paved road access
Interior
- Kitchen: Eat-in kitchen with island; Pantry; Tile countertops; Tiled backsplash; Microwave (above stove); Free-standing range
- Bedrooms: Master bedroom on the main level with private bath, separate shower and walk-in closet; carpeted floors; Additional bedrooms located on the main level
- Flooring: Luxury vinyl plank flooring in the great room; Carpet in the master bedroom
- Bathrooms: Two full bathrooms (both main level)
- Heating & cooling: Central heating; Central cooling
- Interior features: Built-in features; Wood-burning fireplace
- Laundry & utility: Main-level laundry in a closet within heated space
Neighborhood map
What this means for you Summary
Snapshot
- This is a 6-bed/4.0-bath condo listed at $160k.
Deal economics
- At list price, monthly cash flow is $494 ($6k/yr) — positive.
- The deal already cash-flows at list — no discount required.
- Meets the 1% rule at list price ($2k rent vs $160k).
- Recommended offer: $150k (6.0% below list) — sets the bar for market timing.
Location & tenants
- Location reads: area grade C — affects rentability + tenant quality, not the cash-flow math above.
- Richland 01 (urban): math 26% / reading 36% proficiency, ranked #54 of 80 in SC (top 68%) — families likely to look elsewhere, expect single-tenant / working-renter base with shorter leases; 64% free/reduced lunch — lower-income household profile, screen leases tightly.
- Zoned schools: Pine Grove Elementary (math 24% / reading 15%, grade F, #496 of 597 statewide, top 83%, 541 students, 100% FRL); Columbia High (math 17% / reading 67%, grade F, #174 of 196 statewide, top 90%, 665 students, 100% FRL) — zoned schools average 100% FRL vs 64% district-wide (36 pts higher); higher-poverty schools than district average — tighter screening recommended.
- Market conditions: Rents soft (-0.2%/yr); 206 active listings in the ZIP; solid renter incomes; 3,472 units permitted in Richland County in 2024 (1,096 in 5+ unit buildings).
- This rent runs 34% of the median local income ($77k/yr) — at the standard rent-burdened threshold; future hikes will face affordability resistance.
Forward outlook
- Local home prices are declining (-3.0%/yr); year-one equity from $1k of loan paydown is wiped out by about $5k of value loss. Plan a longer hold.
- Richland County population projected at +30% by 2050 — long-run rental-demand tailwind backs the buy-and-hold thesis.
Negotiation context
- It's been on market 79 days — a 6% lower offer ($150k) is reasonable based on typical stale-listing flexibility.
- Current owner paid $50k; list at $160k implies a 223% gain — meaningful room to come down on a strong offer.
Risks & watch-outs
- Climate carrying-cost: major wind risk, 58% chance of damaging wind over 30y; extreme-heat days projected 7→16/yr by 2055 (HVAC capex compounding) — expect insurance premiums to compound above CPI over the hold.
Questions for the listing agent
- It's been on market 79 days. Have you received any prior offers? Is the seller open to a 6% concession, seller financing, or rate buy-down credit?
- What does the HOA fee cover, when was the last increase, and are there any pending special assessments or reserve-fund shortfalls?
- Any open or pending special assessments — roof, HVAC, plumbing, elevator, façade? What's the per-unit balance and payoff schedule, and is the seller paying it off at close or rolling it to the buyer?
- Why hasn't it sold? Are there any deal-killer items the seller is aware of (foundation, flood, title, zoning, code violations)?
- Is there a deadline driving the sale (1031 exchange, divorce, estate, relocation)? That informs how much negotiation room exists.
- What's the average days-on-market for RENTAL listings here right now (not sales)? A rising rental-DOM trend means longer vacancies and softer asking-rent achievability than the comps imply.
- What's the recent tenant-quality profile in this submarket — average credit score on applications, eviction rate, late-payment / NSF rate, and stable-employment percentage? A property-management company in the area should have these aggregated.
- How much new apartment / multifamily construction is in the pipeline within 1–3 miles? Heavy new supply (>2% of stock underway) typically softens rents 12–24 months out; light construction supports rent growth.
Investment metrics
- 1% rule
- 1.35% ✓
- Cap rate
- 10.00%
- Cash-on-cash
- 13.23%
- DSCR
- 1.59
- GRM
- 6.2
CMA / ARV
No comps found within radius.
Projected returns pro-forma
-3.0% appreciation · 0.0% rent growth · sell at horizon
- IRR
- -0.4%
- Equity multiple
- 0.98×
- Total profit
- $-681
- Equity at exit
- $23,842
- IRR
- 5.6%
- Equity multiple
- 1.35×
- Total profit
- $15,887
- Equity at exit
- $13,825
Cash invested: $44,772 (down + closing). Projections, not guarantees.
Landlord ↔ Tenant lean methodology
- Overall (STATE)
- 90 Strongly Landlord-Friendly
- State South Carolina
- 90 Strongly Landlord-Friendly · R+6
- County
- — inherits STATE
- City
- — inherits STATE
ZIP-level market 29212
- Rents YoY
- -0.2%
- Active inventory
- 206
- Price-to-rent
- 6.2×
Monthly cashflow live
- Estimated rent
- $2,155 medium interval (Pro) →
- Mortgage (P&I)
- −$839
- Tax from tax record
- −$71 /mo · $857/yr
- Insurance
- −$67
- HOA
- −$232
- Vacancy / Maint / Mgmt
- −$453
- Net cashflow
- $494
Break-even live
UW: 25.0% down · 7.5% · 30yr · 1.5% tax · 5.0% vac · 8.0% maint · 8.0% mgmt
Financing live
Cash to close
- Down payment
- $39,975
- Closing costs
- $4,797
- Reserves months
- —
- Total cash needed
- —
Loan-product check · same deal, 3 products live
Conventional
25% down · 7.5% · 30yr
- Down + closing
- —
- Monthly P&I
- —
- Monthly cashflow
- —
- DSCR
- —
- Eligible?
- —
Personal DTI + credit; lowest rate.
DSCR
20% down · 8.5% · 30yr
- Down + closing
- —
- Monthly P&I
- —
- Monthly cashflow
- —
- DSCR
- —
- Eligible?
- —
No personal income docs; deal must DSCR.
Hard money
10% down · 12.0% · 12mo
- Down + closing
- —
- Monthly P&I
- —
- Monthly cashflow
- —
- DSCR
- —
- Eligible?
- —
Short-term bridge; refi at stabilization.
HOA detail condo
- Monthly dues
- $232 · $2,784/yr
- Assessments
- None detected in remarks — confirm with the listing agent.
Listing history 15 events
-
2026-06-18days on market $159,900 Active 79 DOM
-
2026-06-17days on market $159,900 Active 78 DOM
-
2026-06-16days on market $159,900 Active 77 DOM
-
2026-06-15days on market $159,900 Active 76 DOM
-
2026-06-14days on market $159,900 Active 74 DOM
-
2026-06-10days on market $159,900 Active 71 DOM
-
2026-06-09days on market $159,900 Active 70 DOM
-
2026-06-08days on market $159,900 Active 69 DOM
-
2026-06-07days on market $159,900 Active 68 DOM
-
2026-06-03days on market $159,900 Active 64 DOM
-
2026-06-03days on market $159,900 Active 63 DOM
-
2026-06-01days on market $159,900 Active 62 DOM
-
2026-05-31days on market $159,900 Active 61 DOM
-
2026-03-31$159,900 Active
-
1996-12-30soldstatus $49,500
ⓘ Source: listings_history table (triggers on properties + properties_extension) + one-shot
backfill from property_details.listing_events for pre-trigger history.
Tax reassessment forecast SC · Resets to sale price
- Current annual tax
- $857 · $71/mo
- Projected year-2 tax
- $911 · $76/mo
- Expected delta
- +$54/yr (+$5/mo · 6.4%)
ⓘ Screening estimate from a state-policy table — verify with the county assessor before closing.
Climate risk First Street
- Flood 1/10 Low FEMA zone X (unshaded) · 0% chance over 30 yrs
- Wildfire 3/10 Moderate
- Heat 6/10 Major 7 d/yr ≥108°F today · 16 d/yr by 30 yrs out
- Wind 6/10 Major 58% chance of damaging wind over 30 yrs
- Air quality 3/10 Moderate 2 unhealthy d/yr today · 3 by 30 yrs out
Nearby sold comps map
Loading sold comps map…
Walkable amenities ~0.75 mi
Loading nearby amenities…
Taxation est. · year 1
- Rental income
- $25,858
- − Mortgage interest
- −$8,957
- − Property taxes
- −$857
- − Insurance
- −$800
- − Repairs & maintenance
- −$2,069
- − Management
- −$2,069
- − HOA
- −$2,784
- − Depreciation
- −$4,652
- Taxable income
- $3,672
- Est. tax owed @ 24.0%
- −$881
- After-tax cash flow
- $5,044/yr
For passive investors: Depreciation is non-cash, so a rental often shows a tax loss while cash-flowing — sheltering income. Rental losses are passive: they offset passive income freely, and up to $25,000/yr can offset ordinary (W-2) income if you actively participate and your MAGI is under $100k (phasing out to $0 by $150k); unused losses carry forward. On sale, claimed depreciation is recaptured at up to 25%, and gains may owe capital-gains tax (a 1031 exchange can defer both). Figures are a year-1 estimate at your 24.0% rate — not tax advice; consult a CPA.
Schools (NCES district)
- District
- Richland 01
- NCES district ID
- 4503360
- Math proficiency
- 26% ▼ -7.00%
- Reading proficiency
- 36% ▼ -5.00%
- Median HH income
- $38,931
- Composite
- 25.94/100
- National rank
- #7335
- State rank
- #54 of 80 in SC
Livability — St. Andrews
No livability data for this city. (Only ~50 U.S. cities are tracked.)
Census & demographics
- Census place
- St. Andrews, SC
- County
- Lexington County · 232,571 people
- City population
- 40,504
- Metro
- Columbia, SC
- Population (ZIP)
- 27,657
- Household income
- $77,142
- Rent vs Own
- Severe rent burden
- 863.0
Population outlook (Richland County) Hauer SSP2
- Today (2025)
- 459,667 people
- By 2030
- 487,524 · +6.1%
- By 2040
- 542,035 · +17.9%
- By 2050
- 595,371 · +29.5%
- By 2075
- 732,998 · +59.5%
- By 2100
- 820,415 · +78.5%
Race, ethnicity, and origin ACS 2023
- Neighborhood character
- Majority White (63%)
- Race & ethnicity
- White 63% Black 25% Hispanic / Latino 5% Two or more races 4% Asian 3%
- Hispanic origin (detail)
- Mexican 2%
- Common ancestry
- Slovak 3% Italian 3% Serbian 3%
- Foreign-born
- 7% · Canada, China, Jamaica
- Languages at home
- 91% English-only · Spanish 4% Other Indo-European 1% Russian/Polish/Slavic 1%
Political lean MEDSL · Richland
- 2024 margin
- Solid D (+34.6) · D 66.4% · R 31.8% · Other 1.8%
- 2008→2024 swing
- +5.7pp toward D · 2008: 28.9pp · 2024: 34.6pp
- All cycles
- 2024: D+34.6 2020: D+38.3 2016: D+32.9 2012: D+33.3 2008: D+28.9
Not yet ingested
- Civics
- —
Market trends
- HPI YoY
- ▼ -139.55%
- Current HPI
- 212.5173
- Rent YoY
- ▼ -0.23%
- Metro
- Columbia, SC
- State GDP YoY
- ▲ 4.51%
- F500 in state
- 2
Industry mix (Fortune 500 HQ in SC)
| Industry | F500 HQs | Revenue |
|---|---|---|
| Packaging | 1 | $7B |
|
||
Price history
+223.0% since first listed2 events — show timeline
- 2026-03-31 Listed $159,900 Consolidated MLS
- 1996-12-30 Sold (Public Records) $49,500 Public Records
Property tax history
+3.6%/yrLatest (2025): $857 · +4.0% YoY. Source: county tax records.
Cash-flow waterfall
monthlySold comps — $/sqft
last 12 mo · ≤1 miLoading sold comps…