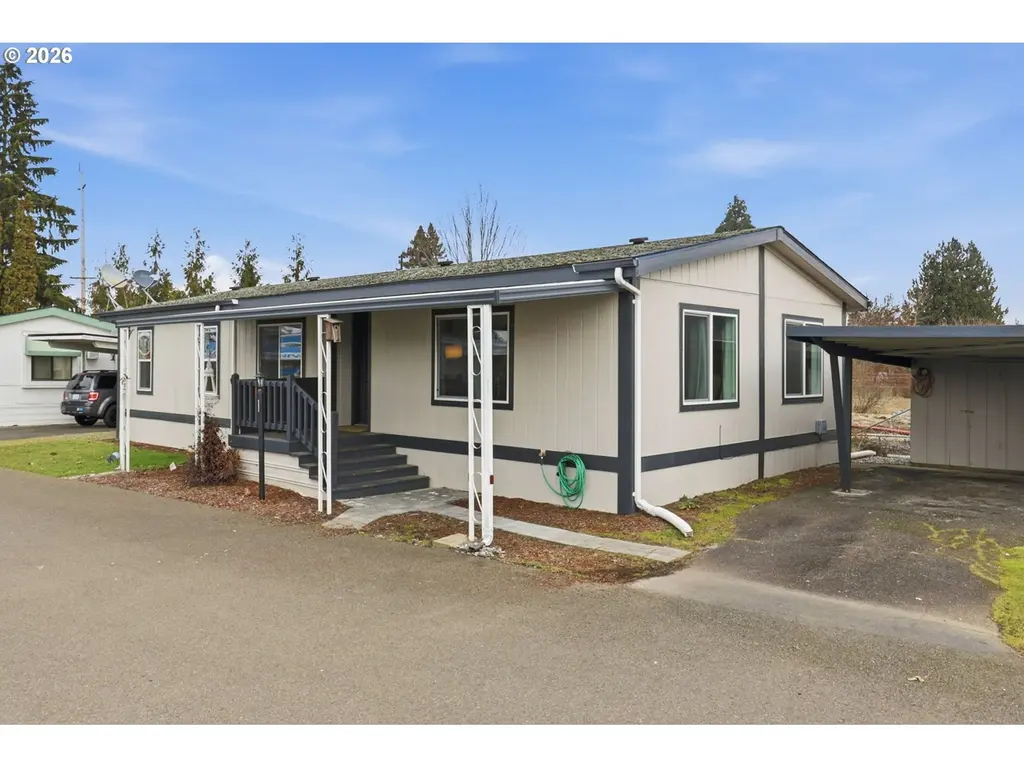
1709 NE 78th St #43 · Hazel Dell, WA
Flood risk No data
- FEMA flood zone
- —
- Chance of flooding over 30 yrs
- —
- Est. flood insurance / yr
- —
Fire risk No data
- Est. fire insurance / yr
- —
Heat risk No data
- Hot days now (above threshold)
- —
- Hot days in 30 yrs
- —
Wind risk No data
- Chance of severe wind over 30 yrs
- —
Air-quality risk No data
- Unhealthy air days now
- —
- Unhealthy air days in 30 yrs
- —
Risk factors via First Street. Map © Google.
Why this score? — see what drove the B- grade
The composite is a weighted blend of 9 inputs, each scored 0–100. Each bar is that input's sub-score; the figure is the points it added to the 100-point composite (weight × sub-score).
- Cash flow +30.0/30.0
- 1% rule +10.0/10.0
- DSCR +10.0/10.0
- Schools +4.3/10.0
- ARV discount +4.2/15.0
- Livability +4.1/5.0
- Rent growth +3.0/5.0
- Condition / age +2.5/5.0
- Appreciation +0.0/10.0
$115,000
🖨 Deal sheet (PDF) 📄 Offer letter ✓ Due diligence
Listing remarks MLS
Affordable, updated, and full of natural light, this 3-bedroom, 2-bath home in a 55+ community in Hazel Dell Estates offers comfortable living with modern finishes and a peaceful setting backing to 78th St Heritage Farm. Completely remodeled in 2023 and featuring a brand new HVAC system, this home blends fresh style with efficient, low-maintenance living.Inside, you’ll find an open layout with laminate flooring, quartz surfaces, and a spacious kitchen with island seating and stainless steel appliances, creating a bright and welcoming central gathering space. Large windows bring in great natural light, giving the living areas an airy, open feel.The primary suite includes its own bathroom, while the additional bedrooms and bath provide flexibility for guests, hobbies, or a home office. Central air and forced air heating keep things comfortable year-round, and the separate laundry area adds everyday convenience.Outside, enjoy a covered carport, driveway parking, and a tool shed for extra storage. The setting offers added privacy with green space behind, while still being close to shopping, dining, and services in the Hazel Dell area. A great opportunity for updated, easy living in a welcoming community.
Key facts
- Remodeled
- Laminate flooring
- Island seating
Tags
Neighborhood map
What this means for you Summary
Snapshot
- This is a 2-bed/2.5-bath manufactured listed at $115k.
Deal economics
- At list price, monthly cash flow is $718 ($9k/yr) — positive.
- The deal already cash-flows at list — no discount required.
- Meets the 1% rule at list price ($2k rent vs $115k).
- Recommended offer: $101k (12.0% below list) — sets the bar for market timing.
- Cap rate 13.8% vs local median 3.2% in Hazel Dell — top-decile yield for the area; either an underpriced asset or a hidden risk that comps aren't pricing in. Stress-test before assuming the spread holds.
Location & tenants
- Location reads 82/100 on livability (#67 in WA, #1,216 nationally) — a professional / high-income tenant draw. Strengths: amenities A+, commute A+, housing A+; Watch: crime D+, cost of living D, schools F.
- Vancouver School District (suburban): math 43% / reading 53% proficiency, ranked #156 of 291 in WA (top 54%) — families likely to look elsewhere, expect single-tenant / working-renter base with shorter leases.
- Market conditions: Rents rising (+2.0%/yr); 187 active listings in the ZIP; 40 comparable units currently listed for rent nearby; rentals leasing fast (median 11d on market — plan ~1-2 weeks tenant-placement turnaround); solid renter incomes; 3,547 units permitted in Clark County in 2024 (1,361 in 5+ unit buildings).
Forward outlook
- Local home prices are declining (-3.0%/yr); year-one equity from $795 of loan paydown is wiped out by about $3k of value loss. Plan a longer hold.
- Clark County population projected at +29% by 2050 — long-run rental-demand tailwind backs the buy-and-hold thesis.
- At projected returns (-3.0% appreciation + 2.0% rent growth), your $32k cash investment doubles in ~5 years — after that, you're playing with house money.
Negotiation context
- It's been on market 141 days — a 12% lower offer ($101k) is reasonable based on typical stale-listing flexibility.
Questions for the listing agent
- It's been on market 141 days. Have you received any prior offers? Is the seller open to a 12% concession, seller financing, or rate buy-down credit?
- Why hasn't it sold? Are there any deal-killer items the seller is aware of (foundation, flood, title, zoning, code violations)?
- Is there a deadline driving the sale (1031 exchange, divorce, estate, relocation)? That informs how much negotiation room exists.
- Schools are F-rated, which usually means shorter tenancies and higher turnover. Who's the typical renter profile here, and what's been the actual vacancy rate?
- Crime grade is D in this area — have there been break-ins, vandalism, or insurance claims at this property in the last 3 years? What carrier currently insures it and at what premium?
- What's the average days-on-market for RENTAL listings here right now (not sales)? A rising rental-DOM trend means longer vacancies and softer asking-rent achievability than the comps imply.
- What's the recent tenant-quality profile in this submarket — average credit score on applications, eviction rate, late-payment / NSF rate, and stable-employment percentage? A property-management company in the area should have these aggregated.
- How much new for-sale + rental construction is in the pipeline within 1–3 miles? Heavy new supply typically softens prices + rents 12–24 months out; constrained supply supports both.
Investment metrics
- 1% rule
- 1.54% ✓
- Cap rate
- 13.78%
- Cash-on-cash
- 26.74%
- DSCR
- 2.19
- GRM
- 5.4
CMA / ARV
- ARV (median comp)
- $107,182
- List price
- $115,000
- Delta
- 7.29%
- Verdict
- FAIR
- Comps
- 6 within 1.0 mi
Show comp detail 2 sales within ~0.75 mi
| Address | Dist | Beds/Ba | Sqft | Sold | Price | $/sf | Match |
|---|---|---|---|---|---|---|---|
| 1709 NE 78th St #1 | 0.00mi | 2/2.0 | 1,160 (-6%) | 2mo | $34,900 | $30 | 86 |
| 1709 NE 78th St #97 | 0.00mi | 2/2.0 | 1,404 (+13%) | 12mo | $115,000 | $82 | 66 |
Match score weights: distance 35% · size 25% · config 20% · recency 20%. Top-matched comps best support the ARV.
Projected returns pro-forma
-3.0% appreciation · 2.0% rent growth · sell at horizon
- IRR
- 19.5%
- Equity multiple
- 1.78×
- Total profit
- $25,261
- Equity at exit
- $17,147
- IRR
- 27.2%
- Equity multiple
- 3.29×
- Total profit
- $73,581
- Equity at exit
- $9,943
Cash invested: $32,200 (down + closing). Projections, not guarantees.
Landlord ↔ Tenant lean methodology
- Overall (STATE)
- 28 Tenant-Leaning
- State Washington
- 28 Tenant-Leaning · D+8
- County
- — inherits STATE
- City
- — inherits STATE
ZIP-level market 98665
- Rents YoY
- 2.0%
- Active inventory
- 187
- Price-to-rent
- 5.4×
Monthly cashflow live
- Estimated rent
- $1,768 high interval (Pro) →
- Mortgage (P&I)
- −$603
- Tax from tax record
- −$28 /mo · $337/yr
- Insurance
- −$48
- HOA
- −$0
- Vacancy / Maint / Mgmt
- −$371
- Net cashflow
- $718
Break-even live
Sensitivity live
| Price | -10% $783 | -5% $750 | +0% $718 | +5% $685 | +10% $652 |
|---|---|---|---|---|---|
| Rent | -10% $578 | -5% $648 | +0% $718 | +5% $787 | +10% $857 |
| Rate | -1.0pp $775 | -0.5pp $747 | base $718 | +0.5pp $688 | +1.0pp $657 |
UW: 25.0% down · 7.5% · 30yr · 1.5% tax · 5.0% vac · 8.0% maint · 8.0% mgmt
Financing live
Cash to close
- Down payment
- $28,750
- Closing costs
- $3,450
- Reserves months
- —
- Total cash needed
- —
Loan-product check · same deal, 3 products live
Conventional
25% down · 7.5% · 30yr
- Down + closing
- —
- Monthly P&I
- —
- Monthly cashflow
- —
- DSCR
- —
- Eligible?
- —
Personal DTI + credit; lowest rate.
DSCR
20% down · 8.5% · 30yr
- Down + closing
- —
- Monthly P&I
- —
- Monthly cashflow
- —
- DSCR
- —
- Eligible?
- —
No personal income docs; deal must DSCR.
Hard money
10% down · 12.0% · 12mo
- Down + closing
- —
- Monthly P&I
- —
- Monthly cashflow
- —
- DSCR
- —
- Eligible?
- —
Short-term bridge; refi at stabilization.
Rent comps 40 comps
| Address | Beds | Baths | Sqft | Rent | $/sqft | DOM | Units | Dist |
|---|---|---|---|---|---|---|---|---|
| 7306 NE 16th Ave #1 Vancouver, WA | 2.0 | 1.0 | 988 | $1,395 | $1.41 | 24d | 1 | 0.18mi |
| 7900 NE 18th Ave Vancouver, WA | 1.0–3.0 | 1.0 | 755 | $1,408 | $1.86 | 2d | 4 | 0.20mi |
| 8005 NE 13th Ave Vancouver, WA | 1.0–2.0 | 1.0–2.0 | 849 | $2,045 | $2.41 | 8d | 14 | 0.24mi |
| 7439 NE 13th Ave Vancouver, WA | 2.0 | 1.0 | 817 | $1,438 | $1.76 | 22d | 2 | 0.24mi |
| 7301 NE 13th Ave Vancouver, WA | 2.0 | 1.0 | 840 | $1,520 | $1.81 | 4d | 6 | 0.27mi |
| 1437 NE 82nd Dr Vancouver, WA | 3.0 | 2.5 | 1500 | $2,695 | $1.80 | 3d | 1 | 0.32mi |
| 8003 NE 13th Ave Vancouver, WA | 1.0–2.0 | 1.0–2.0 | 845 | $2,045 | $2.42 | 8d | 16 | 0.32mi |
| 2301 NE 81st St Vancouver, WA | 1.0–3.0 | 1.0–2.0 | 1080 | $1,975 | $1.83 | 2d | 10 | 0.34mi |
| 8208 NE 13th Ave Vancouver, WA | 2.0 | 1.0 | 750 | $1,450 | $1.93 | 24d | 1 | 0.43mi |
| 1106 NE 83rd St Vancouver, WA | 1.0–3.0 | 1.0–2.5 | 1058 | $1,932 | $1.83 | 21d | 1 | 0.50mi |
| 7317 NE Hazel Dell Ave #10 Vancouver, WA | 2.0 | 1.0 | 1037 | $1,395 | $1.35 | 24d | 1 | 0.58mi |
| 1405 NE 88th St Vancouver, WA | 1.0 | 1.0 | 733 | $1,550 | $2.11 | 24d | 1 | 0.59mi |
| 8601 NE 21st Ave Unit D Vancouver, WA | 3.0 | 2.5 | 1155 | $2,200 | $1.90 | 13d | 1 | 0.59mi |
| 8601 NE 21st Ave Unit D Vancouver, WA | 3.0 | 2.5 | 1155 | $2,200 | $1.90 | 15d | 1 | 0.59mi |
| 1532 NE 87th Way Vancouver, WA | 3.0 | 2.5 | 1418 | $2,295 | $1.62 | 24d | 1 | 0.61mi |
| 616 NE Anderson St Vancouver, WA | 2.0 | 1.0 | 825 | $1,295 | $1.57 | 24d | 1 | 0.63mi |
| 1016 NE 86th St Vancouver, WA | 2.0 | 1.0 | 950 | $1,475 | $1.55 | 24d | 1 | 0.67mi |
| 1008 NE 86th St Vancouver, WA | 2.0 | 1.0 | 700 | $1,395 | $1.99 | 24d | 1 | 0.68mi |
| 6208 NE 17th Ave Vancouver, WA | 2.0 | 2.0 | 981 | $1,575 | $1.60 | 5d | 7 | 0.68mi |
| 928 NE 86th St Vancouver, WA | 2.0 | 1.0 | 700 | $1,250 | $1.79 | 11d | 1 | 0.69mi |
| 932 NE 86th St Vancouver, WA | 2.0 | 1.0 | 700 | $1,295 | $1.85 | 24d | 1 | 0.69mi |
| 8917 NE 15th Ave Vancouver, WA | 2.0 | 1.0 | 850 | $1,395 | $1.64 | 2d | 11 | 0.72mi |
| 511 NE 66th St Vancouver, WA | 2.0 | 1.0 | 820 | $1,895 | $2.31 | 24d | 1 | 0.75mi |
| 418 NE 66th St Vancouver, WA | 2.0 | 1.0 | 820 | $1,795 | $2.19 | 24d | 1 | 0.75mi |
| 608 NE 86th St Vancouver, WA | 2.0 | 2.0 | 1031 | $1,825 | $1.77 | 3d | 1 | 0.78mi |
| 8415 NE Hazel Dell Ave Vancouver, WA | 2.0–3.0 | 1.0 | 871 | $1,500 | $1.72 | 2d | 4 | 0.78mi |
| 405 NE 85th St Vancouver, WA | 2.0 | 1.5 | 1116 | $2,299 | $2.06 | 3d | 1 | 0.82mi |
| 9211 NE 15th Ave Vancouver, WA | 1.0–3.0 | 1.0–2.0 | 900 | $1,649 | $1.83 | 3d | 22 | 0.83mi |
| 145 NW 76th St Vancouver, WA | 3.0 | 2.5 | 1349 | $2,245 | $1.66 | 8d | 1 | 0.87mi |
| 6304 NE 4th Ave Vancouver, WA | 2.0 | 1.0 | 985 | $1,499 | $1.52 | 18d | 1 | 0.90mi |
| 8500 NE Hazel Dell Ave Vancouver, WA | 1.0–2.0 | 1.0–2.0 | 837 | $1,675 | $2.00 | 11d | 2 | 0.92mi |
| 9501 NE 19th Ave Vancouver, WA | 1.0–2.0 | 1.0–2.5 | 844 | $2,099 | $2.49 | 4d | 20 | 0.94mi |
| 7714 NE 39th Ct Vancouver, WA | 1.0–2.0 | 1.0–2.0 | 921 | $2,035 | $2.21 | 3d | 12 | 1.04mi |
| 8007 NE 38th Ave Vancouver, WA | 3.0 | 2.5 | 1477 | $2,395 | $1.62 | 3d | 1 | 1.08mi |
| 1801 NE 99th St Unit 9802-6 Vancouver, WA | 2.0 | 1.5 | 910 | $1,395 | $1.53 | 24d | 1 | 1.09mi |
| 2703 NE 99th St Vancouver, WA | 1.0 | 1.0 | 800 | $1,700 | $2.12 | 5d | 1 | 1.13mi |
| 9917 NE 13th Ave Vancouver, WA | 2.0 | 1.0 | 707 | $1,645 | $2.33 | 3d | 4 | 1.15mi |
| 1824 NE 104th Loop Vancouver, WA | 2.0 | 1.0 | 847 | $1,420 | $1.68 | 24d | 1 | 1.30mi |
| 10117 NE 9th Ave Vancouver, WA | 1.0–2.0 | 1.0–2.0 | 790 | $1,470 | $1.86 | 3d | 8 | 1.30mi |
| 10223 NE 13th Ave Vancouver, WA | 2.0 | 2.0 | 850 | $1,675 | $1.97 | 24d | 1 | 1.36mi |
Listing history 14 events
-
2026-06-18days on market $115,000 Active 141 DOM
-
2026-06-17days on market $115,000 Active 140 DOM
-
2026-06-16days on market $115,000 Active 139 DOM
-
2026-06-15days on market $115,000 Active 138 DOM
-
2026-06-13days on market $115,000 Active 136 DOM
-
2026-06-09days on market $115,000 Active 132 DOM
-
2026-06-08days on market $115,000 Active 131 DOM
-
2026-06-07days on market $115,000 Active 130 DOM
-
2026-06-03days on market $115,000 Active 126 DOM
-
2026-06-02days on market $115,000 Active 125 DOM
-
2026-06-01days on market $115,000 Active 124 DOM
-
2026-05-31days on market $115,000 Active 123 DOM
-
2026-03-24price $130,000 1225-char remark
Show marketing remark (1225 chars)
Affordable, updated, and full of natural light, this 3-bedroom, 2-bath home in a 55+ community in Hazel Dell Estates offers comfortable living with modern finishes and a peaceful setting backing to 78th St Heritage Farm. Completely remodeled in 2023 and featuring a brand new HVAC system, this home blends fresh style with efficient, low-maintenance living.Inside, you’ll find an open layout with laminate flooring, quartz surfaces, and a spacious kitchen with island seating and stainless steel appliances, creating a bright and welcoming central gathering space. Large windows bring in great natural light, giving the living areas an airy, open feel.The primary suite includes its own bathroom, while the additional bedrooms and bath provide flexibility for guests, hobbies, or a home office. Central air and forced air heating keep things comfortable year-round, and the separate laundry area adds everyday convenience.Outside, enjoy a covered carport, driveway parking, and a tool shed for extra storage. The setting offers added privacy with green space behind, while still being close to shopping, dining, and services in the Hazel Dell area. A great opportunity for updated, easy living in a welcoming community.
-
2026-01-28$150,000 Active 1225-char remark
Show marketing remark (1225 chars)
Affordable, updated, and full of natural light, this 3-bedroom, 2-bath home in a 55+ community in Hazel Dell Estates offers comfortable living with modern finishes and a peaceful setting backing to 78th St Heritage Farm. Completely remodeled in 2023 and featuring a brand new HVAC system, this home blends fresh style with efficient, low-maintenance living.Inside, you’ll find an open layout with laminate flooring, quartz surfaces, and a spacious kitchen with island seating and stainless steel appliances, creating a bright and welcoming central gathering space. Large windows bring in great natural light, giving the living areas an airy, open feel.The primary suite includes its own bathroom, while the additional bedrooms and bath provide flexibility for guests, hobbies, or a home office. Central air and forced air heating keep things comfortable year-round, and the separate laundry area adds everyday convenience.Outside, enjoy a covered carport, driveway parking, and a tool shed for extra storage. The setting offers added privacy with green space behind, while still being close to shopping, dining, and services in the Hazel Dell area. A great opportunity for updated, easy living in a welcoming community.
ⓘ Source: listings_history table (triggers on properties + properties_extension) + one-shot
backfill from property_details.listing_events for pre-trigger history.
Tax reassessment forecast WA · Resets to sale price
- Current annual tax
- $337 · $28/mo
- Projected year-2 tax
- $1,127 · $94/mo
- Expected delta
- +$790/yr (+$66/mo · 234.6%)
ⓘ Screening estimate from a state-policy table — verify with the county assessor before closing.
Nearby sold comps map
Loading sold comps map…
Walkable amenities ~0.75 mi
Loading nearby amenities…
Taxation est. · year 1
- Rental income
- $21,214
- − Mortgage interest
- −$6,442
- − Property taxes
- −$337
- − Insurance
- −$575
- − Repairs & maintenance
- −$1,697
- − Management
- −$1,697
- − Depreciation
- −$3,345
- Taxable income
- $7,121
- Est. tax owed @ 24.0%
- −$1,709
- After-tax cash flow
- $6,902/yr
For passive investors: Depreciation is non-cash, so a rental often shows a tax loss while cash-flowing — sheltering income. Rental losses are passive: they offset passive income freely, and up to $25,000/yr can offset ordinary (W-2) income if you actively participate and your MAGI is under $100k (phasing out to $0 by $150k); unused losses carry forward. On sale, claimed depreciation is recaptured at up to 25%, and gains may owe capital-gains tax (a 1031 exchange can defer both). Figures are a year-1 estimate at your 24.0% rate — not tax advice; consult a CPA.
Schools (NCES district)
- District
- Vancouver School District
- NCES district ID
- 5309270
- Math proficiency
- 43% ▬ 0.00%
- Reading proficiency
- 53% ▬ 0.00%
- Median HH income
- $52,562
- Composite
- 43.45/100
- National rank
- #6479
- State rank
- #156 of 291 in WA
Livability — Hazel Dell
- Score
- 82/100
- State rank
- #67
- US rank
- #1216
Category grades
Schools grade is shown separately in the Schools card above.
Census & demographics
- Census place
- Hazel Dell, WA
- County
- Clark County · 513,189 people
- City population
- 28,243
- Metro
- Portland-Vancouver-Hillsboro, OR-WA
- Population (ZIP)
- 28,910
- Household income
- $88,559
- Rent vs Own
- Severe rent burden
- 1070.0
Population outlook (Clark County) Hauer SSP2
- Today (2025)
- 529,610 people
- By 2030
- 563,242 · +6.4%
- By 2040
- 625,905 · +18.2%
- By 2050
- 681,558 · +28.7%
- By 2075
- 805,967 · +52.2%
- By 2100
- 877,450 · +65.7%
Race, ethnicity, and origin ACS 2023
- Neighborhood character
- Predominantly White (70%)
- Race & ethnicity
- White 70% Hispanic / Latino 14% Two or more races 11% Asian 5% Black 3%
- Hispanic origin (detail)
- Mexican 12%
- Common ancestry
- Portuguese 5% Italian 4% Slovak 3%
- Foreign-born
- 12% · Canada, China
- Languages at home
- 80% English-only · Spanish 9% Russian/Polish/Slavic 3% Other Asian/Pacific 2%
Political lean MEDSL · Clark
- 2024 margin
- Lean D (+7.0) · D 52.1% · R 45.1% · Other 2.8%
- 2008→2024 swing
- +0.9pp no change · 2008: 6.1pp · 2024: 7.0pp
- All cycles
- 2024: D+7.0 2020: D+5.1 2016: D+0.1 2012: D+0.1 2008: D+6.1
Not yet ingested
- Civics
- —
Market trends
- HPI YoY
- ▼ -274.20%
- Current HPI
- 303.1342
- Rent YoY
- ▲ 2.00%
- Metro
- Portland-Vancouver-Hillsboro, OR-WA
- State GDP YoY
- ▲ 4.65%
- F500 in state
- 22
Industry mix (Fortune 500 HQ in WA)
| Industry | F500 HQs | Revenue |
|---|---|---|
| Retail | 2 | $269B |
|
||
| Technology / Retail | 1 | $638B |
|
||
| Technology | 1 | $245B |
|
||
| Telecommunications | 1 | $38B |
|
||
| Food / Beverage | 1 | $36B |
|
||
| Automotive / Trucks | 1 | $34B |
|
||
Price history
-13.3% since first listed2 events — show timeline
- 2026-03-24 Price Changed $130,000 RMLS
- 2026-01-28 Listed $150,000 RMLS
Property tax history
-1.0%/yrLatest (2026): $337 · +51.8% YoY. Source: county tax records.
Cash-flow waterfall
monthlySold comps — $/sqft
last 12 mo · ≤1 miLoading sold comps…