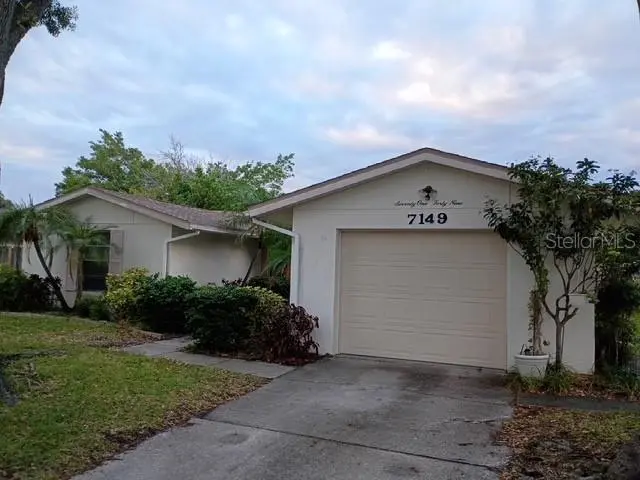
7149 Channelside Ln N · Pinellas Park, FL
Flood risk 6/10 · Moderate
- FEMA flood zone
- X (shaded)
- Chance of flooding over 30 yrs
- 0.7%
- Est. flood insurance / yr
- $507 – $1,088
Fire risk 1/10 · Minimal
- Est. fire insurance / yr
- $947 – $1,759
Heat risk 10/10 · Severe
- Hot days now (above 107°F)
- 7 days/yr
- Hot days in 30 yrs
- 26 days/yr
Wind risk 10/10 · Severe
- Chance of severe wind over 30 yrs
- 99.0%
Air-quality risk 4/10 · Minor
- Unhealthy air days now
- 4 days/yr
- Unhealthy air days in 30 yrs
- 4 days/yr
Risk factors via First Street. Map © Google.
Why this score? — see what drove the C- grade
The composite is a weighted blend of 9 inputs, each scored 0–100. Each bar is that input's sub-score; the figure is the points it added to the 100-point composite (weight × sub-score).
- Cash flow +15.8/30.0
- ARV discount +15.0/15.0
- DSCR +4.9/10.0
- Schools +4.3/10.0
- Livability +3.9/5.0
- 1% rule +3.4/10.0
- Condition / age +2.5/5.0
- Rent growth +1.8/5.0
- Appreciation +0.0/10.0
$274,900
🖨 Deal sheet (PDF) 📄 Offer letter ✓ Due diligence
Listing remarks
A quaint, cozy blank slate that is ready for your personal touch! Priced to sell, this 3 Bedroom, 2 full Bathroom ranch is in a great location and only minutes from the beach, shopping, and schools! Complete with a dining room, Florida room, covered patio, storage shed, and private yard, this hidden gem of a house is ready for you to come in and make it your home! This would make a great investment property or "vacation" home as well. Come take a look. .. it won't last long!
Key facts
- Florida room
- Covered patio
- Storage shed
Tags
Property features AI
Finance
- Other: Homestead property; City limits lot; level and paved with public-maintained road; Lot size approx. 0.17 acres (about 705 sq. m); One lot
- HOA & community: No association fees; Pets allowed
Exterior
- Parking: Driveway; Attached garage with garage door opener; Workshop area in garage; Garage (1 space)
- Security: Smoke detector(s)
- Utilities: Public water; Public sewer; Underground utilities
- Home design: Single family residence; One story; Faces south; Residential zoning (R-3)
- Construction: Stucco construction; Shingle roof; Slab foundation; Built with public records living area of 1,518 sq. ft.
- Exterior features: Covered patio; Patio; Gray water system; Sidewalk; Vinyl and wood fencing; Shed(s); Mature landscaping with oak trees
Interior
- Kitchen: Dishwasher; Disposal; Microwave; Range; Range hood; Refrigerator; Electric water heater; Exhaust fan
- Bedrooms: 3 bedrooms
- Flooring: Carpet; Ceramic tile
- Bathrooms: 2 full bathrooms
- Heating & cooling: Central heating (electric); Central air
- Interior features: Ceiling fans; Living room/dining room combo; Solid surface counters; Thermostat; Walk-in closets; Window treatments (blinds)
- Laundry & utility: Washer hookup; Dryer hookup (electric); Laundry area in garage
Neighborhood map
What this means for you Summary
Snapshot
- This is a 3-bed/2.0-bath single-family listed at $275k.
Deal economics
- At list price, monthly cash flow is $125 ($2k/yr) — positive.
- The deal already cash-flows at list — no discount required.
- To meet the 1% rule (rent ≥ 1% of price), the offer needs to be $232k (15.7% below list).
- Recommended offer: $232k (15.7% below list) — sets the bar for 1% rule.
- Cap rate 6.8% vs local median 4.1% in Pinellas Park — top-decile yield for the area; either an underpriced asset or a hidden risk that comps aren't pricing in. Stress-test before assuming the spread holds.
Location & tenants
- Location reads 78/100 on livability (#170 in FL, #2,546 nationally) — a middle-class / working-renter tenant base. Strengths: commute A+, cost of living A+, housing A+; Watch: employment D+, amenities F.
- Pinellas (suburban): math 51% / reading 51% proficiency, ranked #31 of 73 in FL (top 42%) — acceptable for families but not a draw, mixed tenant base, ~2y average lease.
- Zoned schools: Marjorie Kinnan Rawlings Elem (math 49% / reading 39%, grade F, #1,330 of 2,144 statewide, top 63%, 460 students, 67% FRL); Pinellas Park Middle School (math 44% / reading 38%, grade F, #353 of 571 statewide, top 63%, 1,126 students, 67% FRL); Pinellas Park High School (math 28% / reading 35%, grade F, #424 of 667 statewide, top 64%, 1,919 students, 57% FRL) — zoned schools average 64% FRL vs 48% district-wide (16 pts higher); higher-poverty schools than district average — tighter screening recommended.
- Zoned-school proficiency averages 39% at this address vs 51% district-wide (-12 pts) — the specific schools serving this property underperform the Pinellas average; the district grade overstates school quality for this exact location.
- Market conditions: Rents soft (-3.0%/yr); 230 active listings in the ZIP; 30 comparable units currently listed for rent nearby; rentals leasing fast (median 6d on market — plan ~1-2 weeks tenant-placement turnaround); 2,676 units permitted in Pinellas County in 2024 (1,422 in 5+ unit buildings).
- At $2,316/mo this rent would consume 48% of the median local household income ($58k/yr) (locally 1115% of renters already pay >50% of income on rent) — very limited rent-growth headroom before tenants either downsize or default.
Forward outlook
- Local home prices are declining (-3.0%/yr); year-one equity from $2k of loan paydown is wiped out by about $8k of value loss. Plan a longer hold.
- Pinellas County population projected at +14% by 2050 — modest demand growth; plan on rents tracking national, not racing it.
Negotiation context
- Only 2 days on market — expect competitive offers; lowballing is unlikely to land.
- Current owner paid $100k; list at $275k implies a 175% gain — meaningful room to come down on a strong offer.
Risks & watch-outs
- Climate carrying-cost: major flood risk; severe wind risk, 99% chance of damaging wind over 30y; extreme-heat days projected 7→26/yr by 2055 (HVAC capex compounding) — expect insurance premiums to compound above CPI over the hold.
Questions for the listing agent
- Is there a deadline driving the sale (1031 exchange, divorce, estate, relocation)? That informs how much negotiation room exists.
- Schools are D-rated, which usually means shorter tenancies and higher turnover. Who's the typical renter profile here, and what's been the actual vacancy rate?
- What's the average days-on-market for RENTAL listings here right now (not sales)? A rising rental-DOM trend means longer vacancies and softer asking-rent achievability than the comps imply.
- What's the recent tenant-quality profile in this submarket — average credit score on applications, eviction rate, late-payment / NSF rate, and stable-employment percentage? A property-management company in the area should have these aggregated.
- How much new for-sale + rental construction is in the pipeline within 1–3 miles? Heavy new supply typically softens prices + rents 12–24 months out; constrained supply supports both.
Investment metrics
- 1% rule
- 0.84% ✗
- Cap rate
- 6.84%
- Cash-on-cash
- 1.96%
- DSCR
- 1.09
- GRM
- 9.9
CMA / ARV
- ARV (on-the-fly)
- $423,522
- Comps found
- 12
Show comp detail 12 sales within ~0.75 mi
| Address | Dist | Beds/Ba | Sqft | Sold | Price | $/sf | Match |
|---|---|---|---|---|---|---|---|
| 6522 Woodland Blvd N | 0.13mi | 3/2.0 | 1,612 (+6%) | 1mo | $430,000 | $267 | 82 |
| 6813 Circlecreek Dr | 0.19mi | 4/2.0 (+1) | 1,506 (-1%) | 5mo | $445,000 | $295 | 80 |
| 6391 68th Ln N | 0.26mi | 4/2.0 (+1) | 1,543 (+2%) | 1mo | $405,000 | $262 | 80 |
| 6821 N Circle Creek Dr | 0.20mi | 3/2.0 | 1,402 (-8%) | 2mo | $485,000 | $346 | 76 |
| 6910 Dalkeith Ave N | 0.44mi | 4/2.0 (+1) | 1,533 (+1%) | 2mo | $465,000 | $303 | 71 |
| 7026 68th Ave N | 0.19mi | 3/2.0 | 1,316 (-13%) | 0mo | $310,000 | $236 | 69 |
| 7292 62nd Ave N | 0.31mi | 3/2.0 | 1,656 (+9%) | 6mo | $441,000 | $266 | 66 |
| 6050 Garmouth Way N | 0.32mi | 4/3.0 (+1) | 1,453 (-4%) | 4mo | $533,000 | $367 | 65 |
| 7690 Innis Ct | 0.55mi | 3/2.0 | 1,470 (-3%) | 7mo | $410,000 | $279 | 63 |
| 6732 68th St N | 0.31mi | 4/2.0 (+1) | 1,345 (-11%) | 3mo | $425,000 | $316 | 59 |
| 6505 67th Ave N | 0.71mi | 3/2.0 | 1,578 (+4%) | 5mo | $286,000 | $181 | 56 |
| 7289 56th Ave N | 0.59mi | 2/2.0 (-1) | 1,438 (-5%) | 5mo | $316,000 | $220 | 55 |
Match score weights: distance 35% · size 25% · config 20% · recency 20%. Top-matched comps best support the ARV.
Projected returns pro-forma
-3.0% appreciation · 0.0% rent growth · sell at horizon
- IRR
- -16.3%
- Equity multiple
- 0.44×
- Total profit
- $-43,430
- Equity at exit
- $40,988
- IRR
- -13.9%
- Equity multiple
- 0.30×
- Total profit
- $-54,110
- Equity at exit
- $23,768
Cash invested: $76,972 (down + closing). Projections, not guarantees.
Landlord ↔ Tenant lean methodology
- Overall (STATE)
- 87 Strongly Landlord-Friendly
- State Florida
- 87 Strongly Landlord-Friendly · R+3
- County
- — inherits STATE
- City
- — inherits STATE
ZIP-level market 33781
- Rents YoY
- -3.0%
- Active inventory
- 230
- Price-to-rent
- 9.9×
Monthly cashflow live
- Estimated rent
- $2,316 high interval (Pro) →
- Mortgage (P&I)
- −$1,442
- Tax from tax record
- −$148 /mo · $1,780/yr
- Insurance
- −$115
- HOA
- −$0
- Vacancy / Maint / Mgmt
- −$486
- Net cashflow
- $125
Break-even live
Sensitivity live
| Price | -10% $281 | -5% $203 | +0% $125 | +5% $48 | +10% $-30 |
|---|---|---|---|---|---|
| Rent | -10% $-58 | -5% $34 | +0% $125 | +5% $217 | +10% $308 |
| Rate | -1.0pp $264 | -0.5pp $195 | base $125 | +0.5pp $54 | +1.0pp $-18 |
UW: 25.0% down · 7.5% · 30yr · 1.5% tax · 5.0% vac · 8.0% maint · 8.0% mgmt
Financing live
Cash to close
- Down payment
- $68,725
- Closing costs
- $8,247
- Reserves months
- —
- Total cash needed
- —
Loan-product check · same deal, 3 products live
Conventional
25% down · 7.5% · 30yr
- Down + closing
- —
- Monthly P&I
- —
- Monthly cashflow
- —
- DSCR
- —
- Eligible?
- —
Personal DTI + credit; lowest rate.
DSCR
20% down · 8.5% · 30yr
- Down + closing
- —
- Monthly P&I
- —
- Monthly cashflow
- —
- DSCR
- —
- Eligible?
- —
No personal income docs; deal must DSCR.
Hard money
10% down · 12.0% · 12mo
- Down + closing
- —
- Monthly P&I
- —
- Monthly cashflow
- —
- DSCR
- —
- Eligible?
- —
Short-term bridge; refi at stabilization.
Rent comps 30 comps
| Address | Beds | Baths | Sqft | Rent | $/sqft | DOM | Units | Dist |
|---|---|---|---|---|---|---|---|---|
| 6398 Woodland Blvd Unit 1366035P Pinellas Park, FL | 3.0 | 2.0 | 1367 | $5,894 | $4.31 | 0d | 1 | 0.19mi |
| 7238 55th Ave N Saint Petersburg, FL | 2.0 | 2.0 | 1085 | $1,899 | $1.75 | 19d | 1 | 0.65mi |
| 7140 55th Ave N Saint Petersburg, FL | 3.0 | 2.0 | 1085 | $2,000 | $1.84 | 23d | 1 | 0.65mi |
| 7075 65th Way N Pinellas Park, FL | 4.0 | 2.0 | 1586 | $2,500 | $1.58 | 9d | 1 | 0.74mi |
| 7075 65th Way N Pinellas Park, FL | 4.0 | 2.0 | 1586 | $2,500 | $1.58 | 0d | 1 | 0.74mi |
| 5410 70th Way N Saint Petersburg, FL | 3.0 | 1.0 | 1160 | $2,100 | $1.81 | 5d | 1 | 0.74mi |
| 5410 70th Way N Saint Petersburg, FL | 3.0 | 1.0 | 1354 | $2,100 | $1.55 | 5d | 1 | 0.74mi |
| 5980 80th St N #205 St Petersburg, FL | 2.0 | 2.0 | 1100 | $1,950 | $1.77 | 6d | 1 | 0.74mi |
| 5341 71st Way N Saint Petersburg, FL | 3.0 | 2.5 | 1807 | $4,100 | $2.27 | 6d | 1 | 0.81mi |
| 5725 80th St N #210 Saint Petersburg, FL | 2.0 | 2.0 | 1125 | $1,900 | $1.69 | 26d | 1 | 0.84mi |
| 5750 80th St N St Petersburg, FL | 1.0–2.0 | 1.0–1.5 | 987 | $1,800 | $1.82 | 26d | 2 | 0.92mi |
| 5136 68th St N Unit B St. Petersburg, FL | 3.0 | 1.0 | 1302 | $1,900 | $1.46 | 6d | 1 | 0.98mi |
| 6980 82nd Ave N Pinellas Park, FL | 4.0 | 2.5 | 1250 | $2,500 | $2.00 | 26d | 1 | 0.99mi |
| 8186 Terrace Garden Dr N #409 St Petersburg, FL | 2.0 | 2.0 | 1765 | $2,200 | $1.25 | 6d | 1 | 1.01mi |
| 6641 80th Ave N Pinellas Park, FL | 2.0 | 2.5 | 1269 | $2,400 | $1.89 | 26d | 1 | 1.03mi |
| 4930 72nd St N Saint Petersburg, FL | 2.0 | 1.0 | 1352 | $1,950 | $1.44 | 6d | 1 | 1.05mi |
| 5357 81st St N #14 Saint Petersburg, FL | 2.0 | 2.0 | 1110 | $1,550 | $1.40 | 26d | 1 | 1.07mi |
| 6522 54th Ave N Saint Petersburg, FL | 1.0–3.0 | 1.0–2.0 | 892 | $1,900 | $2.13 | 3d | 10 | 1.10mi |
| 8133 65th Way N Pinellas Park, FL | 4.0 | 2.0 | 1520 | $2,600 | $1.71 | 6d | 1 | 1.15mi |
| 6622 83rd Ave N Pinellas Park, FL | 2.0 | 2.5 | 1730 | $2,500 | $1.45 | 3d | 1 | 1.19mi |
| 6960 Versailles Unit 6960 Pinellas Park, FL | 2.0 | 2.0 | 1109 | $1,695 | $1.53 | 5d | 1 | 1.20mi |
| 7077 Versailles Unit 7077 Pinellas Park, FL | 2.0 | 2.0 | 1350 | $1,695 | $1.26 | 5d | 1 | 1.20mi |
| 4653 78th Ln N St Petersburg, FL | 3.0 | 2.0 | 1312 | $2,695 | $2.05 | 26d | 1 | 1.33mi |
| 6045 71st Ave N Pinellas Park, FL | 3.0 | 2.0 | 1200 | $3,150 | $2.62 | 6d | 1 | 1.34mi |
| 5980 63rd Ter N Pinellas Park, FL | 3.0 | 2.0 | 1600 | $2,990 | $1.87 | 6d | 1 | 1.36mi |
| 8330 63rd Way N Pinellas Park, FL | 4.0 | 2.0 | 1354 | $2,475 | $1.83 | 6d | 1 | 1.38mi |
| 5255 62nd St N Kenneth City, FL | 1.0–3.0 | 1.0–2.0 | 1000 | $1,775 | $1.77 | 4d | 2 | 1.39mi |
| 5957 McKee Lake Dr N Saint Petersburg, FL | 3.0 | 2.0 | 1152 | $2,400 | $2.08 | 6d | 1 | 1.44mi |
| 5526 59th Way N Unit 1 St. Petersburg, FL | 2.0 | 1.0 | 1384 | $1,750 | $1.26 | 26d | 1 | 1.50mi |
| 7005 59th St N Pinellas Park, FL | 3.0 | 2.0 | 1274 | $2,889 | $2.27 | 26d | 1 | 1.50mi |
Listing history 2 events
-
2026-06-07remarks 482-char remark
-
2026-06-07$274,900 Pending 2 DOM
ⓘ Source: listings_history table (triggers on properties + properties_extension) + one-shot
backfill from property_details.listing_events for pre-trigger history.
Tax reassessment forecast FL · Resets to sale price
- Current annual tax
- $1,780 · $148/mo
- Projected year-2 tax
- $2,282 · $190/mo
- Expected delta
- +$502/yr (+$42/mo · 28.2%)
ⓘ Screening estimate from a state-policy table — verify with the county assessor before closing.
Climate risk First Street
- Flood 6/10 Major FEMA zone X (shaded) · 70% chance over 30 yrs
- Wildfire 1/10 Low
- Heat 10/10 Extreme 7 d/yr ≥107°F today · 26 d/yr by 30 yrs out
- Wind 10/10 Extreme 99% chance of damaging wind over 30 yrs
- Air quality 4/10 Moderate 4 unhealthy d/yr today · 4 by 30 yrs out
Nearby sold comps map
Loading sold comps map…
Walkable amenities ~0.75 mi
Loading nearby amenities…
Taxation est. · year 1
- Rental income
- $27,796
- − Mortgage interest
- −$15,399
- − Property taxes
- −$1,780
- − Insurance
- −$1,374
- − Repairs & maintenance
- −$2,224
- − Management
- −$2,224
- − Depreciation
- −$7,997
- Taxable loss
- −$3,201
- Est. tax savings @ 24.0%
- +$768
- After-tax cash flow
- $2,274/yr
For passive investors: Depreciation is non-cash, so a rental often shows a tax loss while cash-flowing — sheltering income. Rental losses are passive: they offset passive income freely, and up to $25,000/yr can offset ordinary (W-2) income if you actively participate and your MAGI is under $100k (phasing out to $0 by $150k); unused losses carry forward. On sale, claimed depreciation is recaptured at up to 25%, and gains may owe capital-gains tax (a 1031 exchange can defer both). Figures are a year-1 estimate at your 24.0% rate — not tax advice; consult a CPA.
Schools (NCES district)
- District
- Pinellas
- NCES district ID
- 1201560
- Math proficiency
- 51% ▼ -5.00%
- Reading proficiency
- 51% ▼ -3.00%
- Median HH income
- $46,270
- Composite
- 43.27/100
- National rank
- #3046
- State rank
- #31 of 73 in FL
Livability — Pinellas Park
- Score
- 78/100
- State rank
- #170
- US rank
- #2546
Category grades
Schools grade is shown separately in the Schools card above.
Census & demographics
- County
- Pinellas County · 939,478 people
- City population
- 50,533
- Metro
- Tampa-St. Petersburg-Clearwater, FL
- Population (ZIP)
- 28,072
- Household income
- $57,785
- Rent vs Own
- Severe rent burden
- 1115.0
Population outlook (Pinellas County) Hauer SSP2
- Today (2025)
- 1,027,532 people
- By 2030
- 1,063,586 · +3.5%
- By 2040
- 1,125,020 · +9.5%
- By 2050
- 1,168,637 · +13.7%
- By 2075
- 1,265,188 · +23.1%
- By 2100
- 1,260,357 · +22.7%
Race, ethnicity, and origin ACS 2023
- Neighborhood character
- Diverse neighborhood (Simpson 0.60)
- Race & ethnicity
- White 59% Hispanic / Latino 16% Asian 14% Two or more races 11% Black 7%
- Hispanic origin (detail)
- Mexican 2% Puerto Rican 6% Cuban 5%
- Common ancestry
- Romanian 3% Lithuanian 3% Slovak 2%
- Foreign-born
- 18% · Canada, Vietnam, Jamaica
- Languages at home
- 72% English-only · Spanish 12% Vietnamese 7% Other Asian/Pacific 3%
Political lean MEDSL · Pinellas
- 2024 margin
- Lean R (+5.2) · D 46.9% · R 52.1%
- 2008→2024 swing
- -13.5pp toward R · 2008: 8.3pp · 2024: -5.2pp
- All cycles
- 2024: R+5.2 2020: D+0.2 2016: R+1.1 2012: D+5.6 2008: D+8.3
Not yet ingested
- Civics
- —
Market trends
- HPI YoY
- ▼ -409.77%
- Current HPI
- 348.546
- Rent YoY
- ▼ -2.95%
- Metro
- Tampa-St. Petersburg-Clearwater, FL
- State GDP YoY
- ▲ 3.28%
- F500 in state
- 36
Industry mix (Fortune 500 HQ in FL)
| Industry | F500 HQs | Revenue |
|---|---|---|
| Industrial Technology | 2 | $29B |
|
||
| Insurance | 2 | $17B |
|
||
| Retail | 1 | $60B |
|
||
| Technology Distribution | 1 | $58B |
|
||
| Homebuilding | 1 | $35B |
|
||
| Technology Manufacturing | 1 | $35B |
|
||
Price history
+418.7% since first listed5 events — show timeline
- 2026-06-06 Pending — Stellar MLS as Distributed by MLS Grid
- 2026-06-04 Listed $274,900 Stellar MLS as Distributed by MLS Grid
- 2001-05-10 Sold (Public Records) $100,000 Public Records
- 1983-03-01 Sold (Public Records) $59,500 Public Records
- 1981-04-01 Sold (Public Records) $53,000 Public Records
Property tax history
-1.4%/yrLatest (2025): $1,780 · +6.5% YoY. Source: county tax records.
Cash-flow waterfall
monthlySold comps — $/sqft
last 12 mo · ≤1 miLoading sold comps…