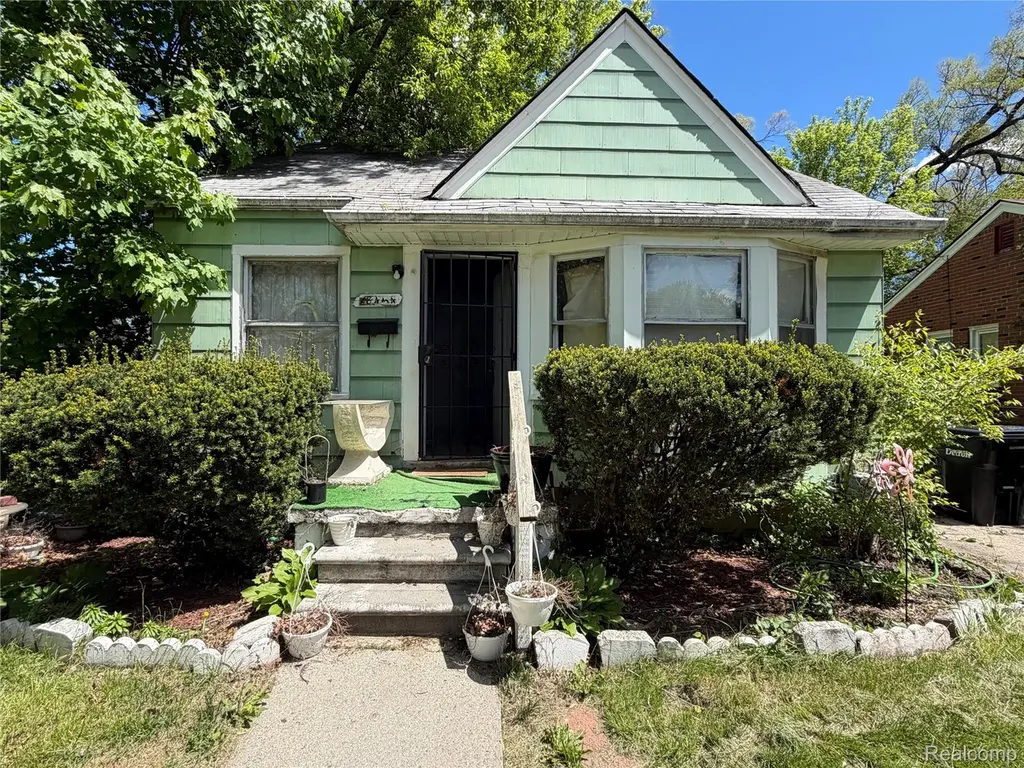
18434 Vaughan St · Detroit, MI
Flood risk 4/10 · Minor
- FEMA flood zone
- X (unshaded)
- Chance of flooding over 30 yrs
- 0.2%
- Est. flood insurance / yr
- $473 – $860
Fire risk 1/10 · Minimal
- Est. fire insurance / yr
- $784 – $1,456
Heat risk 3/10 · Minor
- Hot days now (above 98°F)
- 7 days/yr
- Hot days in 30 yrs
- 15 days/yr
Wind risk 2/10 · Minimal
- Chance of severe wind over 30 yrs
- —
Air-quality risk 3/10 · Minor
- Unhealthy air days now
- 2 days/yr
- Unhealthy air days in 30 yrs
- 5 days/yr
Risk factors via First Street. Map © Google.
Why this score? — see what drove the B+ grade
The composite is a weighted blend of 9 inputs, each scored 0–100. Each bar is that input's sub-score; the figure is the points it added to the 100-point composite (weight × sub-score).
- Cash flow +30.0/30.0
- ARV discount +15.0/15.0
- 1% rule +10.0/10.0
- DSCR +10.0/10.0
- Rent growth +4.5/5.0
- Livability +3.7/5.0
- Condition / age +2.5/5.0
- Schools +1.3/10.0
- Appreciation +0.0/10.0
$30,000
🖨 Deal sheet 📄 Offer letter ✓ Due diligence
Listing remarks
Welcome to 18434 Vaughan in Detroit! This solid single-family ranch home, built in 1940, offers 2 bedrooms, 1 bathroom, and approximately 700 square feet of living space. The home also features a full 700 square foot unfinished basement, providing plenty of storage or future finishing potential, along with a long driveway for convenient parking. Inside, you’ll find a spacious kitchen complete with appliances and a comfortable living room perfect for relaxing or entertaining guests. The property is fully enclosed with chain-link fencing, offering added privacy and security. A great opportunity for investors or owner-occupants looking for a light rehab project with strong potential. Con
Key facts
- Unfinished basement
- Spacious kitchen
- Long driveway
Tags
Property features AI
Finance
- Financial info: $730 annual tax
Exterior
- Parking: No garage
- Utilities: Public water; Public sewer
- Home design: Single-family residence; One level; Ground-level entry
- Construction: Aluminum siding; Vinyl siding; Block construction; Block foundation
- Exterior features: Paved road access; Lot about 0.1 acre (approx. 43.46 x 100)
Interior
- Bathrooms: One full bathroom
- Heating & cooling: Forced air heating; Natural gas heating; No central cooling
- Interior features: Unfinished basement; Total of 4 rooms
Neighborhood map
What this means for you Summary
Snapshot
- This is a 2-bed/1.0-bath single-family listed at $30k.
Deal economics
- At list price, monthly cash flow is $611 ($7k/yr) — positive.
- The deal already cash-flows at list — no discount required.
- Meets the 1% rule at list price ($1k rent vs $30k).
- Recommended offer: $29k (3.0% below list) — sets the bar for market timing.
- Cap rate 30.7% vs local median 10.2% in Detroit — top-decile yield for the area; either an underpriced asset or a hidden risk that comps aren't pricing in. Stress-test before assuming the spread holds.
Location & tenants
- Location reads 73/100 on livability (#218 in MI) — a middle-class / working-renter tenant base. Strengths: amenities A+, commute A+, cost of living A+; Watch: schools F, crime F, employment F.
- Detroit Public Schools Community District (urban): math 10% / reading 24% proficiency, ranked #499 of 540 in MI (top 92%) — low school quality limits family demand, transient renter base, plan for 1-2y turnover; 90% free/reduced lunch — lower-income household profile, screen leases tightly.
- Market conditions: Rents rising fast (+8.0%/yr); 305 active listings in the ZIP; 19 comparable units currently listed for rent nearby; rentals at typical pace (median 25d on market — plan ~3-4 weeks tenant-placement turnaround); lower-income renter base — watch delinquency; 2,639 units permitted in Wayne County in 2024 (1,216 in 5+ unit buildings).
Forward outlook
- Local home prices are declining (-3.0%/yr); year-one equity from $207 of loan paydown is wiped out by about $900 of value loss. Plan a longer hold.
- Wayne County population projected at -17% by 2050 — secular population decline; favor cash flow + early exit over multi-decade hold.
- At projected returns (-3.0% appreciation + 8.0% rent growth), your $8k cash investment doubles in ~2 years — after that, you're playing with house money.
Negotiation context
- It's been on market 35 days — a 3% lower offer ($29k) is reasonable based on typical stale-listing flexibility.
- 5 sale attempts; this cycle's ask has dropped $5k (14%) from the opening price — seller is motivated, your offer sets the floor, not the list.
Risks & watch-outs
- Watch-outs: built in 1940 — expect roof / HVAC / electrical / plumbing capex.
Questions for the listing agent
- It's been on market 35 days. Have you received any prior offers? Is the seller open to a 3% concession, seller financing, or rate buy-down credit?
- Built in 1940 — when were the roof, HVAC, electrical panel, plumbing, and water heater last replaced?
- Is there a deadline driving the sale (1031 exchange, divorce, estate, relocation)? That informs how much negotiation room exists.
- Schools are F-rated, which usually means shorter tenancies and higher turnover. Who's the typical renter profile here, and what's been the actual vacancy rate?
- Crime grade is F in this area — have there been break-ins, vandalism, or insurance claims at this property in the last 3 years? What carrier currently insures it and at what premium?
- What's the average days-on-market for RENTAL listings here right now (not sales)? A rising rental-DOM trend means longer vacancies and softer asking-rent achievability than the comps imply.
- What's the recent tenant-quality profile in this submarket — average credit score on applications, eviction rate, late-payment / NSF rate, and stable-employment percentage? A property-management company in the area should have these aggregated.
- How much new for-sale + rental construction is in the pipeline within 1–3 miles? Heavy new supply typically softens prices + rents 12–24 months out; constrained supply supports both.
Investment metrics
- 1% rule
- 3.48% ✓
- Cap rate
- 30.74%
- Cash-on-cash
- 87.33%
- DSCR
- 4.89
- GRM
- 2.4
CMA / ARV
- ARV (median comp)
- $58,598
- List price
- $30,000
- Delta
- -48.80%
- Verdict
- UNDERPRICED
- Comps
- 20 within 1.0 mi
Show comp detail 12 sales within ~0.75 mi
| Address | Dist | Beds/Ba | Sqft | Sold | Price | $/sf | Match |
|---|---|---|---|---|---|---|---|
| 17743 Trinity St | 0.56mi | 2/1.0 | 662 (-3%) | 3mo | $85,000 | $128 | 68 |
| 18691 Shaftsbury Ave | 0.47mi | 2/1.0 | 692 (+2%) | 13mo | $46,000 | $66 | 64 |
| 18723 Warwick St | 0.54mi | 2/1.0 | 700 (+3%) | 8mo | $54,500 | $78 | 64 |
| 18274 Stout St | 0.18mi | 2/1.0 | 748 (+10%) | 17mo | $68,000 | $91 | 61 |
| 17370 Stout St | 0.48mi | 2/1.0 | 745 (+10%) | 2mo | $37,000 | $50 | 60 |
| 19352 Evergreen Rd | 0.52mi | 2/1.0 | 752 (+11%) | 2mo | $75,000 | $100 | 57 |
| 18411 Grandville Ave | 0.36mi | 2/1.0 | 748 (+10%) | 14mo | $60,000 | $80 | 55 |
| 19401 Stout St | 0.60mi | 2/1.0 | 750 (+10%) | 2mo | $28,000 | $37 | 53 |
| 18291 Warwick St | 0.50mi | 2/1.0 | 723 (+6%) | 17mo | $108,000 | $149 | 52 |
| 18659 Shaftsbury Ave | 0.46mi | 3/1.0 (+1) | 763 (+12%) | 10mo | $70,000 | $92 | 45 |
| 18538 Trinity St | 0.52mi | 3/1.0 (+1) | 780 (+15%) | 2mo | $46,500 | $60 | 45 |
| 17190-82 Kentfield St | 0.60mi | 2/1.0 | 770 (+13%) | 19mo | $42,800 | $56 | 34 |
Match score weights: distance 35% · size 25% · config 20% · recency 20%. Top-matched comps best support the ARV.
Projected returns pro-forma
-3.0% appreciation · 8.0% rent growth · sell at horizon
- IRR
- 93.5%
- Equity multiple
- 5.71×
- Total profit
- $39,605
- Equity at exit
- $4,473
- IRR
- 97.4%
- Equity multiple
- 14.07×
- Total profit
- $109,799
- Equity at exit
- $2,594
Cash invested: $8,400 (down + closing). Projections, not guarantees.
Landlord ↔ Tenant lean methodology
- Overall (STATE)
- 62 Landlord-Friendly
- State Michigan
- 62 Landlord-Friendly · EVEN
- County
- — inherits STATE
- City
- — inherits STATE
ZIP-level market 48219
- Home prices YoY
- -10.3%
- Rents YoY
- 8.0%
- Active inventory
- 305
- Price-to-rent
- 2.4×
Monthly cashflow live
- Estimated rent
- $1,044 high interval (Pro) →
- Mortgage (P&I)
- −$157
- Tax from tax record
- −$43 /mo · $520/yr
- Insurance
- −$12
- HOA
- −$0
- Vacancy / Maint / Mgmt
- −$219
- Net cashflow
- $611
Break-even live
UW: 25.0% down · 7.5% · 30yr · 1.5% tax · 5.0% vac · 8.0% maint · 8.0% mgmt
Financing live
Cash to close
- Down payment
- $7,500
- Closing costs
- $900
- Reserves months
- —
- Total cash needed
- —
Loan-product check · same deal, 3 products live
Conventional
25% down · 7.5% · 30yr
- Down + closing
- —
- Monthly P&I
- —
- Monthly cashflow
- —
- DSCR
- —
- Eligible?
- —
Personal DTI + credit; lowest rate.
DSCR
20% down · 8.5% · 30yr
- Down + closing
- —
- Monthly P&I
- —
- Monthly cashflow
- —
- DSCR
- —
- Eligible?
- —
No personal income docs; deal must DSCR.
Hard money
10% down · 12.0% · 12mo
- Down + closing
- —
- Monthly P&I
- —
- Monthly cashflow
- —
- DSCR
- —
- Eligible?
- —
Short-term bridge; refi at stabilization.
Rent comps 19 comps
| Address | Beds | Baths | Sqft | Rent | $/sqft | DOM | Units | Dist |
|---|---|---|---|---|---|---|---|---|
| 18274 Fielding St Detroit, MI | 2.0 | 1.0 | 700 | $1,200 | $1.71 | 17d | 1 | 0.25mi |
| 19372 Grandville Ave Detroit, MI | 2.0 | 1.5 | 733 | $1,050 | $1.43 | 15d | 1 | 0.67mi |
| 18025 Bentler St Detroit, MI | 3.0 | 1.0 | 728 | $1,250 | $1.72 | 24d | 1 | 0.79mi |
| 17274 Bentler St Detroit, MI | 2.0 | 1.0 | 700 | $838 | $1.20 | 24d | 2 | 0.87mi |
| 17274 Bentler St Detroit, MI | 2.0 | 1.0 | 700 | $850 | $1.21 | 44d | 2 | 0.87mi |
| 17270 Bentler St Detroit, MI | 2.0 | 1.0 | 650 | $850 | $1.31 | 44d | 1 | 0.87mi |
| 17274 Bentler St #46 Detroit, MI | 2.0 | 1.0 | 700 | $850 | $1.21 | 17d | 1 | 0.88mi |
| 18400 Lahser Rd Detroit, MI | 1.0 | 1.0 | 620 | $950 | $1.53 | 24d | 1 | 0.96mi |
| 18350 Lahser Rd Detroit, MI | 1.0 | 1.0 | 600 | $950 | $1.58 | 44d | 1 | 0.96mi |
| 18450 Lahser Rd Apt 1 Detroit, MI | 1.0 | 1.0 | 650 | $820 | $1.26 | 5d | 1 | 0.97mi |
| 17644 Lahser Rd Unit 7 Detroit, MI | 1.0 | 1.0 | 600 | $995 | $1.66 | 24d | 1 | 1.01mi |
| 18045 Lahser Rd Detroit, MI | 1.0 | 1.0 | 670 | $960 | $1.43 | 5d | 2 | 1.04mi |
| 16194 Fielding St Unit 2 Detroit, MI | 2.0 | 1.0 | 750 | $950 | $1.27 | 15d | 1 | 1.11mi |
| 16854 Lahser Rd Detroit, MI | 1.0 | 1.0 | 680 | $885 | $1.30 | 12d | 1 | 1.21mi |
| 16885 Lahser Rd Unit 1A Detroit, MI | 1.0 | 1.0 | 650 | $750 | $1.15 | 5d | 1 | 1.22mi |
| 16885 Lahser Rd Apt 3A Detroit, MI | 1.0 | 1.0 | 700 | $750 | $1.07 | 44d | 1 | 1.22mi |
| 18276 Oakfield St Detroit, MI | 2.0 | 1.0 | 726 | $1,175 | $1.62 | 44d | 1 | 1.25mi |
| 20068 Faust Ave Detroit, MI | 2.0 | 1.0 | 750 | $1,100 | $1.47 | 24d | 1 | 1.27mi |
| 16700 Lahser Rd Apt 18 Detroit, MI | 2.0 | 1.0 | 750 | $900 | $1.20 | 44d | 1 | 1.31mi |
Listing history 20 events
-
2026-06-15days on market $30,000 Active 35 DOM
-
2026-06-13days on market $30,000 Active 33 DOM
-
2026-06-13days on market $30,000 Active 32 DOM
-
2026-06-09days on market $30,000 Active 29 DOM
-
2026-06-08days on market $30,000 Active 28 DOM
-
2026-06-07days on market $30,000 Active 27 DOM
-
2026-06-04days on market $30,000 Active 24 DOM
-
2026-06-03days on market $30,000 Active 23 DOM
-
2026-06-02days on market $30,000 Active 22 DOM
-
2026-06-02price $30,000 Active 21 DOM
-
2026-06-01days on market $35,000 Active 21 DOM
-
2026-05-31days on market $35,000 Active 20 DOM
-
2026-05-11$35,000 Active 804-char remark
-
2026-05-11$35,000 Active 798-char remark
-
2026-03-31status Active
-
2026-03-31historical
-
2026-03-31historical
-
2026-03-31historical
-
2026-03-23$35,000 Active
-
2026-03-23$35,000 Active
ⓘ Source: listings_history table (triggers on properties + properties_extension) + one-shot
backfill from property_details.listing_events for pre-trigger history.
Tax reassessment forecast MI · Partial reset (capped growth)
- Current annual tax
- $520 · $43/mo
- Projected year-2 tax
- $520 · $43/mo
- Expected delta
- $0/yr ($0/mo · 0.0%)
ⓘ Screening estimate from a state-policy table — verify with the county assessor before closing.
Climate risk First Street
- Flood 4/10 Moderate FEMA zone X (unshaded) · 20% chance over 30 yrs
- Wildfire 1/10 Low
- Heat 3/10 Moderate 7 d/yr ≥98°F today · 15 d/yr by 30 yrs out
- Wind 2/10 Low
- Air quality 3/10 Moderate 2 unhealthy d/yr today · 5 by 30 yrs out
Nearby sold comps map
Loading sold comps map…
Walkable amenities ~0.75 mi
Loading nearby amenities…
Taxation est. · year 1
- Rental income
- $12,522
- − Mortgage interest
- −$1,680
- − Property taxes
- −$520
- − Insurance
- −$150
- − Repairs & maintenance
- −$1,002
- − Management
- −$1,002
- − Depreciation
- −$873
- Taxable income
- $7,296
- Est. tax owed @ 24.0%
- −$1,751
- After-tax cash flow
- $5,584/yr
For passive investors: Depreciation is non-cash, so a rental often shows a tax loss while cash-flowing — sheltering income. Rental losses are passive: they offset passive income freely, and up to $25,000/yr can offset ordinary (W-2) income if you actively participate and your MAGI is under $100k (phasing out to $0 by $150k); unused losses carry forward. On sale, claimed depreciation is recaptured at up to 25%, and gains may owe capital-gains tax (a 1031 exchange can defer both). Figures are a year-1 estimate at your 24.0% rate — not tax advice; consult a CPA.
Schools (NCES district)
- District
- Detroit Public Schools Community District
- NCES district ID
- 2601103
- Math proficiency
- 10% ▼ -2.00%
- Reading proficiency
- 24% ▲ 6.00%
- Median HH income
- $25,815
- Composite
- 13.06/100
- National rank
- #9564
- State rank
- #499 of 540 in MI
Livability — Detroit
- Score
- 73/100
- State rank
- #218
- US rank
- #5427
Category grades
Schools grade is shown separately in the Schools card above.
Census & demographics
- Census place
- Detroit, MI
- County
- Wayne County · 1,562,939 people
- City population
- 572,865
- Metro
- Detroit-Warren-Dearborn, MI
- Population (ZIP)
- 47,208
- Household income
- $43,655
- Rent vs Own
- Severe rent burden
- 3584.0
Population outlook (Wayne County) Hauer SSP2
- Today (2025)
- 1,675,273 people
- By 2030
- 1,620,300 · -3.3%
- By 2040
- 1,502,341 · -10.3%
- By 2050
- 1,384,039 · -17.4%
- By 2075
- 1,124,592 · -32.9%
- By 2100
- 881,193 · -47.4%
Race, ethnicity, and origin ACS 2023
- Neighborhood character
- Predominantly Black (88%)
- Race & ethnicity
- Black 88% White 5% Two or more races 4% Hispanic / Latino 1%
- Common ancestry
- Romanian 1% Lithuanian 1%
- Foreign-born
- 2% · Canada
- Languages at home
- 96% English-only · Spanish 1% French/Haitian/Cajun 1%
Political lean MEDSL · Wayne
- 2024 margin
- Strong D (+29.0) · D 62.7% · R 33.7% · Other 3.6%
- 2008→2024 swing
- -20.5pp toward R · 2008: 49.5pp · 2024: 29.0pp
- All cycles
- 2024: D+29.0 2020: D+38.1 2016: D+37.3 2012: D+46.9 2008: D+49.5
Not yet ingested
- Civics
- —
Market trends
- HPI YoY
- ▼ -65.06%
- Current HPI
- 563.3263
- Rent YoY
- ▲ 8.04%
- Metro
- Detroit-Warren-Dearborn, MI
- State GDP YoY
- ▲ 1.37%
- F500 in state
- 28
Industry mix (Fortune 500 HQ in MI)
| Industry | F500 HQs | Revenue |
|---|---|---|
| Automotive Parts | 3 | $48B |
|
||
| Automotive | 2 | $372B |
|
||
| Chemicals | 1 | $45B |
|
||
| Automotive Retail | 1 | $29B |
|
||
| Healthcare / Medical Devices | 1 | $23B |
|
||
| Automotive Technology | 1 | $20B |
|
||
Price history
-14.3% since first listed12 events — show timeline
- 2026-06-16 Listing Removed — REALCOMP
- 2026-06-16 Listing Removed — MiRealSource-MiMLS
- 2026-06-02 Price Changed $30,000 MiRealSource-MiMLS
- 2026-06-01 Price Changed $30,000 REALCOMP
- 2026-05-11 Listed $35,000 REALCOMP
- 2026-05-11 Listed $35,000 MiRealSource-MiMLS
- 2026-03-31 Relisted — REALCOMP
- 2026-03-31 Listing Removed — MiRealSource-MiMLS
- 2026-03-31 Listing Removed — REALCOMP
- 2026-03-31 Listing Removed — REALCOMP
- 2026-03-23 Listed $35,000 REALCOMP
- 2026-03-23 Listed $35,000 MiRealSource-MiMLS
Property tax history
+1.3%/yrLatest (2025): $520 · -2.6% YoY. Source: county tax records.
Cash-flow waterfall
monthlySold comps — $/sqft
last 12 mo · ≤1 miLoading sold comps…