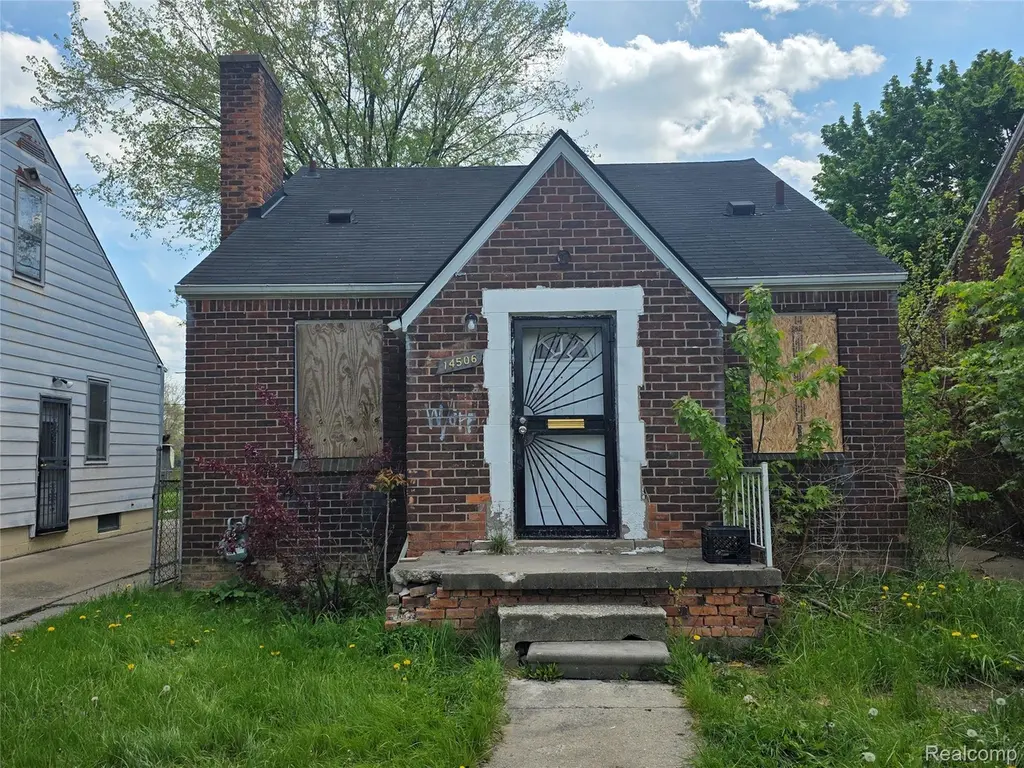
14506 Mapleridge St · Detroit, MI
Flood risk 1/10 · Minimal
- FEMA flood zone
- X (unshaded)
- Chance of flooding over 30 yrs
- 0.0%
- Est. flood insurance / yr
- $473 – $860
Fire risk 1/10 · Minimal
- Est. fire insurance / yr
- $784 – $1,456
Heat risk 3/10 · Minor
- Hot days now (above 95°F)
- 7 days/yr
- Hot days in 30 yrs
- 14 days/yr
Wind risk 2/10 · Minimal
- Chance of severe wind over 30 yrs
- —
Air-quality risk 3/10 · Minor
- Unhealthy air days now
- 2 days/yr
- Unhealthy air days in 30 yrs
- 5 days/yr
Risk factors via First Street. Map © Google.
Why this score? — see what drove the B grade
The composite is a weighted blend of 9 inputs, each scored 0–100. Each bar is that input's sub-score; the figure is the points it added to the 100-point composite (weight × sub-score).
- Cash flow +30.0/30.0
- ARV discount +14.0/15.0
- 1% rule +10.0/10.0
- DSCR +10.0/10.0
- Livability +3.7/5.0
- Rent growth +2.8/5.0
- Condition / age +2.5/5.0
- Schools +1.3/10.0
- Appreciation +0.0/10.0
$49,900
🖨 Deal sheet 📄 Offer letter ✓ Due diligence
Listing remarks MLS
* * INVESTORS * * Add this 3 bedroom, 1 bathroom brick bungalow to your portfolio today! Similar 3 bedroom bungalows in the area rent to Section 8 tenants for $1,200-1,350/month, providing excellent cash flow and ROI! The property requires a full rehab, but does feature desirable characteristics such as forced air heating, hardwood flooring under the current flooring in most rooms, a roof with 3 tab shingles that appear to be in decent condition, an updated 100 amp electrical panel, and an original tile bathroom that could likely be salvaged with minimal cost! Located in an improving area of the city, where most of the vacant and dangerous properties have been torn down already! CASH OR HARD MONEY ONLY, NO SELLER FINANCING
Key facts
- Hardwood flooring
- Brick bungalow
- Forced air heating
Tags
Property features AI
Exterior
- Parking: No garage
- Utilities: Public water; Public sewer; Water and sewer available
- Home design: Single-family residence; One-and-a-half story; Ground-level entry with steps; Brick construction
- Construction: Asphalt roof; Block foundation
- Exterior features: Front porch; Paved road access; Sidewalks in the community
Interior
- Kitchen: Gas water heater (appliance listed)
- Bedrooms: Total of 5 rooms (includes bedrooms and other living spaces)
- Bathrooms: 1 full bathroom
- Heating & cooling: Forced air heating (natural gas); No central cooling
- Interior features: Wood-burning fireplace in the living room; Unfinished basement
- Laundry & utility: Has heating via forced air (natural gas)
Neighborhood map
What this means for you Summary
Snapshot
- This is a 3-bed/1.0-bath single-family listed at $50k.
Deal economics
- At list price, monthly cash flow is $643 ($8k/yr) — positive.
- The deal already cash-flows at list — no discount required.
- Meets the 1% rule at list price ($1k rent vs $50k).
- Recommended offer: $48k (3.0% below list) — sets the bar for market timing.
- Cap rate 21.7% vs local median 10.2% in Detroit — top-decile yield for the area; either an underpriced asset or a hidden risk that comps aren't pricing in. Stress-test before assuming the spread holds.
Location & tenants
- Location reads 73/100 on livability (#218 in MI) — a middle-class / working-renter tenant base. Strengths: amenities A+, commute A+, cost of living A+; Watch: schools F, crime F, employment F.
- Detroit Public Schools Community District (urban): math 10% / reading 24% proficiency, ranked #499 of 540 in MI (top 92%) — low school quality limits family demand, transient renter base, plan for 1-2y turnover; 90% free/reduced lunch — lower-income household profile, screen leases tightly.
- Market conditions: Rents rising (+1.3%/yr); 373 active listings in the ZIP; 40 comparable units currently listed for rent nearby; rentals at typical pace (median 18d on market — plan ~3-4 weeks tenant-placement turnaround); lower-income renter base — watch delinquency; 2,639 units permitted in Wayne County in 2024 (1,216 in 5+ unit buildings).
- This rent runs 41% of the median local income ($39k/yr) — at the standard rent-burdened threshold; future hikes will face affordability resistance.
Forward outlook
- Local home prices are declining (-3.0%/yr); year-one equity from $345 of loan paydown is wiped out by about $1k of value loss. Plan a longer hold.
- Wayne County population projected at -17% by 2050 — secular population decline; favor cash flow + early exit over multi-decade hold.
- At projected returns (-3.0% appreciation + 1.3% rent growth), your $14k cash investment doubles in ~3 years — after that, you're playing with house money.
Negotiation context
- It's been on market 35 days — a 3% lower offer ($48k) is reasonable based on typical stale-listing flexibility.
- 6 sale attempts since 9y ago; this cycle's ask has dropped $5k (9%) from the opening price — seller is motivated, your offer sets the floor, not the list.
- Current owner paid $25k; list at $50k implies a 100% gain — meaningful room to come down on a strong offer.
Risks & watch-outs
- Watch-outs: property tax is 3.0% of price; built in 1941 — expect roof / HVAC / electrical / plumbing capex.
Questions for the listing agent
- It's been on market 35 days. Have you received any prior offers? Is the seller open to a 3% concession, seller financing, or rate buy-down credit?
- Built in 1941 — when were the roof, HVAC, electrical panel, plumbing, and water heater last replaced?
- Property tax is high relative to price — has the assessment been appealed recently, and will the sale trigger a re-assessment?
- Is there a deadline driving the sale (1031 exchange, divorce, estate, relocation)? That informs how much negotiation room exists.
- Schools are F-rated, which usually means shorter tenancies and higher turnover. Who's the typical renter profile here, and what's been the actual vacancy rate?
- Crime grade is F in this area — have there been break-ins, vandalism, or insurance claims at this property in the last 3 years? What carrier currently insures it and at what premium?
- What's the average days-on-market for RENTAL listings here right now (not sales)? A rising rental-DOM trend means longer vacancies and softer asking-rent achievability than the comps imply.
- What's the recent tenant-quality profile in this submarket — average credit score on applications, eviction rate, late-payment / NSF rate, and stable-employment percentage? A property-management company in the area should have these aggregated.
- How much new for-sale + rental construction is in the pipeline within 1–3 miles? Heavy new supply typically softens prices + rents 12–24 months out; constrained supply supports both.
Investment metrics
- 1% rule
- 2.66% ✓
- Cap rate
- 21.75%
- Cash-on-cash
- 55.20%
- DSCR
- 3.46
- GRM
- 3.1
CMA / ARV
- ARV (median comp)
- $58,389
- List price
- $49,900
- Delta
- -14.54%
- Verdict
- UNDERPRICED
- Comps
- 20 within 1.0 mi
Show comp detail 12 sales within ~0.75 mi
| Address | Dist | Beds/Ba | Sqft | Sold | Price | $/sf | Match |
|---|---|---|---|---|---|---|---|
| 15018 Seymour St | 0.32mi | 3/1.0 | 1,094 (+1%) | 6mo | $68,500 | $63 | 79 |
| 15256 Fordham St | 0.60mi | 3/1.5 | 1,099 (+1%) | 3mo | $60,000 | $55 | 66 |
| 14728 Wilfred St | 0.70mi | 3/1.0 | 1,050 (-4%) | 3mo | $30,500 | $29 | 59 |
| 15017 Lappin St | 0.68mi | 3/1.0 | 1,008 (-7%) | 2mo | $60,000 | $60 | 54 |
| 15435 Troester St | 0.59mi | 3/1.5 | 1,177 (+8%) | 5mo | $120,000 | $102 | 53 |
| 15416 Eastwood St | 0.63mi | 3/1.0 | 1,211 (+11%) | 2mo | $70,000 | $58 | 50 |
| 15260 Faircrest St | 0.51mi | 2/1.0 (-1) | 942 (-13%) | 1mo | $35,000 | $37 | 48 |
| 11993 Payton St | 0.75mi | 3/1.0 | 1,019 (-6%) | 8mo | $49,000 | $48 | 48 |
| 15276 Seymour St | 0.50mi | 3/1.5 | 1,225 (+13%) | 7mo | $107,000 | $87 | 48 |
| 14504 Coram St | 0.63mi | 3/1.5 | 984 (-10%) | 7mo | $53,000 | $54 | 47 |
| 15411 Young St St | 0.63mi | 3/1.5 | 1,240 (+14%) | 2mo | $95,000 | $77 | 44 |
| 15419 Young St | 0.64mi | 3/1.0 | 1,250 (+15%) | 3mo | $54,500 | $44 | 43 |
Match score weights: distance 35% · size 25% · config 20% · recency 20%. Top-matched comps best support the ARV.
Projected returns pro-forma
-3.0% appreciation · 1.33% rent growth · sell at horizon
- IRR
- 51.5%
- Equity multiple
- 3.20×
- Total profit
- $30,707
- Equity at exit
- $7,440
- IRR
- 56.1%
- Equity multiple
- 6.08×
- Total profit
- $70,966
- Equity at exit
- $4,314
Cash invested: $13,972 (down + closing). Projections, not guarantees.
Landlord ↔ Tenant lean methodology
- Overall (STATE)
- 62 Landlord-Friendly
- State Michigan
- 62 Landlord-Friendly · EVEN
- County
- — inherits STATE
- City
- — inherits STATE
ZIP-level market 48205
- Home prices YoY
- -28.1%
- Rents YoY
- 1.3%
- Active inventory
- 373
- Price-to-rent
- 3.1×
Monthly cashflow live
- Estimated rent
- $1,329 high interval (Pro) →
- Mortgage (P&I)
- −$262
- Tax from tax record
- −$125 /mo · $1,499/yr
- Insurance
- −$21
- HOA
- −$0
- Vacancy / Maint / Mgmt
- −$279
- Net cashflow
- $643
Break-even live
UW: 25.0% down · 7.5% · 30yr · 1.5% tax · 5.0% vac · 8.0% maint · 8.0% mgmt
Financing live
Cash to close
- Down payment
- $12,475
- Closing costs
- $1,497
- Reserves months
- —
- Total cash needed
- —
Loan-product check · same deal, 3 products live
Conventional
25% down · 7.5% · 30yr
- Down + closing
- —
- Monthly P&I
- —
- Monthly cashflow
- —
- DSCR
- —
- Eligible?
- —
Personal DTI + credit; lowest rate.
DSCR
20% down · 8.5% · 30yr
- Down + closing
- —
- Monthly P&I
- —
- Monthly cashflow
- —
- DSCR
- —
- Eligible?
- —
No personal income docs; deal must DSCR.
Hard money
10% down · 12.0% · 12mo
- Down + closing
- —
- Monthly P&I
- —
- Monthly cashflow
- —
- DSCR
- —
- Eligible?
- —
Short-term bridge; refi at stabilization.
Rent comps 40 comps
| Address | Beds | Baths | Sqft | Rent | $/sqft | DOM | Units | Dist |
|---|---|---|---|---|---|---|---|---|
| 15010 Cedargrove St Detroit, MI | 3.0 | 1.5 | 1018 | $1,350 | $1.33 | 43d | 1 | 0.38mi |
| 14201 Mayfield St Detroit, MI | 4.0 | 1.5 | 1296 | $1,250 | $0.96 | 43d | 1 | 0.50mi |
| 14481 Maddelein St Detroit, MI | 3.0 | 1.0 | 1200 | $1,100 | $0.92 | 43d | 1 | 0.50mi |
| 15000 Mayfield St Detroit, MI | 3.0 | 1.0 | 1146 | $970 | $0.85 | 17d | 1 | 0.55mi |
| 14461 Lappin St Detroit, MI | 3.0 | 1.5 | 989 | $1,150 | $1.16 | 17d | 1 | 0.57mi |
| 15494 Mapleridge St Detroit, MI | 3.0 | 1.0 | 937 | $1,275 | $1.36 | 43d | 1 | 0.62mi |
| 14504 Coram St Detroit, MI | 3.0 | 1.0 | 1203 | $1,175 | $0.98 | 24d | 1 | 0.62mi |
| 13218 Greiner St Detroit, MI | 3.0 | 1.0 | 1162 | $1,195 | $1.03 | 17d | 1 | 0.81mi |
| 15616 E 7 Mile Rd Detroit, MI | 3.0 | 1.5 | 1150 | $1,150 | $1.00 | 17d | 1 | 0.81mi |
| 13669 Pfent St Detroit, MI | 3.0 | 2.0 | 1031 | $1,374 | $1.33 | 17d | 1 | 0.83mi |
| 18119 Joann St Detroit, MI | 2.0 | 1.0 | 800 | $1,100 | $1.38 | 24d | 1 | 0.87mi |
| 15604 Coram St Detroit, MI | 3.0 | 1.0 | 1210 | $1,000 | $0.83 | 43d | 1 | 0.89mi |
| 18624 Fairport St Unit NA Detroit, MI | 3.0 | 1.0 | 924 | $1,450 | $1.57 | 24d | 1 | 0.93mi |
| 18624 Fairport St Detroit, MI | 3.0 | 1.0 | 874 | $1,450 | $1.66 | 21d | 1 | 0.93mi |
| 19220 Alcoy St Detroit, MI | 3.0 | 1.0 | 1023 | $1,350 | $1.32 | 17d | 1 | 0.95mi |
| 19170 Joann St Detroit, MI | 4.0 | 1.0 | 1020 | $1,400 | $1.37 | 43d | 1 | 0.98mi |
| 12740 August St Detroit, MI | 2.0 | 1.0 | 900 | $1,300 | $1.44 | 5d | 1 | 0.98mi |
| 15909 Maddelein St Detroit, MI | 3.0 | 1.0 | 894 | $1,266 | $1.42 | 43d | 1 | 1.02mi |
| 16031 E 7 Mile Rd #5 Detroit, MI | 2.0 | 1.0 | 1204 | $1,200 | $1.00 | 2d | 1 | 1.02mi |
| 19143 Fairport St Detroit, MI | 3.0 | 1.0 | 1070 | $1,225 | $1.14 | 17d | 1 | 1.05mi |
| 12716 Riad St Detroit, MI | 3.0 | 1.0 | 974 | $1,275 | $1.31 | 17d | 1 | 1.06mi |
| 11018 Whitehill St Detroit, MI | 3.0 | 1.0 | 1146 | $1,450 | $1.27 | 10d | 1 | 1.10mi |
| 11911 Lansdowne St Detroit, MI | 4.0 | 1.0 | 1350 | $1,400 | $1.04 | 43d | 1 | 1.10mi |
| 10813 Whitehill St Detroit, MI | 3.0 | 1.0 | 1392 | $1,350 | $0.97 | 17d | 1 | 1.12mi |
| 12840 Kilbourne St Detroit, MI | 3.0 | 1.0 | 1136 | $1,350 | $1.19 | 17d | 1 | 1.13mi |
| 19207 Westphalia St Detroit, MI | 4.0 | 1.0 | 1179 | $1,800 | $1.53 | 17d | 1 | 1.13mi |
| 16212 Maddelein St Detroit, MI | 2.0 | 1.0 | 800 | $1,200 | $1.50 | 12d | 1 | 1.14mi |
| 18703 Waltham St Detroit, MI | 2.0 | 1.0 | 1000 | $1,100 | $1.10 | 43d | 1 | 1.15mi |
| 11689 Wayburn St Detroit, MI | 3.0 | 1.0 | 1142 | $1,350 | $1.18 | 43d | 1 | 1.16mi |
| 10724 Whitehill St Detroit, MI | 3.0 | 3.0 | 1425 | $1,550 | $1.09 | 17d | 1 | 1.17mi |
| 19419 Westphalia St Detroit, MI | 3.0 | 1.0 | 1293 | $1,325 | $1.02 | 17d | 1 | 1.20mi |
| 18530 Kingsville St Harper Woods, MI | 3.0 | 1.5 | 1396 | $1,375 | $0.98 | 17d | 1 | 1.20mi |
| 18681 Barlow St Detroit, MI | 3.0 | 1.0 | 1041 | $1,400 | $1.34 | 24d | 1 | 1.21mi |
| 10644 Stratman St Detroit, MI | 2.0 | 1.0 | 1000 | $1,200 | $1.20 | 17d | 1 | 1.21mi |
| 19610 Westphalia St Detroit, MI | 3.0 | 1.0 | 1200 | $1,595 | $1.33 | 17d | 1 | 1.24mi |
| 11620 Rossiter St Detroit, MI | 3.0 | 1.0 | 1140 | $1,200 | $1.05 | 17d | 1 | 1.25mi |
| 11611 Morang Ave Detroit, MI | 1.0–2.0 | 1.0 | 709 | $1,040 | $1.47 | 43d | 1 | 1.28mi |
| 11776 Rossiter St Detroit, MI | 3.0 | 1.0 | 964 | $1,150 | $1.19 | 11d | 1 | 1.30mi |
| 10803 Roxbury St Detroit, MI | 3.0 | 1.0 | 1150 | $900 | $0.78 | 20d | 1 | 1.30mi |
| 14134 Collingham Dr Detroit, MI | 3.0 | 1.5 | 1300 | $1,350 | $1.04 | 43d | 1 | 1.31mi |
Listing history 28 events
-
2026-06-18days on market $49,900 Active 35 DOM
-
2026-06-17days on market $49,900 Active 34 DOM
-
2026-06-15days on market $49,900 Active 32 DOM
-
2026-06-13days on market $49,900 Active 30 DOM
-
2026-06-13pricedays on market $49,900 Active 29 DOM
-
2026-06-09days on market $54,900 Active 26 DOM
-
2026-06-08days on market $54,900 Active 25 DOM
-
2026-06-07days on market $54,900 Active 24 DOM
-
2026-06-04days on market $54,900 Active 21 DOM
-
2026-06-03days on market $54,900 Active 20 DOM
-
2026-06-02days on market $54,900 Active 19 DOM
-
2026-06-01days on market $54,900 Active 18 DOM
-
2026-05-31days on market $54,900 Active 17 DOM
-
2026-05-14$54,900 Active 735-char remark
Show marketing remark (735 chars)
* * INVESTORS * * Add this 3 bedroom, 1 bathroom brick bungalow to your portfolio today! Similar 3 bedroom bungalows in the area rent to Section 8 tenants for $1,200-1,350/month, providing excellent cash flow and ROI! The property requires a full rehab, but does feature desirable characteristics such as forced air heating, hardwood flooring under the current flooring in most rooms, a roof with 3 tab shingles that appear to be in decent condition, an updated 100 amp electrical panel, and an original tile bathroom that could likely be salvaged with minimal cost! Located in an improving area of the city, where most of the vacant and dangerous properties have been torn down already! CASH OR HARD MONEY ONLY, NO SELLER FINANCING
-
2022-05-27price $950
-
2021-08-03soldstatus $25,000 Sold
Show marketing remark (153 chars)
3 bedroom brick bungalow with full basement that is ready for a half bath. Fireplace in the living room. Covered front porch. Spacious, fenced back yard.
-
2021-08-03soldstatus $25,000 Closed
Show marketing remark (153 chars)
3 bedroom brick bungalow with full basement that is ready for a half bath. Fireplace in the living room. Covered front porch. Spacious, fenced back yard.
-
2021-07-01status Pending
Show marketing remark (153 chars)
3 bedroom brick bungalow with full basement that is ready for a half bath. Fireplace in the living room. Covered front porch. Spacious, fenced back yard.
-
2021-07-01status Pending
Show marketing remark (153 chars)
3 bedroom brick bungalow with full basement that is ready for a half bath. Fireplace in the living room. Covered front porch. Spacious, fenced back yard.
-
2021-06-16$29,900 Active
Show marketing remark (153 chars)
3 bedroom brick bungalow with full basement that is ready for a half bath. Fireplace in the living room. Covered front porch. Spacious, fenced back yard.
-
2021-06-16$29,900 Active
Show marketing remark (153 chars)
3 bedroom brick bungalow with full basement that is ready for a half bath. Fireplace in the living room. Covered front porch. Spacious, fenced back yard.
-
2017-12-01soldstatus $24,000 Sold
-
2017-12-01soldstatus $24,000 Closed
-
2017-10-30status Pending
-
2017-10-30status Pending
-
2017-10-10$24,900 Active
-
2017-10-10$24,900 Active
ⓘ Source: listings_history table (triggers on properties + properties_extension) + one-shot
backfill from property_details.listing_events for pre-trigger history.
Tax reassessment forecast MI · Partial reset (capped growth)
- Current annual tax
- $1,499 · $125/mo
- Projected year-2 tax
- $1,499 · $125/mo
- Expected delta
- $0/yr ($0/mo · 0.0%)
ⓘ Screening estimate from a state-policy table — verify with the county assessor before closing.
Climate risk First Street
- Flood 1/10 Low FEMA zone X (unshaded) · 0% chance over 30 yrs
- Wildfire 1/10 Low
- Heat 3/10 Moderate 7 d/yr ≥95°F today · 14 d/yr by 30 yrs out
- Wind 2/10 Low
- Air quality 3/10 Moderate 2 unhealthy d/yr today · 5 by 30 yrs out
Nearby sold comps map
Loading sold comps map…
Walkable amenities ~0.75 mi
Loading nearby amenities…
Taxation est. · year 1
- Rental income
- $15,950
- − Mortgage interest
- −$2,795
- − Property taxes
- −$1,499
- − Insurance
- −$250
- − Repairs & maintenance
- −$1,276
- − Management
- −$1,276
- − Depreciation
- −$1,452
- Taxable income
- $7,403
- Est. tax owed @ 24.0%
- −$1,777
- After-tax cash flow
- $5,935/yr
For passive investors: Depreciation is non-cash, so a rental often shows a tax loss while cash-flowing — sheltering income. Rental losses are passive: they offset passive income freely, and up to $25,000/yr can offset ordinary (W-2) income if you actively participate and your MAGI is under $100k (phasing out to $0 by $150k); unused losses carry forward. On sale, claimed depreciation is recaptured at up to 25%, and gains may owe capital-gains tax (a 1031 exchange can defer both). Figures are a year-1 estimate at your 24.0% rate — not tax advice; consult a CPA.
Schools (NCES district)
- District
- Detroit Public Schools Community District
- NCES district ID
- 2601103
- Math proficiency
- 10% ▼ -2.00%
- Reading proficiency
- 24% ▲ 6.00%
- Median HH income
- $25,815
- Composite
- 13.06/100
- National rank
- #9564
- State rank
- #499 of 540 in MI
Livability — Detroit
- Score
- 73/100
- State rank
- #218
- US rank
- #5427
Category grades
Schools grade is shown separately in the Schools card above.
Census & demographics
- Census place
- Detroit, MI
- County
- Wayne County · 1,562,939 people
- City population
- 572,865
- Metro
- Detroit-Warren-Dearborn, MI
- Population (ZIP)
- 34,187
- Household income
- $38,966
- Rent vs Own
- Severe rent burden
- 2121.0
Population outlook (Wayne County) Hauer SSP2
- Today (2025)
- 1,675,273 people
- By 2030
- 1,620,300 · -3.3%
- By 2040
- 1,502,341 · -10.3%
- By 2050
- 1,384,039 · -17.4%
- By 2075
- 1,124,592 · -32.9%
- By 2100
- 881,193 · -47.4%
Race, ethnicity, and origin ACS 2023
- Neighborhood character
- Predominantly Black (93%)
- Race & ethnicity
- Black 93% White 3% Two or more races 2%
- Foreign-born
- 1% · Canada
- Languages at home
- 98% English-only · Spanish 1%
Political lean MEDSL · Wayne
- 2024 margin
- Strong D (+29.0) · D 62.7% · R 33.7% · Other 3.6%
- 2008→2024 swing
- -20.5pp toward R · 2008: 49.5pp · 2024: 29.0pp
- All cycles
- 2024: D+29.0 2020: D+38.1 2016: D+37.3 2012: D+46.9 2008: D+49.5
Not yet ingested
- Civics
- —
Market trends
- HPI YoY
- ▼ -91.80%
- Current HPI
- 235.0926
- Rent YoY
- ▲ 1.33%
- Metro
- Detroit-Warren-Dearborn, MI
- State GDP YoY
- ▲ 1.37%
- F500 in state
- 28
Industry mix (Fortune 500 HQ in MI)
| Industry | F500 HQs | Revenue |
|---|---|---|
| Automotive Parts | 3 | $48B |
|
||
| Automotive | 2 | $372B |
|
||
| Chemicals | 1 | $45B |
|
||
| Automotive Retail | 1 | $29B |
|
||
| Healthcare / Medical Devices | 1 | $23B |
|
||
| Automotive Technology | 1 | $20B |
|
||
Price history
+100.4% since first listed17 events — show timeline
- 2026-06-11 Price Changed $49,900 MiRealSource-MiMLS
- 2026-06-10 Price Changed $49,900 REALCOMP
- 2026-05-14 Listed $54,900 REALCOMP
- 2026-05-14 Listed $54,900 MiRealSource-MiMLS
- 2022-05-27 Price Changed $950 RENT.
- 2021-08-03 Sold (MLS) $25,000 MiRealSource-MiMLS
- 2021-08-03 Sold (MLS) $25,000 REALCOMP
- 2021-07-01 Pending — MiRealSource-MiMLS
- 2021-07-01 Pending — REALCOMP
- 2021-06-16 Listed $29,900 MiRealSource-MiMLS
- 2021-06-16 Listed $29,900 REALCOMP
- 2017-12-01 Sold (MLS) $24,000 MiRealSource-MiMLS
- 2017-12-01 Sold (MLS) $24,000 REALCOMP
- 2017-10-30 Pending — MiRealSource-MiMLS
- 2017-10-30 Pending — REALCOMP
- 2017-10-10 Listed $24,900 MiRealSource-MiMLS
- 2017-10-10 Listed $24,900 REALCOMP
Property tax history
+0.8%/yrLatest (2025): $1,499 · +46.5% YoY. Source: county tax records.
Cash-flow waterfall
monthlySold comps — $/sqft
last 12 mo · ≤1 miLoading sold comps…