2113 Mcculloh St · Baltimore, MD
Flood risk 1/10 · Minimal
- FEMA flood zone
- X (unshaded)
- Chance of flooding over 30 yrs
- 0.0%
- Est. flood insurance / yr
- $473 – $860
Fire risk 1/10 · Minimal
- Est. fire insurance / yr
- $755 – $1,403
Heat risk 7/10 · Major
- Hot days now (above 103°F)
- 7 days/yr
- Hot days in 30 yrs
- 15 days/yr
Wind risk 6/10 · Moderate
- Chance of severe wind over 30 yrs
- 27.0%
Air-quality risk 4/10 · Minor
- Unhealthy air days now
- 6 days/yr
- Unhealthy air days in 30 yrs
- 7 days/yr
Risk factors via First Street. Map © Google.
Why this score? — see what drove the C+ grade
The composite is a weighted blend of 9 inputs, each scored 0–100. Each bar is that input's sub-score; the figure is the points it added to the 100-point composite (weight × sub-score).
- Cash flow +26.4/30.0
- 1% rule +9.6/10.0
- DSCR +9.0/10.0
- ARV discount +8.2/15.0
- Rent growth +4.2/5.0
- Livability +3.8/5.0
- Condition / age +2.5/5.0
- Schools +1.0/10.0
- Appreciation +0.0/10.0
$119,900
🖨 Deal sheet 📄 Offer letter ✓ Due diligence
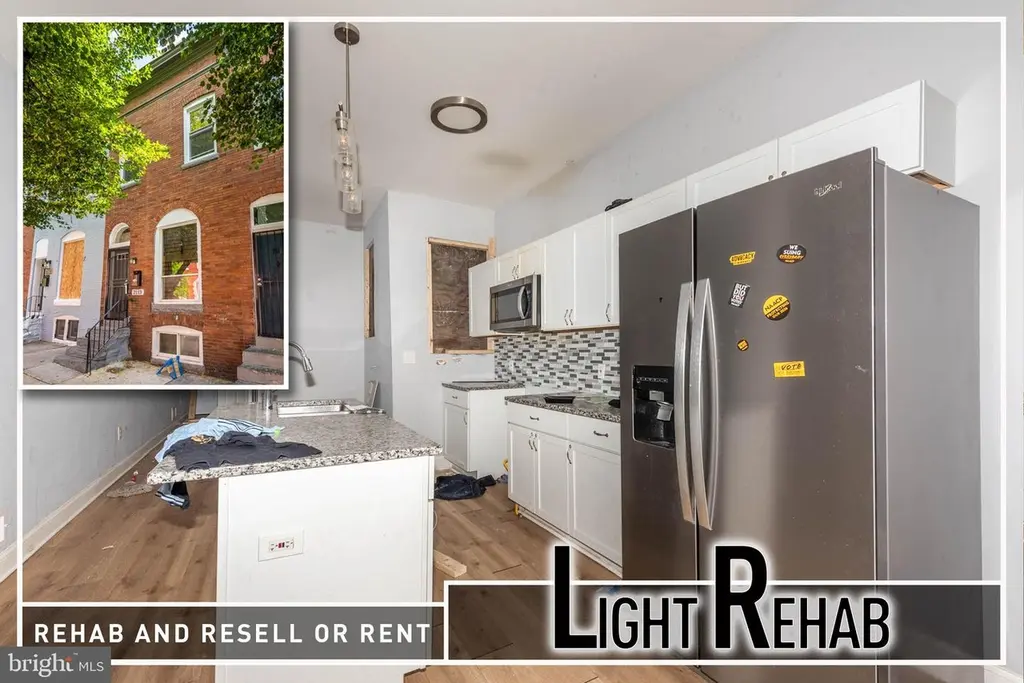
Listing remarks
Calling all investors and savvy buyers looking for their next opportunity! This value-packed property is the perfect light rehab project for an investor looking to expand their rental portfolio or renovate and resell. Featuring wood flooring throughout the main level, this home offers an open and functional floor plan with a spacious living room, an island kitchen complete with granite countertops, stainless steel appliances, and tile backsplash, plus a convenient main level full bath. The upper level includes 3 bedrooms and an additional full bath, while the unfinished basement provides excellent storage space and potential for future finishing. With solid bones and cosmetic updates needed
Key facts
- Wood flooring
- Island kitchen
- Unfinished basement
Tags
Property features AI
Exterior
- Parking: On-street parking
- Utilities: Public water; Public sewer; Electric service
- Home design: Brick construction
- Construction: Brick exterior; Other type foundation
- Exterior features: Interior townhouse/rowhouse; No tidal water
Interior
- Kitchen: Kitchen equipped with refrigerator, microwave, and disposal
- Bedrooms: Three bedrooms on the upper level
- Bathrooms: Two full bathrooms (one on main level, one on upper level)
- Heating & cooling: Forced air heating (natural gas); Central air conditioning (electric); Electric hot water
- Interior features: Unfinished basement; Disposal; Refrigerator; Microwave
Neighborhood map
What this means for you Summary
Snapshot
- This is a 3-bed/2.0-bath townhouse listed at $120k.
Deal economics
- At list price, monthly cash flow is $313 ($4k/yr) — positive.
- The deal already cash-flows at list — no discount required.
- Meets the 1% rule at list price ($2k rent vs $120k).
- Recommended offer: $116k (3.0% below list) — sets the bar for market timing.
- Cap rate 9.4% vs local median 6.0% in Baltimore — top-decile yield for the area; either an underpriced asset or a hidden risk that comps aren't pricing in. Stress-test before assuming the spread holds.
Location & tenants
- Location reads 76/100 on livability (#90 in MD, #3,396 nationally) — a middle-class / working-renter tenant base. Strengths: amenities A+, commute A+, housing A+; Watch: schools D, crime F.
- Baltimore City Public Schools (urban): math 7% / reading 16% proficiency, ranked #24 of 24 in MD (top 100%) — low school quality limits family demand, transient renter base, plan for 1-2y turnover; 79% free/reduced lunch — lower-income household profile, screen leases tightly.
- Market conditions: Rents rising fast (+6.6%/yr); 331 active listings in the ZIP; 40 comparable units currently listed for rent nearby; rentals at typical pace (median 24d on market — plan ~3-4 weeks tenant-placement turnaround); 48% of comp listings sitting > 30 days — soft ceiling on asking rent; lower-income renter base — watch delinquency; 1,273 units permitted in Baltimore city in 2024 (1,104 in 5+ unit buildings).
- At $1,750/mo this rent would consume 55% of the median local household income ($38k/yr) (locally 2921% of renters already pay >50% of income on rent) — very limited rent-growth headroom before tenants either downsize or default.
Forward outlook
- Local home prices are declining (-3.0%/yr); year-one equity from $829 of loan paydown is wiped out by about $4k of value loss. Plan a longer hold.
- Baltimore County population projected to shrink 4% by 2050 — rents likely to lag national; underwrite the cash flow, not the appreciation.
- At projected returns (-3.0% appreciation + 6.6% rent growth), your $34k cash investment doubles in ~8 years — after that, you're playing with house money.
Negotiation context
- It's been on market 34 days — a 3% lower offer ($116k) is reasonable based on typical stale-listing flexibility.
- 4 sale attempts since 2y ago; this cycle's ask has dropped $15k (11%) from the opening price — seller is motivated, your offer sets the floor, not the list.
- Current owner paid $55k; list at $120k implies a 118% gain — meaningful room to come down on a strong offer.
Risks & watch-outs
- Watch-outs: property tax is 3.9% of price; built in 1920 — expect roof / HVAC / electrical / plumbing capex.
- Climate carrying-cost: major wind risk, 27% chance of damaging wind over 30y; extreme-heat days projected 7→15/yr by 2055 (HVAC capex compounding) — expect insurance premiums to compound above CPI over the hold.
Questions for the listing agent
- It's been on market 34 days. Have you received any prior offers? Is the seller open to a 3% concession, seller financing, or rate buy-down credit?
- Built in 1920 — when were the roof, HVAC, electrical panel, plumbing, and water heater last replaced?
- Property tax is high relative to price — has the assessment been appealed recently, and will the sale trigger a re-assessment?
- Is there a deadline driving the sale (1031 exchange, divorce, estate, relocation)? That informs how much negotiation room exists.
- Schools are D-rated, which usually means shorter tenancies and higher turnover. Who's the typical renter profile here, and what's been the actual vacancy rate?
- Crime grade is F in this area — have there been break-ins, vandalism, or insurance claims at this property in the last 3 years? What carrier currently insures it and at what premium?
- What's the average days-on-market for RENTAL listings here right now (not sales)? A rising rental-DOM trend means longer vacancies and softer asking-rent achievability than the comps imply.
- What's the recent tenant-quality profile in this submarket — average credit score on applications, eviction rate, late-payment / NSF rate, and stable-employment percentage? A property-management company in the area should have these aggregated.
- How much new for-sale + rental construction is in the pipeline within 1–3 miles? Heavy new supply typically softens prices + rents 12–24 months out; constrained supply supports both.
Investment metrics
- 1% rule
- 1.46% ✓
- Cap rate
- 9.42%
- Cash-on-cash
- 11.17%
- DSCR
- 1.50
- GRM
- 5.7
CMA / ARV
- ARV (median comp)
- $121,706
- List price
- $119,900
- Delta
- -1.48%
- Verdict
- FAIR
- Comps
- 20 within 1.0 mi
Show comp detail 12 sales within ~0.75 mi
| Address | Dist | Beds/Ba | Sqft | Sold | Price | $/sf | Match |
|---|---|---|---|---|---|---|---|
| 2115 Mcculloh St | 0.00mi | 3/1.5 | 1,350 (0%) | 4mo | $77,000 | $57 | 95 |
| 2418 Druid Hill Ave | 0.28mi | 3/1.5 | 1,328 (-2%) | 6mo | $77,000 | $58 | 77 |
| 700 Cumberland St | 0.38mi | 4/2.0 (+1) | 1,280 (-5%) | 3mo | $107,800 | $84 | 67 |
| 1901 Linden Ave | 0.27mi | 2/1.5 (-1) | 1,240 (-8%) | 1mo | $275,000 | $222 | 66 |
| 2453 Mcculloh St | 0.32mi | 3/1.0 | 1,460 (+8%) | 3mo | $99,900 | $68 | 65 |
| 1407 Jordan St | 0.54mi | 3/3.0 | 1,400 (+4%) | 5mo | $425,500 | $304 | 60 |
| 1719 Baker St | 0.55mi | 2/1.0 (-1) | 1,400 (+4%) | 2mo | $19,250 | $14 | 58 |
| 1306 Rutter St | 0.75mi | 3/1.0 | 1,312 (-3%) | 5mo | $290,000 | $221 | 52 |
| 2820 Woodbrook Ave | 0.65mi | 3/1.5 | 1,232 (-9%) | 2mo | $85,000 | $69 | 52 |
| 2208 Mount Royal Ter | 0.54mi | 3/3.5 | 1,216 (-10%) | 4mo | $299,900 | $247 | 49 |
| 2818 Woodbrook Ave | 0.64mi | 3/1.0 | 1,232 (-9%) | 3mo | $45,500 | $37 | 48 |
| 1735 N Payson St | 0.74mi | 3/1.5 | 1,250 (-7%) | 6mo | $95,000 | $76 | 47 |
Match score weights: distance 35% · size 25% · config 20% · recency 20%. Top-matched comps best support the ARV.
Projected returns pro-forma
-3.0% appreciation · 6.63% rent growth · sell at horizon
- IRR
- 5.3%
- Equity multiple
- 1.22×
- Total profit
- $7,275
- Equity at exit
- $17,877
- IRR
- 18.4%
- Equity multiple
- 2.85×
- Total profit
- $61,973
- Equity at exit
- $10,367
Cash invested: $33,572 (down + closing). Projections, not guarantees.
Landlord ↔ Tenant lean methodology
- Overall (CITY)
- 12 Strongly Tenant-Friendly
- State Maryland
- 27 Tenant-Leaning · D+14
- County
- — inherits STATE
- City Baltimore
- 12 Strongly Tenant-Friendly · D+58
ZIP-level market 21217
- Rents YoY
- 6.6%
- Active inventory
- 331
- Price-to-rent
- 5.7×
Monthly cashflow live
- Estimated rent
- $1,750 high interval (Pro) →
- Mortgage (P&I)
- −$629
- Tax from tax record
- −$391 /mo · $4,698/yr
- Insurance
- −$50
- HOA
- −$0
- Vacancy / Maint / Mgmt
- −$368
- Net cashflow
- $313
Break-even live
UW: 25.0% down · 7.5% · 30yr · 1.5% tax · 5.0% vac · 8.0% maint · 8.0% mgmt
Financing live
Cash to close
- Down payment
- $29,975
- Closing costs
- $3,597
- Reserves months
- —
- Total cash needed
- —
Loan-product check · same deal, 3 products live
Conventional
25% down · 7.5% · 30yr
- Down + closing
- —
- Monthly P&I
- —
- Monthly cashflow
- —
- DSCR
- —
- Eligible?
- —
Personal DTI + credit; lowest rate.
DSCR
20% down · 8.5% · 30yr
- Down + closing
- —
- Monthly P&I
- —
- Monthly cashflow
- —
- DSCR
- —
- Eligible?
- —
No personal income docs; deal must DSCR.
Hard money
10% down · 12.0% · 12mo
- Down + closing
- —
- Monthly P&I
- —
- Monthly cashflow
- —
- DSCR
- —
- Eligible?
- —
Short-term bridge; refi at stabilization.
Rent comps 40 comps
| Address | Beds | Baths | Sqft | Rent | $/sqft | DOM | Units | Dist |
|---|---|---|---|---|---|---|---|---|
| 2037 McCulloh St Unit 3 Baltimore, MD | 2.0 | 2.0 | 937 | $1,650 | $1.76 | 17d | 1 | 0.04mi |
| 2143 Druid Hill Ave Unit 2 Baltimore, MD | 2.0 | 1.0 | 915 | $1,400 | $1.53 | 43d | 1 | 0.05mi |
| 2028 Druid Hill Ave Baltimore, MD | 3.0 | 2.5 | 1437 | $1,799 | $1.25 | 10d | 1 | 0.08mi |
| 2028 Druid Hill Ave Unit 1 Baltimore, MD | 3.0 | 2.5 | 1437 | $1,750 | $1.22 | 2d | 1 | 0.08mi |
| 1931 McCulloh St Unit 1 Baltimore, MD | 3.0 | 1.0 | 1000 | $1,500 | $1.50 | 43d | 1 | 0.11mi |
| 1920 McCulloh St Apt 2 Baltimore, MD | 2.0 | 1.0 | 1000 | $1,450 | $1.45 | 43d | 1 | 0.13mi |
| 1205 Clendenin St Baltimore, MD | 3.0 | 1.5 | 1560 | $800 | $0.51 | 23d | 1 | 0.17mi |
| 519 Sanford Pl Baltimore, MD | 3.0 | 1.0 | 1300 | $1,650 | $1.27 | 16d | 1 | 0.23mi |
| 1121 Whitelock St Baltimore, MD | 2.0 | 1.0 | 1180 | $1,300 | $1.10 | 43d | 1 | 0.24mi |
| 1829 Eutaw Pl Unit B Baltimore, MD | 2.0 | 2.0 | 1278 | $2,100 | $1.64 | 4d | 1 | 0.25mi |
| 2339 Eutaw Pl Ste 1 Baltimore, MD | 2.0 | 1.0 | 1300 | $1,275 | $0.98 | 43d | 1 | 0.26mi |
| 2433 Druid Hill Ave Baltimore, MD | 2.0 | 2.5 | 1092 | $1,999 | $1.83 | 43d | 1 | 0.30mi |
| 2409 Francis St Baltimore, MD | 3.0 | 1.0 | 1298 | $1,500 | $1.16 | 43d | 1 | 0.30mi |
| 2202 Brookfield Ave Baltimore, MD | 2.0 | 1.0 | 980 | $1,600 | $1.63 | 43d | 1 | 0.31mi |
| 2449 Druid Hill Ave Baltimore, MD | 2.0 | 1.0 | 1100 | $1,800 | $1.64 | 43d | 1 | 0.32mi |
| 1315 Presstman St Baltimore, MD | 4.0 | 2.0 | 1700 | $2,000 | $1.18 | 43d | 1 | 0.33mi |
| 815 Lennox St Baltimore, MD | 3.0 | 3.5 | 1600 | $2,790 | $1.74 | 23d | 1 | 0.34mi |
| 1346 N Carey St Baltimore, MD | 2.0 | 1.5 | 1100 | $1,500 | $1.36 | 43d | 1 | 0.35mi |
| 823 Newington Ave Unit 1 Baltimore, MD | 2.0 | 1.0 | 913 | $1,700 | $1.86 | 17d | 1 | 0.35mi |
| 2511 Madison Ave #2 Baltimore, MD | 3.0 | 1.0 | 1100 | $1,650 | $1.50 | 43d | 1 | 0.37mi |
| 1534 N Stricker St Baltimore, MD | 2.0 | 1.5 | 900 | $1,475 | $1.64 | 14d | 1 | 0.38mi |
| 1614 N Calhoun St Baltimore, MD | 2.0 | 1.0 | 950 | $1,300 | $1.37 | 43d | 1 | 0.39mi |
| 1722 Bolton St Unit 3 Baltimore, MD | 2.0 | 1.0 | 942 | $1,600 | $1.70 | 4d | 1 | 0.39mi |
| 734 Watts St Baltimore, MD | 3.0 | 3.5 | 1720 | $2,900 | $1.69 | 43d | 1 | 0.40mi |
| 750 Reservoir St Unit B Baltimore, MD | 2.0 | 2.0 | 900 | $1,850 | $2.06 | 43d | 1 | 0.40mi |
| 750 Reservoir St Unit A Baltimore, MD | 2.0 | 1.0 | 900 | $1,650 | $1.83 | 43d | 1 | 0.40mi |
| 1507 Retreat St Unit 1 Baltimore, MD | 3.0 | 3.0 | 1098 | $2,500 | $2.28 | 43d | 1 | 0.40mi |
| 2401 Brookfield Ave Baltimore, MD | 2.0–3.0 | 1.0–2.0 | 1102 | $1,675 | $1.52 | 23d | 3 | 0.41mi |
| 1515 Retreat St Baltimore, MD | 3.0 | 2.0 | 1098 | $1,800 | $1.64 | 23d | 1 | 0.41mi |
| 2407 Brookfield Ave Unit 4 Baltimore, MD | 2.0 | 2.0 | 1300 | $1,550 | $1.19 | 43d | 1 | 0.42mi |
| 1714 Park Ave #202 Baltimore, MD | 2.0 | 2.0 | 1000 | $1,800 | $1.80 | 23d | 1 | 0.43mi |
| 2402 Lakeview Ave Apt 2 Baltimore, MD | 2.0 | 1.0 | 900 | $1,250 | $1.39 | 12d | 1 | 0.44mi |
| 1624 Westwood Ave Baltimore, MD | 3.0 | 2.0 | 1000 | $1,900 | $1.90 | 43d | 1 | 0.45mi |
| 2505 Woodbrook Ave Baltimore, MD | 4.0 | 2.0 | 1256 | $1,745 | $1.39 | 1d | 1 | 0.46mi |
| 1729 Park Ave Unit 4 Baltimore, MD | 2.0 | 2.0 | 900 | $1,725 | $1.92 | 4d | 1 | 0.46mi |
| 2614 Pennsylvania Ave Baltimore, MD | 1.0–3.0 | 1.0–2.0 | 982 | $1,141 | $1.16 | 4d | 4 | 0.49mi |
| 1806 N Mount St Baltimore, MD | 3.0 | 3.0 | 1200 | $1,700 | $1.42 | 19d | 1 | 0.49mi |
| 810 Brooks Ln Unit 2 Baltimore, MD | 3.0 | 1.0 | 900 | $1,350 | $1.50 | 20d | 1 | 0.50mi |
| 2438 Callow Ave Baltimore, MD | 2.0 | 2.0 | 950 | $1,462 | $1.54 | 23d | 1 | 0.51mi |
| 2636 Pennsylvania Ave Baltimore, MD | 1.0–2.0 | 1.0 | 846 | $956 | $1.13 | 23d | 4 | 0.52mi |
Listing history 23 events
-
2026-06-18days on market $119,900 Active 34 DOM
-
2026-06-17price $119,900 Active 33 DOM
-
2026-06-17days on market $134,900 Active 33 DOM
-
2026-06-16days on market $134,900 Active 32 DOM
-
2026-06-15days on market $134,900 Active 31 DOM
-
2026-06-13days on market $134,900 Active 29 DOM
-
2026-06-09days on market $134,900 Active 25 DOM
-
2026-06-08days on market $134,900 Active 24 DOM
-
2026-06-07days on market $134,900 Active 23 DOM
-
2026-06-04days on market $134,900 Active 20 DOM
-
2026-06-03days on market $134,900 Active 19 DOM
-
2026-06-02days on market $134,900 Active 18 DOM
-
2026-06-01days on market $134,900 Active 17 DOM
-
2026-05-31days on market $134,900 Active 16 DOM
-
2026-05-15$134,900 Active 834-char remark
-
2025-01-21historical
-
2024-11-28$215,000 Active
-
2024-11-28historical
-
2024-09-24$215,000 Active
-
2024-08-13historical
-
2024-08-12$215,000 Active
-
2024-07-18historical
-
1988-05-13soldstatus $55,000
ⓘ Source: listings_history table (triggers on properties + properties_extension) + one-shot
backfill from property_details.listing_events for pre-trigger history.
Tax reassessment forecast MD · Partial reset (capped growth)
- Current annual tax
- $4,698 · $391/mo
- Projected year-2 tax
- $4,698 · $391/mo
- Expected delta
- $0/yr ($0/mo · 0.0%)
ⓘ Screening estimate from a state-policy table — verify with the county assessor before closing.
Climate risk First Street
- Flood 1/10 Low FEMA zone X (unshaded) · 0% chance over 30 yrs
- Wildfire 1/10 Low
- Heat 7/10 Severe 7 d/yr ≥103°F today · 15 d/yr by 30 yrs out
- Wind 6/10 Major 27% chance of damaging wind over 30 yrs
- Air quality 4/10 Moderate 6 unhealthy d/yr today · 7 by 30 yrs out
Nearby sold comps map
Loading sold comps map…
Walkable amenities ~0.75 mi
Loading nearby amenities…
Taxation est. · year 1
- Rental income
- $21,003
- − Mortgage interest
- −$6,716
- − Property taxes
- −$4,698
- − Insurance
- −$600
- − Repairs & maintenance
- −$1,680
- − Management
- −$1,680
- − Depreciation
- −$3,488
- Taxable income
- $2,141
- Est. tax owed @ 24.0%
- −$514
- After-tax cash flow
- $3,236/yr
For passive investors: Depreciation is non-cash, so a rental often shows a tax loss while cash-flowing — sheltering income. Rental losses are passive: they offset passive income freely, and up to $25,000/yr can offset ordinary (W-2) income if you actively participate and your MAGI is under $100k (phasing out to $0 by $150k); unused losses carry forward. On sale, claimed depreciation is recaptured at up to 25%, and gains may owe capital-gains tax (a 1031 exchange can defer both). Figures are a year-1 estimate at your 24.0% rate — not tax advice; consult a CPA.
Schools (NCES district)
- District
- Baltimore City Public Schools
- NCES district ID
- 2400090
- Math proficiency
- 7% ▼ -9.00%
- Reading proficiency
- 16% ▼ -5.00%
- Median HH income
- $42,108
- Composite
- 10.08/100
- National rank
- #9805
- State rank
- #24 of 24 in MD
Livability — Baltimore
- Score
- 76/100
- State rank
- #90
- US rank
- #3396
Category grades
Schools grade is shown separately in the Schools card above.
Census & demographics
- Census place
- Baltimore, MD
- County
- Baltimore City · 558,601 people
- City population
- 588,727
- Metro
- Baltimore-Columbia-Towson, MD
- Population (ZIP)
- 30,792
- Household income
- $38,409
- Rent vs Own
- Severe rent burden
- 2921.0
Population outlook (Baltimore County) Hauer SSP2
- Today (2025)
- 624,249 people
- By 2030
- 621,541 · -0.4%
- By 2040
- 609,756 · -2.3%
- By 2050
- 597,249 · -4.3%
- By 2075
- 552,236 · -11.5%
- By 2100
- 513,934 · -17.7%
Race, ethnicity, and origin ACS 2023
- Neighborhood character
- Predominantly Black (81%)
- Race & ethnicity
- Black 81% White 12% Two or more races 4% Hispanic / Latino 2% Asian 2%
- Common ancestry
- Romanian 1% Hispanic 1% Italian 1%
- Foreign-born
- 5% · Canada, China, South Korea
- Languages at home
- 94% English-only · Spanish 2% French/Haitian/Cajun 1% Chinese 1%
Political lean MEDSL · Baltimore
- 2024 margin
- Solid D (+73.0) · D 85.2% · R 12.2% · Other 2.6%
- 2008→2024 swing
- -2.5pp toward R · 2008: 75.5pp · 2024: 73.0pp
- All cycles
- 2024: D+73.0 2020: D+76.6 2016: D+74.6 2012: D+76.4 2008: D+75.5
Not yet ingested
- Civics
- —
Market trends
- HPI YoY
- ▼ -187.20%
- Current HPI
- 104.2102
- Rent YoY
- ▲ 6.63%
- Metro
- Baltimore-Columbia-Towson, MD
- State GDP YoY
- ▲ 2.97%
- F500 in state
- 12
Industry mix (Fortune 500 HQ in MD)
| Industry | F500 HQs | Revenue |
|---|---|---|
| Aerospace / Defense | 1 | $71B |
|
||
| Utilities | 1 | $25B |
|
||
| Hotels | 1 | $24B |
|
||
| Consumer Goods | 1 | $7B |
|
||
| Real Estate | 1 | $6B |
|
||
| Chemicals | 1 | $2B |
|
||
Price history
+118.0% since first listed10 events — show timeline
- 2026-06-17 Price Changed $119,900 BRIGHT MLS
- 2026-05-15 Listed $134,900 BRIGHT MLS
- 2025-01-21 Listing Removed — BRIGHT MLS
- 2024-11-28 Listing Removed — BRIGHT MLS
- 2024-11-28 Listed $215,000 BRIGHT MLS
- 2024-09-24 Listed $215,000 BRIGHT MLS
- 2024-08-13 Listing Removed — BRIGHT MLS
- 2024-08-12 Listed $215,000 BRIGHT MLS
- 2024-07-18 Coming Soon — BRIGHT MLS
- 1988-05-13 Sold (Public Records) $55,000 Public Records
Property tax history
+8.9%/yrLatest (2025): $4,698 · +1282.5% YoY. Source: county tax records.
Cash-flow waterfall
monthlySold comps — $/sqft
last 12 mo · ≤1 miLoading sold comps…