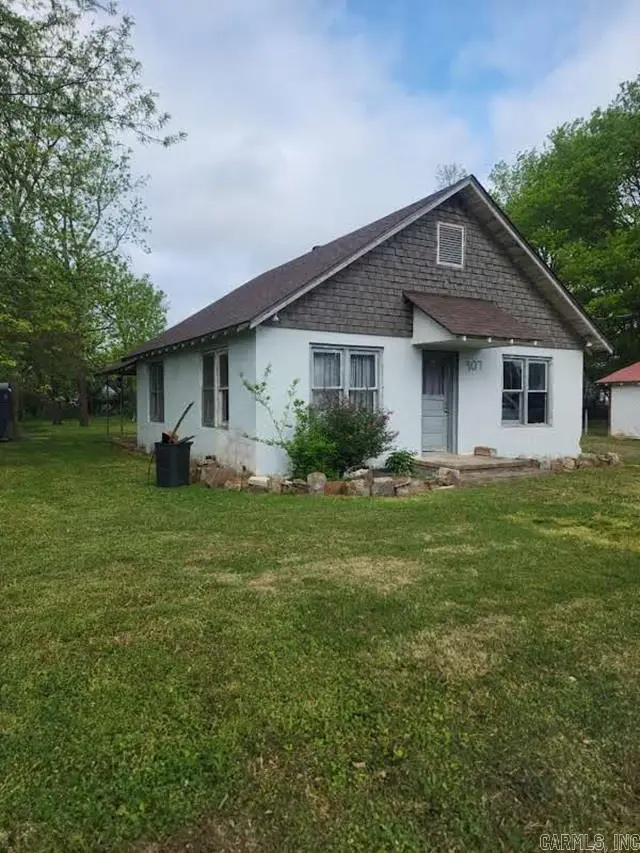
907 S Reine · Mena, AR
Flood risk 1/10 · Minimal
- FEMA flood zone
- —
- Chance of flooding over 30 yrs
- 0.0%
- Est. flood insurance / yr
- —
Fire risk 4/10 · Minor
- Est. fire insurance / yr
- $1,499 – $2,785
Heat risk 5/10 · Moderate
- Hot days now (above 108°F)
- 7 days/yr
- Hot days in 30 yrs
- 22 days/yr
Wind risk 3/10 · Minor
- Chance of severe wind over 30 yrs
- 5.0%
Air-quality risk 2/10 · Minimal
- Unhealthy air days now
- 1 days/yr
- Unhealthy air days in 30 yrs
- 1 days/yr
Risk factors via First Street. Map © Google.
Why this score? — see what drove the B- grade
The composite is a weighted blend of 9 inputs, each scored 0–100. Each bar is that input's sub-score; the figure is the points it added to the 100-point composite (weight × sub-score).
- Cash flow +23.0/30.0
- ARV discount +15.0/15.0
- DSCR +7.4/10.0
- 1% rule +6.0/10.0
- Appreciation +4.4/10.0
- Schools +3.3/10.0
- Livability +3.2/5.0
- Rent growth +2.5/5.0
- Condition / age +2.5/5.0
$89,900
🖨 Deal sheet 📄 Offer letter ✓ Due diligence
Listing remarks MLS
Home in town that is in need of some TLC. One of the bedrooms has a walk in closet with some beautiful wood planks on the a wall and ceiling. House sits on almost a third of a acre. Priced to sell at $16,500.
Key facts
- Local bike trails
- Detached
- 0.32 acre lot
Tags
Property features AI
Finance
- Other: Source of acreage and square footage: Courthouse/Tax Records; Will not subdivide
- Financial info: Financing available: Conventional loan or cash
Exterior
- Parking: Parking pads
- Utilities: Public sewer; Public water; Municipal electric service (Entergy); Natural gas service; Private telephone service
- Home design: Block exterior
- Construction: Composition roof; Crawl space foundation; Block construction
- Exterior features: Paved road access; Level lot in a subdivision; Lot approximately 75 x 185 (0.32 acre); Located inside city limits
Interior
- Kitchen: Free-standing stove
- Flooring: Vinyl
- Bathrooms: 1 full bathroom
- Heating & cooling: Window air conditioning units; Gas space heater
- Interior features: Vinyl floors; Paneling on walls/ceilings
- Laundry & utility: Laundry room
Neighborhood map
What this means for you Summary
Snapshot
- This is a 3-bed/1.0-bath single-family listed at $90k.
Deal economics
- At list price, monthly cash flow is $160 ($2k/yr) — positive.
- The deal already cash-flows at list — no discount required.
- Meets the 1% rule at list price ($989 rent vs $90k).
- Recommended offer: $85k (6.0% below list) — sets the bar for market timing.
- Cap rate 8.4% vs local median 3.1% in Mena — top-decile yield for the area; either an underpriced asset or a hidden risk that comps aren't pricing in. Stress-test before assuming the spread holds.
Location & tenants
- Location reads 65/100 on livability (#142 in AR) — a middle-class / working-renter tenant base. Strengths: cost of living A+, housing A+, health & safety A+; Watch: crime D, amenities F, commute F.
- Mena School District (rural): math 42% / reading 38% proficiency, ranked #70 of 238 in AR (top 29%) — families likely to look elsewhere, expect single-tenant / working-renter base with shorter leases.
- Zoned schools: Mena High School (math 25% / reading 39%, grade F, #119 of 292 statewide, top 43%, 498 students, 53% FRL) — zoned schools at 53% FRL track the district average.
- Market conditions: 204 active listings in the ZIP; 2 comparable units currently listed for rent nearby; 4 units permitted in Polk County in 2024 (0 in 5+ unit buildings).
Forward outlook
- Local home prices are declining (-1.2%/yr); year-one equity from $622 of loan paydown is wiped out by about $1k of value loss. Plan a longer hold.
- Polk County population projected at -15% by 2050 — secular population decline; favor cash flow + early exit over multi-decade hold.
- At projected returns (-1.2% appreciation + 3.0% rent growth), your $25k cash investment doubles in ~10 years — after that, you're playing with house money.
Negotiation context
- It's been on market 70 days — a 6% lower offer ($85k) is reasonable based on typical stale-listing flexibility.
- 2 sale attempts since 7y ago with the ask held roughly flat each time — persistent listings suggest the price (not the market) is what's stuck; bring a comps-based counter.
- Current owner paid $15k; list at $90k implies a 499% gain — meaningful room to come down on a strong offer.
Risks & watch-outs
- Watch-outs: built in 1940 — expect roof / HVAC / electrical / plumbing capex.
- Climate carrying-cost: extreme-heat days projected 7→22/yr by 2055 (HVAC capex compounding) — expect insurance premiums to compound above CPI over the hold.
Questions for the listing agent
- It's been on market 70 days. Have you received any prior offers? Is the seller open to a 6% concession, seller financing, or rate buy-down credit?
- Built in 1940 — when were the roof, HVAC, electrical panel, plumbing, and water heater last replaced?
- Why hasn't it sold? Are there any deal-killer items the seller is aware of (foundation, flood, title, zoning, code violations)?
- Is there a deadline driving the sale (1031 exchange, divorce, estate, relocation)? That informs how much negotiation room exists.
- Schools are D-rated, which usually means shorter tenancies and higher turnover. Who's the typical renter profile here, and what's been the actual vacancy rate?
- Crime grade is D in this area — have there been break-ins, vandalism, or insurance claims at this property in the last 3 years? What carrier currently insures it and at what premium?
- What's the average days-on-market for RENTAL listings here right now (not sales)? A rising rental-DOM trend means longer vacancies and softer asking-rent achievability than the comps imply.
- What's the recent tenant-quality profile in this submarket — average credit score on applications, eviction rate, late-payment / NSF rate, and stable-employment percentage? A property-management company in the area should have these aggregated.
- How much new for-sale + rental construction is in the pipeline within 1–3 miles? Heavy new supply typically softens prices + rents 12–24 months out; constrained supply supports both.
Investment metrics
- 1% rule
- 1.10% ✓
- Cap rate
- 8.43%
- Cash-on-cash
- 7.65%
- DSCR
- 1.34
- GRM
- 7.6
CMA / ARV
- ARV (on-the-fly)
- $128,064
- Comps found
- 12
Show comp detail 12 sales within ~0.75 mi
| Address | Dist | Beds/Ba | Sqft | Sold | Price | $/sf | Match |
|---|---|---|---|---|---|---|---|
| 1504 Hamilton Ave | 0.11mi | 3/1.0 | 1,074 (-3%) | 9mo | $143,000 | $133 | 83 |
| 805 Reine St | 0.08mi | 2/1.0 (-1) | 1,250 (+13%) | 4mo | $40,000 | $32 | 66 |
| 1412 Hamilton Ave | 0.13mi | 3/1.0 | 1,266 (+15%) | 5mo | $110,000 | $87 | 65 |
| 1105 Oak Grv | 0.37mi | 3/1.0 | 1,214 (+10%) | 9mo | $100,000 | $82 | 59 |
| 1111 Averitt Ave | 0.39mi | 3/2.0 | 1,216 (+10%) | 3mo | $135,000 | $111 | 58 |
| 705 Twelfth St | 0.31mi | 3/2.0 | 1,254 (+14%) | 7mo | $174,500 | $139 | 53 |
| 109 S Adams St | 0.55mi | 3/1.0 | 960 (-13%) | 1mo | $77,000 | $80 | 52 |
| 1000 Marion Ave | 0.38mi | 2/2.0 (-1) | 960 (-13%) | 1mo | $117,500 | $122 | 51 |
| 1007 9th St | 0.67mi | 2/1.0 (-1) | 1,000 (-9%) | 2mo | $140,000 | $140 | 46 |
| 210 Gann St | 0.66mi | 3/1.0 | 1,232 (+12%) | 8mo | $140,000 | $114 | 43 |
| 305 N Reine St | 0.71mi | 3/2.0 | 1,224 (+11%) | 2mo | $166,500 | $136 | 43 |
| 2701 Ozark St | 0.72mi | 3/1.5 | 1,237 (+12%) | 7mo | $144,000 | $116 | 38 |
Match score weights: distance 35% · size 25% · config 20% · recency 20%. Top-matched comps best support the ARV.
Projected returns pro-forma
-1.18% appreciation · 3.0% rent growth · sell at horizon
- IRR
- 2.5%
- Equity multiple
- 1.11×
- Total profit
- $2,712
- Equity at exit
- $20,905
- IRR
- 9.2%
- Equity multiple
- 1.88×
- Total profit
- $22,132
- Equity at exit
- $21,280
Cash invested: $25,172 (down + closing). Projections, not guarantees.
Landlord ↔ Tenant lean methodology
- Overall (STATE)
- 92 Strongly Landlord-Friendly
- State Arkansas
- 92 Strongly Landlord-Friendly · R+14
- County
- — inherits STATE
- City
- — inherits STATE
ZIP-level market 71953
- Home prices YoY
- -0.4%
- Active inventory
- 204
- Price-to-rent
- 7.6×
Monthly cashflow live
- Estimated rent
- $989 medium interval (Pro) →
- Mortgage (P&I)
- −$471
- Tax est. 1.5%
- −$112 /mo · $1,348/yr
- Insurance
- −$37
- HOA
- −$0
- Vacancy / Maint / Mgmt
- −$208
- Net cashflow
- $160
Break-even live
UW: 25.0% down · 7.5% · 30yr · 1.5% tax · 5.0% vac · 8.0% maint · 8.0% mgmt
Financing live
Cash to close
- Down payment
- $22,475
- Closing costs
- $2,697
- Reserves months
- —
- Total cash needed
- —
Loan-product check · same deal, 3 products live
Conventional
25% down · 7.5% · 30yr
- Down + closing
- —
- Monthly P&I
- —
- Monthly cashflow
- —
- DSCR
- —
- Eligible?
- —
Personal DTI + credit; lowest rate.
DSCR
20% down · 8.5% · 30yr
- Down + closing
- —
- Monthly P&I
- —
- Monthly cashflow
- —
- DSCR
- —
- Eligible?
- —
No personal income docs; deal must DSCR.
Hard money
10% down · 12.0% · 12mo
- Down + closing
- —
- Monthly P&I
- —
- Monthly cashflow
- —
- DSCR
- —
- Eligible?
- —
Short-term bridge; refi at stabilization.
Rent comps 2 comps
| Address | Beds | Baths | Sqft | Rent | $/sqft | DOM | Units | Dist |
|---|---|---|---|---|---|---|---|---|
| 306 Hornbeck Ave Mena, AR | 3.0 | 2.0 | 776 | $1,100 | $1.42 | 43d | 1 | 1.26mi |
| 99 Pine Ave Mena, AR | 2.0 | 1.0 | 750 | $875 | $1.17 | 43d | 1 | 1.26mi |
Listing history 20 events
-
2026-06-19days on market $89,900 Active 70 DOM
-
2026-06-18days on market $89,900 Active 69 DOM
-
2026-06-17days on market $89,900 Active 68 DOM
-
2026-06-16days on market $89,900 Active 67 DOM
-
2026-06-15days on market $89,900 Active 66 DOM
-
2026-06-14days on market $89,900 Active 64 DOM
-
2026-06-12days on market $89,900 Active 63 DOM
-
2026-06-09days on market $89,900 Active 60 DOM
-
2026-06-08days on market $89,900 Active 59 DOM
-
2026-06-07days on market $89,900 Active 58 DOM
-
2026-06-04days on market $89,900 Active 54 DOM
-
2026-06-02days on market $89,900 Active 53 DOM
-
2026-06-01days on market $89,900 Active 52 DOM
-
2026-05-31days on market $89,900 Active 51 DOM
-
2026-05-31days on market $89,900 Active 50 DOM
-
2026-04-08$89,900 New Listing
-
2019-03-06soldstatus $15,000 Sold 208-char remark
Show marketing remark (208 chars)
Home in town that is in need of some TLC. One of the bedrooms has a walk in closet with some beautiful wood planks on the a wall and ceiling. House sits on almost a third of a acre. Priced to sell at $16,500.
-
2019-02-25historical Take Backups 208-char remark
Show marketing remark (208 chars)
Home in town that is in need of some TLC. One of the bedrooms has a walk in closet with some beautiful wood planks on the a wall and ceiling. House sits on almost a third of a acre. Priced to sell at $16,500.
-
2019-02-15$16,500 New Listing 208-char remark
Show marketing remark (208 chars)
Home in town that is in need of some TLC. One of the bedrooms has a walk in closet with some beautiful wood planks on the a wall and ceiling. House sits on almost a third of a acre. Priced to sell at $16,500.
-
2016-10-28soldstatus $11,500
ⓘ Source: listings_history table (triggers on properties + properties_extension) + one-shot
backfill from property_details.listing_events for pre-trigger history.
Climate risk First Street
- Flood 1/10 Low 0% chance over 30 yrs
- Wildfire 4/10 Moderate
- Heat 5/10 Major 7 d/yr ≥108°F today · 22 d/yr by 30 yrs out
- Wind 3/10 Moderate 5% chance of damaging wind over 30 yrs
- Air quality 2/10 Low 1 unhealthy d/yr today · 1 by 30 yrs out
Nearby sold comps map
Loading sold comps map…
Walkable amenities ~0.75 mi
Loading nearby amenities…
Taxation est. · year 1
- Rental income
- $11,873
- − Mortgage interest
- −$5,036
- − Property taxes
- −$1,348
- − Insurance
- −$450
- − Repairs & maintenance
- −$950
- − Management
- −$950
- − Depreciation
- −$2,615
- Taxable income
- $524
- Est. tax owed @ 24.0%
- −$126
- After-tax cash flow
- $1,799/yr
For passive investors: Depreciation is non-cash, so a rental often shows a tax loss while cash-flowing — sheltering income. Rental losses are passive: they offset passive income freely, and up to $25,000/yr can offset ordinary (W-2) income if you actively participate and your MAGI is under $100k (phasing out to $0 by $150k); unused losses carry forward. On sale, claimed depreciation is recaptured at up to 25%, and gains may owe capital-gains tax (a 1031 exchange can defer both). Figures are a year-1 estimate at your 24.0% rate — not tax advice; consult a CPA.
Schools (NCES district)
- District
- Mena School District
- NCES district ID
- 0509750
- Math proficiency
- 42% ▼ -9.00%
- Reading proficiency
- 38% ▼ -9.00%
- Median HH income
- $32,941
- Composite
- 32.88/100
- National rank
- #5607
- State rank
- #70 of 238 in AR
Livability — Mena
- Score
- 65/100
- State rank
- #142
- US rank
- #12615
Category grades
Schools grade is shown separately in the Schools card above.
Census & demographics
- Census place
- Mena, AR
- Population (ZIP)
- 13,412
Population outlook (Polk County) Hauer SSP2
- Today (2025)
- 19,065 people
- By 2030
- 18,369 · -3.7%
- By 2040
- 17,156 · -10.0%
- By 2050
- 16,177 · -15.1%
- By 2075
- 14,642 · -23.2%
- By 2100
- 13,020 · -31.7%
Race, ethnicity, and origin ACS 2023
- Neighborhood character
- Predominantly White (91%)
- Race & ethnicity
- White 91% Two or more races 5% Hispanic / Latino 3% Native American 1%
- Common ancestry
- Lithuanian 3% Slovak 2% Iranian 1%
- Foreign-born
- 2% · Canada
- Languages at home
- 98% English-only · Spanish 1% German/W. Germanic 1%
Political lean MEDSL · Polk
- 2024 margin
- Solid R (+70.5) · D 13.8% · R 84.3% · Other 1.9%
- 2008→2024 swing
- -24.7pp toward R · 2008: -45.8pp · 2024: -70.5pp
- All cycles
- 2024: R+70.5 2020: R+68.2 2016: R+66.4 2012: R+56.9 2008: R+45.8
Not yet ingested
- Civics
- —
Market trends
- HPI YoY
- ▼ -1.18%
- Current HPI
- 278.2854
- Rent YoY
- —
- Metro
- —
- State GDP YoY
- ▲ 3.80%
- F500 in state
- 10
Industry mix (Fortune 500 HQ in AR)
| Industry | F500 HQs | Revenue |
|---|---|---|
| Retail | 1 | $681B |
|
||
| Food / Agriculture | 1 | $53B |
|
||
| Retail / Energy | 1 | $22B |
|
||
| Transportation / Logistics | 1 | $12B |
|
||
| Energy | 1 | $4B |
|
||
Price history
+681.7% since first listed5 events — show timeline
- 2026-04-08 Listed $89,900 CARMLS
- 2019-03-06 Sold (MLS) $15,000 CARMLS
- 2019-02-25 Contingent — CARMLS
- 2019-02-15 Listed $16,500 CARMLS
- 2016-10-28 Sold (Public Records) $11,500 Public Records
Property tax history
-2.9%/yrLatest (2025): $165 · +0.0% YoY. Source: county tax records.
Cash-flow waterfall
monthlySold comps — $/sqft
last 12 mo · ≤1 miLoading sold comps…