 Duplex
3441 Siskiyou St · Los Angeles, CA
Flood risk 1/10 · Minimal
- FEMA flood zone
- X (unshaded)
- Chance of flooding over 30 yrs
- 0.0%
- Est. flood insurance / yr
- $507 – $1,088
Fire risk 1/10 · Minimal
- Est. fire insurance / yr
- $659 – $1,223
Heat risk 6/10 · Moderate
- Hot days now (above 94°F)
- 7 days/yr
- Hot days in 30 yrs
- 21 days/yr
Wind risk 1/10 · Minimal
- Chance of severe wind over 30 yrs
- —
Air-quality risk 5/10 · Moderate
- Unhealthy air days now
- 9 days/yr
- Unhealthy air days in 30 yrs
- 9 days/yr
Risk factors via First Street. Map © Google.
Why this score? — see what drove the C grade
The composite is a weighted blend of 9 inputs, each scored 0–100. Each bar is that input's sub-score; the figure is the points it added to the 100-point composite (weight × sub-score).
- Cash flow +18.7/30.0
- ARV discount +15.0/15.0
- DSCR +5.9/10.0
- 1% rule +3.7/10.0
- Schools +3.6/10.0
- Livability +3.4/5.0
- Rent growth +2.6/5.0
- Condition / age +2.5/5.0
- Appreciation +0.0/10.0
$430,000
🖨 Deal sheet 📄 Offer letter ✓ Due diligence
Multi-family units
County records classify this as Multi-Family (2-4 Unit). Listing-text estimate: 2 units. confirmed
Listing remarks
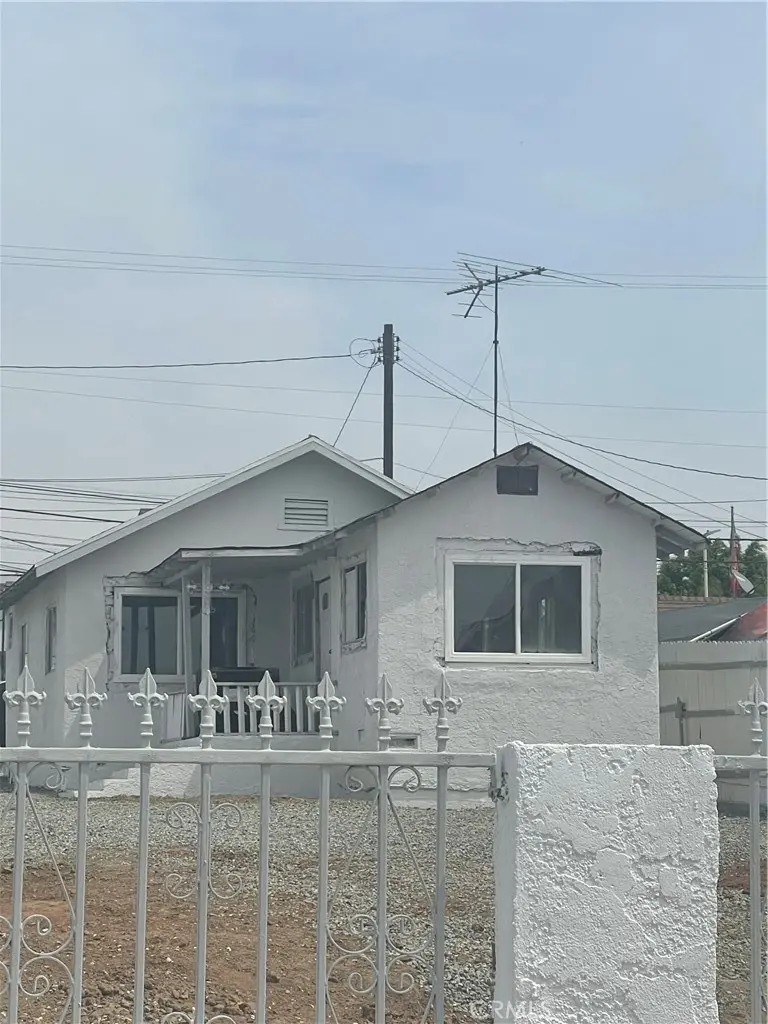
An exceptional redevelopment opportunity in a rapidly evolving Los Angeles neighborhood. This three-unit property offers significant upside for investors, builders, or developers seeking a value-add project. The site currently features one remaining structure, while the other two units have been fully deconstructed, leaving a primarily cleared footprint that provides flexibility for redesign and future construction. With an existing multi-unit zoning, the property is well suited for a new multi-family build, restoration, or custom investment project, allowing a buyer to reimagine the space from the ground up and maximize long-term rental income or resale potential. Conveniently located near
Key facts
- 8,565 sq ft lot
- Built 1920
- Listed 6 days
Property features AI
Finance
- Financial info: Rent control applies; Unit rents reported: two 1-bed units at $1,800 each and one 2-bed unit at $2,400; Total of 3 rental units; Building area reported as 2,010 (unit not displayed in interior/exterior sections)
Exterior
- Parking: Private driveway (concrete)
- Utilities: Public/District water connected; Sewer connected (sewer or septic unknown); Natural gas available; Electricity available; Standard electric service; Three separate electric meters; Three separate gas meters; One separate water meter
- Home design: Attached property with 3 units; Single-story (one story); Raised foundation (see remarks); Front-facing entry
- Construction: Composition/shingle roof; Property in need of major repairs (fixer)
- Exterior features: No pool; Front yard; Gentle slope; Block wall and wrought iron fencing; Gutters and curbs
Interior
- Kitchen: No specific appliances listed
- Bedrooms: Unit A: 1 bedroom; Unit B: 1 bedroom; Unit C: 2 bedrooms
- Bathrooms: Each unit has 1 full bathroom
- Interior features: Front entry; One-level home
- Laundry & utility: Laundry available (see remarks)
Neighborhood map
What this means for you Summary
Snapshot
- This is a 2 × 1-bed/?-bath units multifamily listed at $430k.
Deal economics
- At list price, monthly cash flow is $426 ($5k/yr) — positive. Per door: $213/mo.
- The deal already cash-flows at list — no discount required.
- To meet the 1% rule (rent ≥ 1% of price), the offer needs to be $374k (12.9% below list).
- Recommended offer: $374k (12.9% below list) — sets the bar for 1% rule.
- Cap rate 7.5% vs local median 2.1% in Los Angeles — top-decile yield for the area; either an underpriced asset or a hidden risk that comps aren't pricing in. Stress-test before assuming the spread holds.
Location & tenants
- Location reads 68/100 on livability (#273 in CA) — a middle-class / working-renter tenant base. Strengths: amenities A+, commute A+, employment B; Watch: health & safety C-, schools D+, crime F.
- Los Angeles Unified (urban): math 29% / reading 54% proficiency, ranked #223 of 517 in CA (top 43%) — families likely to look elsewhere, expect single-tenant / working-renter base with shorter leases; 67% free/reduced lunch — lower-income household profile, screen leases tightly.
- Market conditions: Rents flat; 57 active listings in the ZIP; 40 comparable units currently listed for rent nearby; rentals at typical pace (median 25d on market — plan ~3-4 weeks tenant-placement turnaround); 42% of comp listings sitting > 30 days — soft ceiling on asking rent; 19,697 units permitted in Los Angeles County in 2024 (9,426 in 5+ unit buildings).
- At $3,744/mo this rent would consume 76% of the median local household income ($59k/yr) (locally 2670% of renters already pay >50% of income on rent) — very limited rent-growth headroom before tenants either downsize or default.
Forward outlook
- Local home prices are declining (-3.0%/yr); year-one equity from $3k of loan paydown is wiped out by about $13k of value loss. Plan a longer hold.
- Los Angeles County population projected at +9% by 2050 — modest demand growth; plan on rents tracking national, not racing it.
Negotiation context
- Only 6 days on market — expect competitive offers; lowballing is unlikely to land.
Risks & watch-outs
- Watch-outs: built in 1920 — expect roof / HVAC / electrical / plumbing capex.
- Climate carrying-cost: extreme-heat days projected 7→21/yr by 2055 (HVAC capex compounding) — expect insurance premiums to compound above CPI over the hold.
Questions for the listing agent
- Can we see the unit-by-unit rent roll, current vacancy, and any below-market leases? What's the average tenancy length?
- What capital expenditures (roof, boiler, parking lot, exteriors) have been made in the last 5 years, and what's planned in the next 2?
- Built in 1920 — when were the roof, HVAC, electrical panel, plumbing, and water heater last replaced?
- Is there a deadline driving the sale (1031 exchange, divorce, estate, relocation)? That informs how much negotiation room exists.
- Schools are D-rated, which usually means shorter tenancies and higher turnover. Who's the typical renter profile here, and what's been the actual vacancy rate?
- Crime grade is F in this area — have there been break-ins, vandalism, or insurance claims at this property in the last 3 years? What carrier currently insures it and at what premium?
- What's the average days-on-market for RENTAL listings here right now (not sales)? A rising rental-DOM trend means longer vacancies and softer asking-rent achievability than the comps imply.
- What's the recent tenant-quality profile in this submarket — average credit score on applications, eviction rate, late-payment / NSF rate, and stable-employment percentage? A property-management company in the area should have these aggregated.
- How much new apartment / multifamily construction is in the pipeline within 1–3 miles? Heavy new supply (>2% of stock underway) typically softens rents 12–24 months out; light construction supports rent growth.
Investment metrics
- 1% rule
- 0.87% ✗
- Cap rate
- 7.48%
- Cash-on-cash
- 4.25%
- DSCR
- 1.19
- GRM
- 9.6
CMA / ARV
- ARV (on-the-fly)
- $637,938
- Comps found
- 1
Show comp detail 1 sale within ~0.75 mi
| Address | Dist | Beds/Ba | Sqft | Sold | Price | $/sf | Match |
|---|---|---|---|---|---|---|---|
| 1212 Spence St | 0.46mi | 2/2.0 | 904 (+6%) | 18mo | $675,205 | $747 | 50 |
Match score weights: distance 35% · size 25% · config 20% · recency 20%. Top-matched comps best support the ARV.
Projected returns pro-forma
-3.0% appreciation · 0.21% rent growth · sell at horizon
- IRR
- -12.5%
- Equity multiple
- 0.56×
- Total profit
- $-52,980
- Equity at exit
- $64,114
- IRR
- -7.7%
- Equity multiple
- 0.57×
- Total profit
- $-51,739
- Equity at exit
- $37,179
Cash invested: $120,400 (down + closing). Projections, not guarantees.
Landlord ↔ Tenant lean methodology
- Overall (CITY)
- 0 Strongly Tenant-Friendly
- State California
- 18 Strongly Tenant-Friendly · D+13
- County
- — inherits STATE
- City Los Angeles
- 0 Strongly Tenant-Friendly · D+22
ZIP-level market 90023
- Rents YoY
- 0.2%
- Active inventory
- 57
- Price-to-rent
- 19.1×
Monthly cashflow live
- Estimated rent
- $3,744 high interval (Pro) →
- Mortgage (P&I)
- −$2,255
- Tax from tax record
- −$98 /mo · $1,170/yr
- Insurance
- −$179
- HOA
- −$0
- Vacancy / Maint / Mgmt
- −$786
- Net cashflow
- $426
Break-even live
2-unit breakdown (identical units grouped — click to expand)
| Units | Beds | Baths | Est. rent |
|---|---|---|---|
| 2× units | 1 | — | $3,744 |
| #1 | 1 | — | $1,872 |
| #2 | 1 | — | $1,872 |
| Total (2 units) | $3,744 | ||
UW: 25.0% down · 7.5% · 30yr · 1.5% tax · 5.0% vac · 8.0% maint · 8.0% mgmt
Financing live
Cash to close
- Down payment
- $107,500
- Closing costs
- $12,900
- Reserves months
- —
- Total cash needed
- —
Loan-product check · same deal, 3 products live
Conventional
25% down · 7.5% · 30yr
- Down + closing
- —
- Monthly P&I
- —
- Monthly cashflow
- —
- DSCR
- —
- Eligible?
- —
Personal DTI + credit; lowest rate.
DSCR
20% down · 8.5% · 30yr
- Down + closing
- —
- Monthly P&I
- —
- Monthly cashflow
- —
- DSCR
- —
- Eligible?
- —
No personal income docs; deal must DSCR.
Hard money
10% down · 12.0% · 12mo
- Down + closing
- —
- Monthly P&I
- —
- Monthly cashflow
- —
- DSCR
- —
- Eligible?
- —
Short-term bridge; refi at stabilization.
Rent comps 40 comps
| Address | Beds | Baths | Sqft | Rent | $/sqft | DOM | Units | Dist |
|---|---|---|---|---|---|---|---|---|
| 969 S Lorena St Unit 1/2 Commerce, CA | 2.0 | 2.5 | 1100 | $2,600 | $2.36 | 7d | 1 | 0.14mi |
| 969 S Lorena St Unit 1/2 Commerce, CA | 2.0 | 2.5 | 1100 | $2,600 | $2.36 | 5d | 1 | 0.14mi |
| 3420 Percy St Unit 3 Los Angeles, CA | 1.0 | 1.0 | 600 | $1,750 | $2.92 | 43d | 1 | 0.16mi |
| 3466 E 8th St Los Angeles, CA | 3.0 | 1.0 | 1104 | $3,150 | $2.85 | 7d | 1 | 0.42mi |
| 1129 La Puerta St Los Angeles, CA | 3.0 | 1.0 | 844 | $3,600 | $4.27 | 43d | 1 | 0.60mi |
| 3059 E 5th St Los Angeles, CA | 1.0 | 1.0 | 530 | $1,800 | $3.40 | 43d | 1 | 0.62mi |
| 3824 Princeton St Los Angeles, CA | 2.0 | 1.0 | 980 | $2,380 | $2.43 | 14d | 1 | 0.67mi |
| 2853 E 6th St Unit 2 Los Angeles, CA | 2.0 | 1.0 | 1000 | $2,800 | $2.80 | 43d | 1 | 0.69mi |
| 2853 E 6th St Los Angeles, CA | 2.0 | 1.0 | 552 | $2,000 | $3.62 | 44d | 1 | 0.69mi |
| 2855 1/2 E 6th St Los Angeles, CA | 3.0 | 1.0 | 1000 | $3,500 | $3.50 | 43d | 1 | 0.69mi |
| 2752 Guirado St Los Angeles, CA | 3.0 | 2.0 | 1100 | $3,300 | $3.00 | 14d | 1 | 0.77mi |
| 607 Camulos St Los Angeles, CA | 1.0 | 1.0 | 600 | $1,600 | $2.67 | 43d | 1 | 0.78mi |
| 1157 S Townsend Ave Los Angeles, CA | 3.0 | 1.0 | 700 | $2,775 | $3.96 | 24d | 1 | 0.79mi |
| 2735 E 6th St Los Angeles, CA | 1.0 | 1.0 | 520 | $2,245 | $4.31 | 3d | 43 | 0.83mi |
| 1149 Marietta St Los Angeles, CA | 1.0 | 1.0 | 650 | $2,100 | $3.23 | 22d | 1 | 0.84mi |
| 2901 E Olympic Blvd Los Angeles, CA | 2.0 | 1.0 | 565 | $2,400 | $4.25 | 43d | 14 | 0.91mi |
| 2901 E Olympic Blvd Los Angeles, CA | 3.0 | 1.0 | 711 | $2,400 | $3.38 | 2d | 11 | 0.91mi |
| 460 S Mott St Los Angeles, CA | 2.0 | 2.0 | 736 | $3,500 | $4.76 | 43d | 1 | 0.93mi |
| 652 S Mathews St Unit 2508 Los Angeles, CA | 2.0 | 1.0 | 572 | $2,900 | $5.07 | 15d | 1 | 0.98mi |
| 132 N Ditman Ave Los Angeles, CA | 3.0 | 2.0 | 1000 | $2,875 | $2.88 | 24d | 1 | 0.99mi |
| 2617 E 4th St Los Angeles, CA | 1.0 | 1.0 | 527 | $1,950 | $3.70 | 43d | 1 | 1.05mi |
| 321 S Fickett St Unit 503 Los Angeles, CA | 2.0 | 1.0 | 900 | $2,495 | $2.77 | 7d | 1 | 1.11mi |
| 1140 S Record Ave Los Angeles, CA | 2.0 | 1.0 | 800 | $2,700 | $3.38 | 43d | 1 | 1.11mi |
| 215 S Fickett St Unit 5 Los Angeles, CA | 2.0 | 1.0 | 750 | $1,913 | $2.55 | 10d | 1 | 1.13mi |
| 215 S Fickett St Unit 5 Los Angeles, CA | 2.0 | 1.0 | 750 | $1,913 | $2.55 | 7d | 1 | 1.13mi |
| 1050 1/2 S Bonnie Beach Pl Los Angeles, CA | 2.0 | 1.5 | 985 | $2,562 | $2.60 | 24d | 1 | 1.16mi |
| 220 N Saratoga St Los Angeles, CA | 1.0 | 1.0 | 600 | $1,800 | $3.00 | 43d | 1 | 1.18mi |
| 456 S Breed St Unit 28 Los Angeles, CA | 2.0 | 2.0 | 613 | $2,650 | $4.32 | 43d | 1 | 1.21mi |
| 456 S Breed St Los Angeles, CA | 1.0 | 1.0 | 574 | $1,775 | $3.09 | 24d | 3 | 1.22mi |
| 456 S Breed St Apt 207 Los Angeles, CA | 1.0 | 1.0 | 550 | $1,925 | $3.50 | 43d | 1 | 1.22mi |
| 924 S Sunol Dr Unit 1/2 Los Angeles, CA | 3.0 | 2.0 | 1040 | $3,000 | $2.88 | 24d | 1 | 1.23mi |
| 116 S Mathews St Los Angeles, CA | 1.0 | 1.0 | 700 | $1,575 | $2.25 | 43d | 1 | 1.25mi |
| 150 1/2 S Bonnie Beach Pl Los Angeles, CA | 1.0 | 1.0 | 700 | $1,800 | $2.57 | 24d | 1 | 1.27mi |
| 201 S Soto St Unit 04 Los Angeles, CA | 1.0 | 1.0 | 650 | $1,850 | $2.85 | 43d | 1 | 1.29mi |
| 215 N Fickett St Unit 5 Los Angeles, CA | 2.0 | 1.0 | 750 | $1,913 | $2.55 | 4d | 1 | 1.29mi |
| 215 N Fickett St Unit 5 Los Angeles, CA | 2.0 | 1.0 | 750 | $1,913 | $2.55 | 14d | 1 | 1.29mi |
| 215 N Fickett St Los Angeles, CA | 2.0 | 1.0 | 750 | $2,195 | $2.93 | 16d | 1 | 1.29mi |
| 215 N Fickett St Unit 5 Los Angeles, CA | 2.0 | 1.0 | 750 | $1,913 | $2.55 | 5d | 1 | 1.29mi |
| 215 N Fickett St Los Angeles, CA | 2.0 | 1.0 | 750 | $1,913 | $2.55 | 11d | 1 | 1.29mi |
| 2819 Folsom St Los Angeles, CA | 2.0 | 1.0 | 800 | $2,800 | $3.50 | 43d | 1 | 1.36mi |
Listing history 5 events
-
2026-06-02days on market $430,000 Active 6 DOM
-
2026-06-01days on market $430,000 Active 5 DOM
-
2026-05-31days on market $430,000 Active 4 DOM
-
2026-05-27$430,000 Active
-
2026-05-27historical $430,000
ⓘ Source: listings_history table (triggers on properties + properties_extension) + one-shot
backfill from property_details.listing_events for pre-trigger history.
Tax reassessment forecast CA · Resets to sale price
- Current annual tax
- $1,170 · $98/mo
- Projected year-2 tax
- $3,268 · $272/mo
- Expected delta
- +$2,098/yr (+$175/mo · 179.2%)
ⓘ Screening estimate from a state-policy table — verify with the county assessor before closing.
Climate risk First Street
- Flood 1/10 Low FEMA zone X (unshaded) · 0% chance over 30 yrs
- Wildfire 1/10 Low
- Heat 6/10 Major 7 d/yr ≥94°F today · 21 d/yr by 30 yrs out
- Wind 1/10 Low
- Air quality 5/10 Major 9 unhealthy d/yr today · 9 by 30 yrs out
Nearby sold comps map
Loading sold comps map…
Walkable amenities ~0.75 mi
Loading nearby amenities…
Taxation est. · year 1
- Rental income
- $44,928
- − Mortgage interest
- −$24,087
- − Property taxes
- −$1,170
- − Insurance
- −$2,150
- − Repairs & maintenance
- −$3,594
- − Management
- −$3,594
- − Depreciation
- −$12,509
- Taxable loss
- −$2,177
- Est. tax savings @ 24.0%
- +$522
- After-tax cash flow
- $5,635/yr
For passive investors: Depreciation is non-cash, so a rental often shows a tax loss while cash-flowing — sheltering income. Rental losses are passive: they offset passive income freely, and up to $25,000/yr can offset ordinary (W-2) income if you actively participate and your MAGI is under $100k (phasing out to $0 by $150k); unused losses carry forward. On sale, claimed depreciation is recaptured at up to 25%, and gains may owe capital-gains tax (a 1031 exchange can defer both). Figures are a year-1 estimate at your 24.0% rate — not tax advice; consult a CPA.
Schools (NCES district)
- District
- Los Angeles Unified
- NCES district ID
- 0622710
- Math proficiency
- 29% ▼ -4.00%
- Reading proficiency
- 54% ▲ 10.00%
- Median HH income
- $50,403
- Composite
- 35.67/100
- National rank
- #4875
- State rank
- #223 of 517 in CA
Livability — Los Angeles
- Score
- 68/100
- State rank
- #273
- US rank
- #9237
Category grades
Schools grade is shown separately in the Schools card above.
Census & demographics
- Census place
- Los Angeles, CA
- County
- Los Angeles County · 9,444,647 people
- City population
- 3,838,149
- Metro
- Los Angeles-Long Beach-Anaheim, CA
- Population (ZIP)
- 43,857
- Household income
- $59,057
- Rent vs Own
- Severe rent burden
- 2670.0
Population outlook (Los Angeles County) Hauer SSP2
- Today (2025)
- 10,940,515 people
- By 2030
- 11,256,481 · +2.9%
- By 2040
- 11,729,929 · +7.2%
- By 2050
- 11,948,407 · +9.2%
- By 2075
- 11,818,114 · +8.0%
- By 2100
- 10,842,928 · -0.9%
Race, ethnicity, and origin ACS 2023
- Neighborhood character
- Predominantly Hispanic (96%)
- Race & ethnicity
- Hispanic / Latino 96% Two or more races 17% Native American 2% White 2%
- Hispanic origin (detail)
- Mexican 80%
- Common ancestry
- Italian 1%
- Foreign-born
- 41% · Canada, Jamaica
- Languages at home
- 16% English-only · Spanish 83%
Political lean MEDSL · Los Angeles
- 2024 margin
- Solid D (+32.9) · D 64.8% · R 31.9% · Other 3.3%
- 2008→2024 swing
- -7.4pp toward R · 2008: 40.4pp · 2024: 32.9pp
- All cycles
- 2024: D+32.9 2020: D+44.2 2016: D+48.0 2012: D+40.0 2008: D+40.4
Not yet ingested
- Civics
- —
Market trends
- HPI YoY
- ▼ -702.74%
- Current HPI
- 430.9762
- Rent YoY
- ▲ 0.21%
- Metro
- Los Angeles-Long Beach-Anaheim, CA
- State GDP YoY
- ▲ 3.21%
- F500 in state
- 116
Industry mix (Fortune 500 HQ in CA)
| Industry | F500 HQs | Revenue |
|---|---|---|
| Technology | 27 | $1,492B |
|
||
| Financial Services | 3 | $174B |
|
||
| Retail | 3 | $44B |
|
||
| Insurance | 3 | $26B |
|
||
| Media / Entertainment | 2 | $115B |
|
||
| Pharmaceuticals / Biotech | 2 | $62B |
|
||
Price history
+0.0% since first listed2 events — show timeline
- 2026-05-27 Listed $430,000 CRMLS
- 2026-05-27 Coming Soon $430,000 CRMLS
Property tax history
+2.6%/yrLatest (2025): $1,170 · +4.2% YoY. Source: county tax records.
Cash-flow waterfall
monthlySold comps — $/sqft
last 12 mo · ≤1 miLoading sold comps…