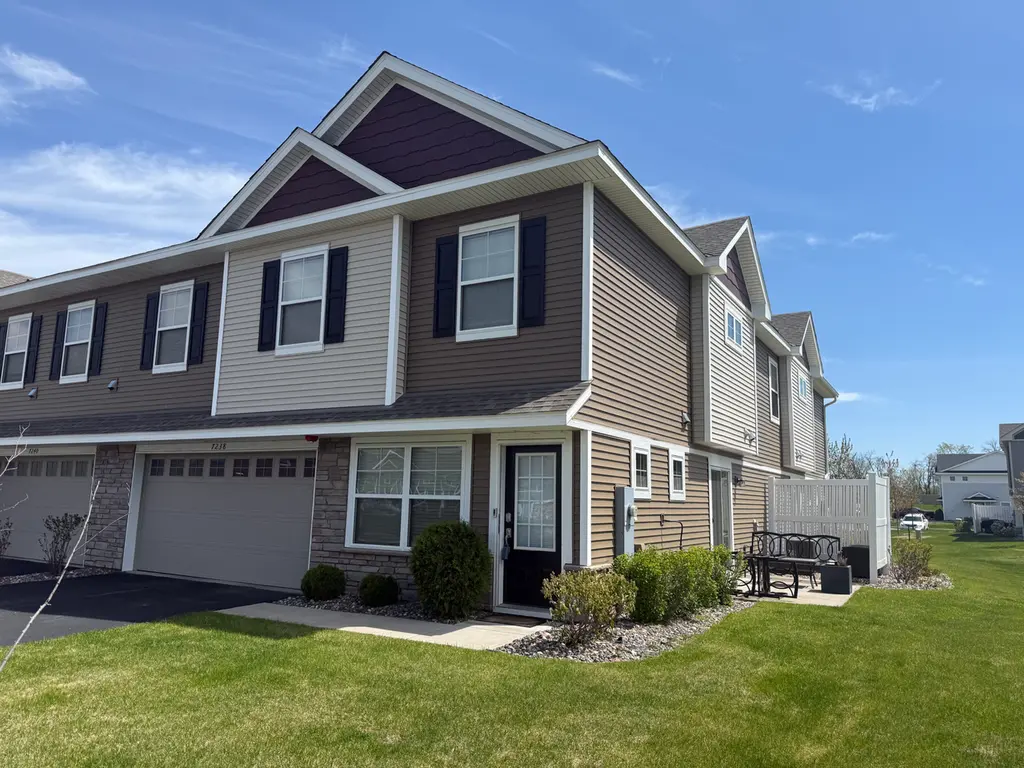
7238 Dora Dr · Lino Lakes, MN
Flood risk 1/10 · Minimal
- FEMA flood zone
- X (unshaded)
- Chance of flooding over 30 yrs
- 0.0%
- Est. flood insurance / yr
- $507 – $1,088
Fire risk 1/10 · Minimal
- Est. fire insurance / yr
- $888 – $1,650
Heat risk 2/10 · Minimal
- Hot days now (above 99°F)
- 7 days/yr
- Hot days in 30 yrs
- 14 days/yr
Wind risk 2/10 · Minimal
- Chance of severe wind over 30 yrs
- —
Air-quality risk 2/10 · Minimal
- Unhealthy air days now
- 1 days/yr
- Unhealthy air days in 30 yrs
- 2 days/yr
Risk factors via First Street. Map © Google.
Why this score? — see what drove the D- grade
The composite is a weighted blend of 9 inputs, each scored 0–100. Each bar is that input's sub-score; the figure is the points it added to the 100-point composite (weight × sub-score).
- Cash flow +9.5/30.0
- ARV discount +7.0/15.0
- Schools +4.6/10.0
- Livability +3.6/5.0
- 1% rule +3.4/10.0
- DSCR +2.7/10.0
- Rent growth +2.5/5.0
- Condition / age +2.5/5.0
- Appreciation +0.0/10.0
$339,900
🖨 Deal sheet 📄 Offer letter ✓ Due diligence
Listing remarks
The great desirable rare offering of a virtually new, mint condition, south facing, end unit townhome! Prime location in development with park across the street, trails, a phenomenal community center that boasts gathering space with commercial grade kitchen, conference center, work-out facilities, tennis/pickle ball courts, custom playground and more! This is really a treat! Two story style end unit with 3 bedrooms and family room on one level, upper level laundry, huge primary suite with all the upgrades! Kitchen center island, 3 baths, patio, super friendly floor plan and much more! Your dream home awaits. .. .
Key facts
- Conference center
- End unit
- Tennis courts
Tags
Property features AI
Finance
- Other: Shared community rooms and amenities: clubhouse, community room, exercise room, play area, business center, amusement/party room
- HOA & community: HOA managed by Associa MN; Monthly association fee; Association amenities include patio, tennis courts, trails, fire sprinkler system, shared amenities; Association fee covers hazard insurance, lawn care, grounds maintenance, professional management, snow removal, shared amenities
Exterior
- Parking: Attached insulated garage with garage door opener; Asphalt driveway; Guest parking; 2-car garage (approx. 22 x 18)
- Utilities: City water (connected); City sewer (connected); 150 amp electrical service; Natural gas
- Home design: Residential attached property; Two levels; Primary living level plus upper level
- Construction: Slab foundation; Roof replaced/updated within last 8 years
- Exterior features: Patio; Stone and vinyl exterior; Light tree coverage; In-ground sprinkler system
Interior
- Kitchen: Range; Microwave; Dishwasher; Refrigerator; Stainless steel appliances; Kitchen island; Breakfast bar
- Bedrooms: 3 bedrooms total; Primary bedroom suite on main level; Other bedrooms located on upper level
- Bathrooms: Main floor half bath; Primary bath is 3/4 with double sink and private shower; Upper level includes a 3/4 bath and a full bath
- Heating & cooling: Forced air heating; Central air conditioning; Electric water heater
- Interior features: Air-to-air exchanger; Exhaust fan; Humidifier; Water softener (owned); Paneled doors; Indoor sprinkler system; Kitchen center island; Primary bedroom walk-in closet; Walk-in closet; Primary bedroom suite; Breakfast bar; Informal dining area; Living/dining room configuration; No basement
- Laundry & utility: Washer hookup; Dryer; Washer; Laundry located in hall/upper level with laundry closet
Neighborhood map
What this means for you Summary
Snapshot
- This is a 3-bed/3.0-bath townhouse listed at $340k.
Deal economics
- At list price, monthly cash flow is $-234 ($-3k/yr) — negative.
- To cash-flow at today's rent, offer at most $299k (12.1% below list).
- To meet the 1% rule (rent ≥ 1% of price), the offer needs to be $286k (15.9% below list).
- Recommended offer: $286k (15.9% below list) — sets the bar for 1% rule.
- Cap rate 5.5% vs local median 3.1% in Lino Lakes — top-decile yield for the area; either an underpriced asset or a hidden risk that comps aren't pricing in. Stress-test before assuming the spread holds.
Location & tenants
- Location reads 72/100 on livability (#287 in MN) — a middle-class / working-renter tenant base. Strengths: crime A+, employment A+, housing A+; Watch: cost of living D+, amenities F, commute F.
- White Bear Lake School District (suburban): math 45% / reading 57% proficiency, ranked #83 of 301 in MN (top 28%) — acceptable for families but not a draw, mixed tenant base, ~2y average lease.
- Market conditions: 279 active listings in the ZIP; 2 comparable units currently listed for rent nearby; high-income renter base; 1,083 units permitted in Anoka County in 2024 (134 in 5+ unit buildings).
Forward outlook
- Local home prices are declining (-3.0%/yr); year-one equity from $2k of loan paydown is wiped out by about $10k of value loss. Plan a longer hold.
- Anoka County population projected at +11% by 2050 — modest demand growth; plan on rents tracking national, not racing it.
Negotiation context
- It's been on market 35 days — a 3% lower offer ($330k) is reasonable based on typical stale-listing flexibility.
- 5 sale attempts since 5y ago with the ask held roughly flat each time — persistent listings suggest the price (not the market) is what's stuck; bring a comps-based counter.
Questions for the listing agent
- What do current leases actually rent for vs. the listed asking? Can we see a recent rent roll and the last 12 months of T-12 income?
- It's been on market 35 days. Have you received any prior offers? Is the seller open to a 16% concession, seller financing, or rate buy-down credit?
- What does the HOA fee cover, when was the last increase, and are there any pending special assessments or reserve-fund shortfalls?
- Is there a deadline driving the sale (1031 exchange, divorce, estate, relocation)? That informs how much negotiation room exists.
- Schools are B-rated — typically a magnet for longer-tenancy family renters. What's the average tenant stay here, and is there a school-zone premium baked into asking?
- The area grade is low — what's the realistic commute time and amenity access for the typical tenant pool here? Any planned neighborhood developments (good or bad) we should know about?
- What's the average days-on-market for RENTAL listings here right now (not sales)? A rising rental-DOM trend means longer vacancies and softer asking-rent achievability than the comps imply.
- What's the recent tenant-quality profile in this submarket — average credit score on applications, eviction rate, late-payment / NSF rate, and stable-employment percentage? A property-management company in the area should have these aggregated.
- How much new for-sale + rental construction is in the pipeline within 1–3 miles? Heavy new supply typically softens prices + rents 12–24 months out; constrained supply supports both.
Investment metrics
- 1% rule
- 0.84% ✗
- Cap rate
- 5.47%
- Cash-on-cash
- -2.94%
- DSCR
- 0.87
- GRM
- 9.9
CMA / ARV
- ARV (median comp)
- $336,498
- List price
- $339,900
- Delta
- 1.01%
- Verdict
- FAIR
- Comps
- 3 within 2.0 mi
Projected returns pro-forma
-3.0% appreciation · 3.0% rent growth · sell at horizon
- IRR
- -21.2%
- Equity multiple
- 0.27×
- Total profit
- $-69,820
- Equity at exit
- $50,680
- IRR
- -14.5%
- Equity multiple
- 0.17×
- Total profit
- $-79,417
- Equity at exit
- $29,388
Cash invested: $95,172 (down + closing). Projections, not guarantees.
Landlord ↔ Tenant lean methodology
- Overall (STATE)
- 46 Balanced
- State Minnesota
- 46 Balanced · D+2
- County
- — inherits STATE
- City
- — inherits STATE
ZIP-level market 55038
- Home prices YoY
- -31.6%
- Active inventory
- 279
- Price-to-rent
- 9.9×
Monthly cashflow live
- Estimated rent
- $2,858 medium interval (Pro) →
- Mortgage (P&I)
- −$1,782
- Tax from tax record
- −$304 /mo · $3,652/yr
- Insurance
- −$142
- HOA
- −$263
- Vacancy / Maint / Mgmt
- −$600
- Net cashflow
- $-234
Break-even live
UW: 25.0% down · 7.5% · 30yr · 1.5% tax · 5.0% vac · 8.0% maint · 8.0% mgmt
Financing live
Cash to close
- Down payment
- $84,975
- Closing costs
- $10,197
- Reserves months
- —
- Total cash needed
- —
Loan-product check · same deal, 3 products live
Conventional
25% down · 7.5% · 30yr
- Down + closing
- —
- Monthly P&I
- —
- Monthly cashflow
- —
- DSCR
- —
- Eligible?
- —
Personal DTI + credit; lowest rate.
DSCR
20% down · 8.5% · 30yr
- Down + closing
- —
- Monthly P&I
- —
- Monthly cashflow
- —
- DSCR
- —
- Eligible?
- —
No personal income docs; deal must DSCR.
Hard money
10% down · 12.0% · 12mo
- Down + closing
- —
- Monthly P&I
- —
- Monthly cashflow
- —
- DSCR
- —
- Eligible?
- —
Short-term bridge; refi at stabilization.
Rent comps 2 comps
| Address | Beds | Baths | Sqft | Rent | $/sqft | DOM | Units | Dist |
|---|---|---|---|---|---|---|---|---|
| 4631 Rosemary Way Hugo, MN | 3.0 | 1.0–2.0 | 963 | $2,800 | $2.91 | 1d | 1 | 1.00mi |
| 15119 Fanning Dr N Hugo, MN | 4.0 | 3.0 | 1982 | $2,750 | $1.39 | 2d | 1 | 1.49mi |
HOA detail
- Monthly dues
- $263 · $3,156/yr
Listing history 23 events
-
2026-06-18days on market $339,900 Active 35 DOM
-
2026-06-17days on market $339,900 Active 34 DOM
-
2026-06-16days on market $339,900 Active 33 DOM
-
2026-06-15days on market $339,900 Active 32 DOM
-
2026-06-13days on market $339,900 Active 30 DOM
-
2026-06-13days on market $339,900 Active 29 DOM
-
2026-06-09days on market $339,900 Active 26 DOM
-
2026-06-08days on market $339,900 Active 25 DOM
-
2026-06-07days on market $339,900 Active 24 DOM
-
2026-06-04days on market $339,900 Active 21 DOM
-
2026-06-03days on market $339,900 Active 20 DOM
-
2026-06-02days on market $339,900 Active 19 DOM
-
2026-06-01days on market $339,900 Active 18 DOM
-
2026-05-31days on market $339,900 Active 17 DOM
-
2026-05-14$339,900 Active 618-char remark
-
2026-05-14historical
-
2026-05-08status Active
-
2026-05-06historical
-
2026-05-01status Active
-
2026-04-25historical
-
2026-03-05$345,000 Active
-
2021-10-08$327,640
-
2021-10-08historical
ⓘ Source: listings_history table (triggers on properties + properties_extension) + one-shot
backfill from property_details.listing_events for pre-trigger history.
Tax reassessment forecast MN · Partial reset (capped growth)
- Current annual tax
- $3,652 · $304/mo
- Projected year-2 tax
- $3,729 · $311/mo
- Expected delta
- +$77/yr (+$6/mo · 2.1%)
ⓘ Screening estimate from a state-policy table — verify with the county assessor before closing.
Climate risk First Street
- Flood 1/10 Low FEMA zone X (unshaded) · 0% chance over 30 yrs
- Wildfire 1/10 Low
- Heat 2/10 Low 7 d/yr ≥99°F today · 14 d/yr by 30 yrs out
- Wind 2/10 Low
- Air quality 2/10 Low 1 unhealthy d/yr today · 2 by 30 yrs out
Nearby sold comps map
Loading sold comps map…
Walkable amenities ~0.75 mi
Loading nearby amenities…
Taxation est. · year 1
- Rental income
- $34,298
- − Mortgage interest
- −$19,040
- − Property taxes
- −$3,652
- − Insurance
- −$1,700
- − Repairs & maintenance
- −$2,744
- − Management
- −$2,744
- − HOA
- −$3,156
- − Depreciation
- −$9,888
- Taxable loss
- −$8,625
- Est. tax savings @ 24.0%
- +$2,070
- After-tax cash flow
- $-732/yr
For passive investors: Depreciation is non-cash, so a rental often shows a tax loss while cash-flowing — sheltering income. Rental losses are passive: they offset passive income freely, and up to $25,000/yr can offset ordinary (W-2) income if you actively participate and your MAGI is under $100k (phasing out to $0 by $150k); unused losses carry forward. On sale, claimed depreciation is recaptured at up to 25%, and gains may owe capital-gains tax (a 1031 exchange can defer both). Figures are a year-1 estimate at your 24.0% rate — not tax advice; consult a CPA.
Schools (NCES district)
- District
- White Bear Lake School District
- NCES district ID
- 2742360
- Math proficiency
- 45% ▼ -18.00%
- Reading proficiency
- 57% ▼ -8.00%
- Median HH income
- $73,051
- Composite
- 45.78/100
- National rank
- #2564
- State rank
- #83 of 301 in MN
Livability — Lino Lakes
- Score
- 72/100
- State rank
- #287
- US rank
- #6259
Category grades
Schools grade is shown separately in the Schools card above.
Census & demographics
- Census place
- Lino Lakes, MN
- County
- Washington County · 235,613 people
- City population
- 28,975
- Metro
- Minneapolis-St. Paul-Bloomington, MN-WI
- Population (ZIP)
- 25,061
- Household income
- $130,931
- Rent vs Own
- Severe rent burden
- 222.0
Population outlook (Anoka County) Hauer SSP2
- Today (2025)
- 375,223 people
- By 2030
- 387,850 · +3.4%
- By 2040
- 407,239 · +8.5%
- By 2050
- 417,541 · +11.3%
- By 2075
- 448,447 · +19.5%
- By 2100
- 464,954 · +23.9%
Race, ethnicity, and origin ACS 2023
- Neighborhood character
- Predominantly White (87%)
- Race & ethnicity
- White 87% Asian 4% Two or more races 4% Hispanic / Latino 3% Black 3%
- Common ancestry
- Portuguese 14% Lithuanian 7% Romanian 4%
- Foreign-born
- 3% · Canada
- Languages at home
- 95% English-only · Other Asian/Pacific 2% Spanish 1%
Political lean MEDSL · Anoka
- 2024 margin
- Toss-up / Even · D 46.6% · R 51.0% · Other 2.4%
- 2008→2024 swing
- -2.0pp toward R · 2008: -2.4pp · 2024: -4.4pp
- All cycles
- 2024: R+4.4 2020: R+1.9 2016: R+9.7 2012: R+2.6 2008: R+2.4
Not yet ingested
- Civics
- —
Market trends
- HPI YoY
- ▼ -103.33%
- Current HPI
- 223.6524
- Rent YoY
- —
- Metro
- Minneapolis-St. Paul-Bloomington, MN-WI
- State GDP YoY
- ▲ 2.41%
- F500 in state
- 34
Industry mix (Fortune 500 HQ in MN)
| Industry | F500 HQs | Revenue |
|---|---|---|
| Healthcare | 2 | $407B |
|
||
| Retail | 2 | $150B |
|
||
| Consumer Goods | 2 | $32B |
|
||
| Industrial Machinery | 2 | $6B |
|
||
| Agriculture | 1 | $40B |
|
||
| Healthcare / Medical Devices | 1 | $32B |
|
||
Price history
+3.7% since first listed9 events — show timeline
- 2026-05-14 Listing Removed — NORTHSTARMLS as Distributed by MLS Grid
- 2026-05-14 Listed $339,900 NORTHSTARMLS as Distributed by MLS Grid
- 2026-05-08 Relisted — NORTHSTARMLS as Distributed by MLS Grid
- 2026-05-06 Listing Removed — NORTHSTARMLS as Distributed by MLS Grid
- 2026-05-01 Relisted — NORTHSTARMLS as Distributed by MLS Grid
- 2026-04-25 Listing Removed — NORTHSTARMLS as Distributed by MLS Grid
- 2026-03-05 Listed $345,000 NORTHSTARMLS as Distributed by MLS Grid
- 2021-10-08 Listing Removed — NORTHSTARMLS as Distributed by MLS Grid
- 2021-10-08 Listed $327,640 NORTHSTARMLS as Distributed by MLS Grid
Property tax history
+34.6%/yrLatest (2026): $3,652 · +5.4% YoY. Source: county tax records.
Cash-flow waterfall
monthlySold comps — $/sqft
last 12 mo · ≤1 miLoading sold comps…