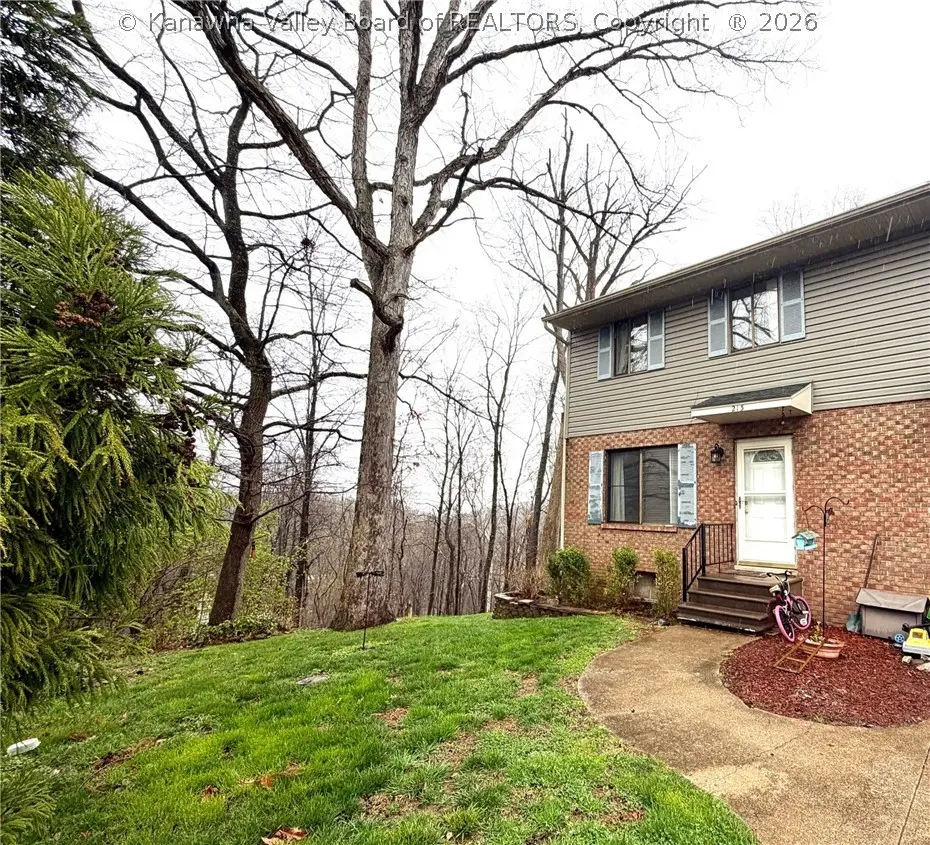
213 Walker Drive Dr · Dunbar, WV
Flood risk 1/10 · Minimal
- FEMA flood zone
- X (unshaded)
- Chance of flooding over 30 yrs
- 0.0%
- Est. flood insurance / yr
- $473 – $860
Fire risk 5/10 · Moderate
- Est. fire insurance / yr
- $787 – $1,461
Heat risk 4/10 · Minor
- Hot days now (above 101°F)
- 7 days/yr
- Hot days in 30 yrs
- 18 days/yr
Wind risk 2/10 · Minimal
- Chance of severe wind over 30 yrs
- 1.0%
Air-quality risk 1/10 · Minimal
- Unhealthy air days now
- 0 days/yr
- Unhealthy air days in 30 yrs
- 0 days/yr
Risk factors via First Street. Map © Google.
Why this score? — see what drove the B- grade
The composite is a weighted blend of 9 inputs, each scored 0–100. Each bar is that input's sub-score; the figure is the points it added to the 100-point composite (weight × sub-score).
- Cash flow +26.3/30.0
- ARV discount +15.0/15.0
- DSCR +8.9/10.0
- 1% rule +8.0/10.0
- Livability +3.5/5.0
- Schools +2.9/10.0
- Rent growth +2.5/5.0
- Condition / age +2.2/5.0
- Appreciation +0.0/10.0
$99,900
🖨 Deal sheet 📄 Offer letter ✓ Due diligence
Listing remarks
Great opportunity for a 3 bedroom 1.5 bath Townhome close to Charleston and near the interstate. This unit is priced to sell well below property values of the townhomes. Would make a good flip or investment property. Needs some TLC and updating. Cash or Renovation loan only. Selling AS IS
Key facts
- $75 HOA
- Built 1980
- Listed 80 days
Property features AI
Finance
- HOA & community: Homeowners association with $900 annual fee ($75/month equivalent)
Exterior
- Parking: Parking pad
- Utilities: Public water; Public sewer
- Home design: Townhouse; Two levels / 2 stories
- Construction: Block and frame construction; Composition/shingle roof
- Exterior features: Deck; Porch
Interior
- Bedrooms: Total rooms: 8
- Flooring: Carpet
- Bathrooms: 1 full bathroom; 1 half bathroom
- Heating & cooling: Electric heating; Forced air heating; Central air conditioning
- Interior features: Insulated windows; Full basement
Neighborhood map
What this means for you Summary
Snapshot
- This is a 3-bed/1.5-bath townhouse listed at $100k. Condition is rated fair.
Deal economics
- At list price, monthly cash flow is $258 ($3k/yr) — positive.
- The deal already cash-flows at list — no discount required.
- Meets the 1% rule at list price ($1k rent vs $100k).
- Recommended offer: $94k (6.0% below list) — sets the bar for market timing.
- Cap rate 9.4% vs local median 4.2% in Dunbar — top-decile yield for the area; either an underpriced asset or a hidden risk that comps aren't pricing in. Stress-test before assuming the spread holds.
Location & tenants
- Location reads 70/100 on livability (#62 in WV) — a middle-class / working-renter tenant base. Strengths: cost of living A+, housing A+, health & safety B+; Watch: employment D+, amenities F, commute F.
- Kanawha County Schools (suburban): math 29% / reading 40% proficiency, ranked #17 of 55 in WV (top 31%) — families likely to look elsewhere, expect single-tenant / working-renter base with shorter leases.
- Zoned schools: Dunbar Primary Center (297 students, 0% FRL); Dunbar Middle School (math 22% / reading 37%, grade F, #61 of 109 statewide, top 56%, 300 students, 0% FRL); South Charleston High School (math 22% / reading 47%, grade F, #42 of 110 statewide, top 47%, 952 students, 0% FRL) — zoned schools average 0% FRL vs 46% district-wide (46 pts lower); this property's tenant base skews higher-income than the district average.
- Market conditions: 46 active listings in the ZIP; 103 units permitted in Kanawha County in 2024 (0 in 5+ unit buildings).
Forward outlook
- Local home prices are declining (-3.0%/yr); year-one equity from $691 of loan paydown is wiped out by about $3k of value loss. Plan a longer hold.
- Kanawha County population projected at -17% by 2050 — secular population decline; favor cash flow + early exit over multi-decade hold.
- At projected returns (-3.0% appreciation + 3.0% rent growth), your $28k cash investment doubles in ~10 years — after that, you're playing with house money.
Negotiation context
- It's been on market 81 days — a 6% lower offer ($94k) is reasonable based on typical stale-listing flexibility.
- 3 sale attempts with the ask held roughly flat each time — persistent listings suggest the price (not the market) is what's stuck; bring a comps-based counter.
Risks & watch-outs
- Climate carrying-cost: moderate wildfire risk — expect insurance premiums to compound above CPI over the hold.
Questions for the listing agent
- It's been on market 81 days. Have you received any prior offers? Is the seller open to a 6% concession, seller financing, or rate buy-down credit?
- Have any recent inspections been done? Can we get a copy of the seller's disclosures and any deferred-maintenance estimates?
- What does the HOA fee cover, when was the last increase, and are there any pending special assessments or reserve-fund shortfalls?
- Why hasn't it sold? Are there any deal-killer items the seller is aware of (foundation, flood, title, zoning, code violations)?
- Is there a deadline driving the sale (1031 exchange, divorce, estate, relocation)? That informs how much negotiation room exists.
- Schools are F-rated, which usually means shorter tenancies and higher turnover. Who's the typical renter profile here, and what's been the actual vacancy rate?
- What's the average days-on-market for RENTAL listings here right now (not sales)? A rising rental-DOM trend means longer vacancies and softer asking-rent achievability than the comps imply.
- What's the recent tenant-quality profile in this submarket — average credit score on applications, eviction rate, late-payment / NSF rate, and stable-employment percentage? A property-management company in the area should have these aggregated.
- How much new for-sale + rental construction is in the pipeline within 1–3 miles? Heavy new supply typically softens prices + rents 12–24 months out; constrained supply supports both.
Investment metrics
- 1% rule
- 1.30% ✓
- Cap rate
- 9.39%
- Cash-on-cash
- 11.06%
- DSCR
- 1.49
- GRM
- 6.4
CMA / ARV
- ARV (on-the-fly)
- $162,000
- Comps found
- 3
Show comp detail 3 sales within ~0.75 mi
| Address | Dist | Beds/Ba | Sqft | Sold | Price | $/sf | Match |
|---|---|---|---|---|---|---|---|
| 229 Walker Dr | 0.05mi | 3/2.5 | 2,160 (0%) | 10mo | $175,000 | $81 | 85 |
| 207 Walker Drive Dr | 0.02mi | 3/1.5 | 2,160 (0%) | 21mo | $132,000 | $61 | 82 |
| 791 Roxalana Hills Dr | 0.13mi | 3/3.5 | 2,100 (-3%) | 23mo | $158,000 | $75 | 62 |
Match score weights: distance 35% · size 25% · config 20% · recency 20%. Top-matched comps best support the ARV.
Projected returns pro-forma
-3.0% appreciation · 3.0% rent growth · sell at horizon
- IRR
- 0.3%
- Equity multiple
- 1.01×
- Total profit
- $291
- Equity at exit
- $14,895
- IRR
- 10.0%
- Equity multiple
- 1.77×
- Total profit
- $21,656
- Equity at exit
- $8,638
Cash invested: $27,972 (down + closing). Projections, not guarantees.
Landlord ↔ Tenant lean methodology
- Overall (STATE)
- 83 Strongly Landlord-Friendly
- State West Virginia
- 83 Strongly Landlord-Friendly · R+22
- County
- — inherits STATE
- City
- — inherits STATE
ZIP-level market 25064
- Home prices YoY
- -14.2%
- Active inventory
- 46
- Price-to-rent
- 6.4×
Monthly cashflow live
- Estimated rent
- $1,295 medium interval (Pro) →
- Mortgage (P&I)
- −$524
- Tax est. 1.5%
- −$125 /mo · $1,498/yr
- Insurance
- −$42
- HOA
- −$75
- Vacancy / Maint / Mgmt
- −$272
- Net cashflow
- $258
Break-even live
UW: 25.0% down · 7.5% · 30yr · 1.5% tax · 5.0% vac · 8.0% maint · 8.0% mgmt
Financing live
Cash to close
- Down payment
- $24,975
- Closing costs
- $2,997
- Reserves months
- —
- Total cash needed
- —
Loan-product check · same deal, 3 products live
Conventional
25% down · 7.5% · 30yr
- Down + closing
- —
- Monthly P&I
- —
- Monthly cashflow
- —
- DSCR
- —
- Eligible?
- —
Personal DTI + credit; lowest rate.
DSCR
20% down · 8.5% · 30yr
- Down + closing
- —
- Monthly P&I
- —
- Monthly cashflow
- —
- DSCR
- —
- Eligible?
- —
No personal income docs; deal must DSCR.
Hard money
10% down · 12.0% · 12mo
- Down + closing
- —
- Monthly P&I
- —
- Monthly cashflow
- —
- DSCR
- —
- Eligible?
- —
Short-term bridge; refi at stabilization.
HOA detail
- Monthly dues
- $75 · $900/yr
Listing history 22 events
-
2026-06-19days on market $99,900 Active 81 DOM
-
2026-06-18days on market $99,900 Active 80 DOM
-
2026-06-17days on market $99,900 Active 79 DOM
-
2026-06-16days on market $99,900 Active 78 DOM
-
2026-06-15days on market $99,900 Active 77 DOM
-
2026-06-14days on market $99,900 Active 75 DOM
-
2026-06-12days on market $99,900 Active 74 DOM
-
2026-06-09days on market $99,900 Active 71 DOM
-
2026-06-08days on market $99,900 Active 70 DOM
-
2026-06-07days on market $99,900 Active 69 DOM
-
2026-06-05days on market $99,900 Active 66 DOM
-
2026-06-03days on market $99,900 Active 65 DOM
-
2026-06-02days on market $99,900 Active 64 DOM
-
2026-06-01days on market $99,900 Active 63 DOM
-
2026-05-31days on market $99,900 Active 62 DOM
-
2026-05-30days on market $99,900 Active 61 DOM
-
2026-05-15price $99,900
-
2026-03-30$105,000 Active
-
2025-07-21$134,999 Active
-
2025-05-17price $139,000
-
2025-04-14price $144,000
-
2025-02-03$149,000 Active
ⓘ Source: listings_history table (triggers on properties + properties_extension) + one-shot
backfill from property_details.listing_events for pre-trigger history.
Climate risk First Street
- Flood 1/10 Low FEMA zone X (unshaded) · 0% chance over 30 yrs
- Wildfire 5/10 Major
- Heat 4/10 Moderate 7 d/yr ≥101°F today · 18 d/yr by 30 yrs out
- Wind 2/10 Low 100% chance of damaging wind over 30 yrs
- Air quality 1/10 Low 0 unhealthy d/yr today · 0 by 30 yrs out
Nearby sold comps map
Loading sold comps map…
Walkable amenities ~0.75 mi
Loading nearby amenities…
Taxation est. · year 1
- Rental income
- $15,541
- − Mortgage interest
- −$5,596
- − Property taxes
- −$1,498
- − Insurance
- −$500
- − Repairs & maintenance
- −$1,243
- − Management
- −$1,243
- − HOA
- −$900
- − Depreciation
- −$2,906
- Taxable income
- $1,654
- Est. tax owed @ 24.0%
- −$397
- After-tax cash flow
- $2,696/yr
For passive investors: Depreciation is non-cash, so a rental often shows a tax loss while cash-flowing — sheltering income. Rental losses are passive: they offset passive income freely, and up to $25,000/yr can offset ordinary (W-2) income if you actively participate and your MAGI is under $100k (phasing out to $0 by $150k); unused losses carry forward. On sale, claimed depreciation is recaptured at up to 25%, and gains may owe capital-gains tax (a 1031 exchange can defer both). Figures are a year-1 estimate at your 24.0% rate — not tax advice; consult a CPA.
Condition & rehab AI · 12 photos
This townhouse requires moderate renovations to improve its condition and appeal. Key updates include new kitchen appliances, bathroom fixtures, flooring, and landscaping.
Repairs flagged
- Major kitchen appliances — outdated and non-functional
- Major bathroom fixtures — non-functional and outdated
- Minor exterior siding — some wear
Value-add opportunities
- Resale new kitchen appliances — modern appliances improve appeal
- Resale new bathroom fixtures — modern fixtures improve appeal
- Both new flooring — new flooring improves both resale and rental value
- Both paint — fresh paint improves both resale and rental value
- Both landscaping — improved landscaping enhances curb appeal
Renovation cost estimate screening
| Repair item | Severity | Est. cost |
|---|---|---|
| kitchen appliances · outdated and non-functional | Major | $15,000–50,000 |
| bathroom fixtures · non-functional and outdated | Major | $15,000–50,000 |
| exterior siding · some wear | Minor | $500–3,000 |
| Total estimated repair cost · 3 items | $30,500–103,000 |
Value-add ROI direction
- Resale new kitchen appliances — modern appliances improve appeal ↑
- Resale new bathroom fixtures — modern fixtures improve appeal ↑
- Both new flooring — new flooring improves both resale and rental value ↑
- Both paint — fresh paint improves both resale and rental value ↑
- Both landscaping — improved landscaping enhances curb appeal ↑
ⓘ Cost ranges are severity-bucket heuristics (US national rule-of-thumb). Get contractor quotes + a written scope before underwriting a rehab budget.
Schools (NCES district)
- District
- Kanawha County Schools
- NCES district ID
- 5400600
- Math proficiency
- 29% ▼ -13.00%
- Reading proficiency
- 40% ▼ -7.00%
- Median HH income
- $44,329
- Composite
- 29.35/100
- National rank
- #6540
- State rank
- #17 of 55 in WV
Livability — Dunbar
- Score
- 70/100
- State rank
- #62
- US rank
- #7810
Category grades
Schools grade is shown separately in the Schools card above.
Census & demographics
- Census place
- Dunbar, WV
- Population (ZIP)
- 9,182
Population outlook (Kanawha County) Hauer SSP2
- Today (2025)
- 178,946 people
- By 2030
- 172,906 · -3.4%
- By 2040
- 159,874 · -10.7%
- By 2050
- 148,148 · -17.2%
- By 2075
- 123,257 · -31.1%
- By 2100
- 96,454 · -46.1%
Race, ethnicity, and origin ACS 2023
- Neighborhood character
- Predominantly White (72%)
- Race & ethnicity
- White 72% Black 16% Two or more races 7% Hispanic / Latino 3% Pacific Islander 2% Asian 1%
- Common ancestry
- Serbian 2% Italian 2% Slovak 2%
- Foreign-born
- 1% · Canada
- Languages at home
- 97% English-only · Spanish 1% Tagalog/Filipino 1%
Political lean MEDSL · Kanawha
- 2024 margin
- R (+17.4) · D 40.2% · R 57.6% · Other 2.2%
- 2008→2024 swing
- -17.0pp toward R · 2008: -0.4pp · 2024: -17.4pp
- All cycles
- 2024: R+17.4 2020: R+14.7 2016: R+20.6 2012: R+11.9 2008: R+0.4
Not yet ingested
- Civics
- —
Market trends
- HPI YoY
- ▼ -28.70%
- Current HPI
- 172.7534
- Rent YoY
- —
- Metro
- —
- State GDP YoY
- —
- F500 in state
- 0
Price history
-33.0% since first listed6 events — show timeline
- 2026-05-15 Price Changed $99,900 KVBOR
- 2026-03-30 Listed $105,000 KVBOR
- 2025-07-21 Listed $134,999 KVBOR
- 2025-05-17 Price Changed $139,000 KVBOR
- 2025-04-14 Price Changed $144,000 KVBOR
- 2025-02-03 Listed $149,000 KVBOR
Cash-flow waterfall
monthlySold comps — $/sqft
last 12 mo · ≤1 miLoading sold comps…