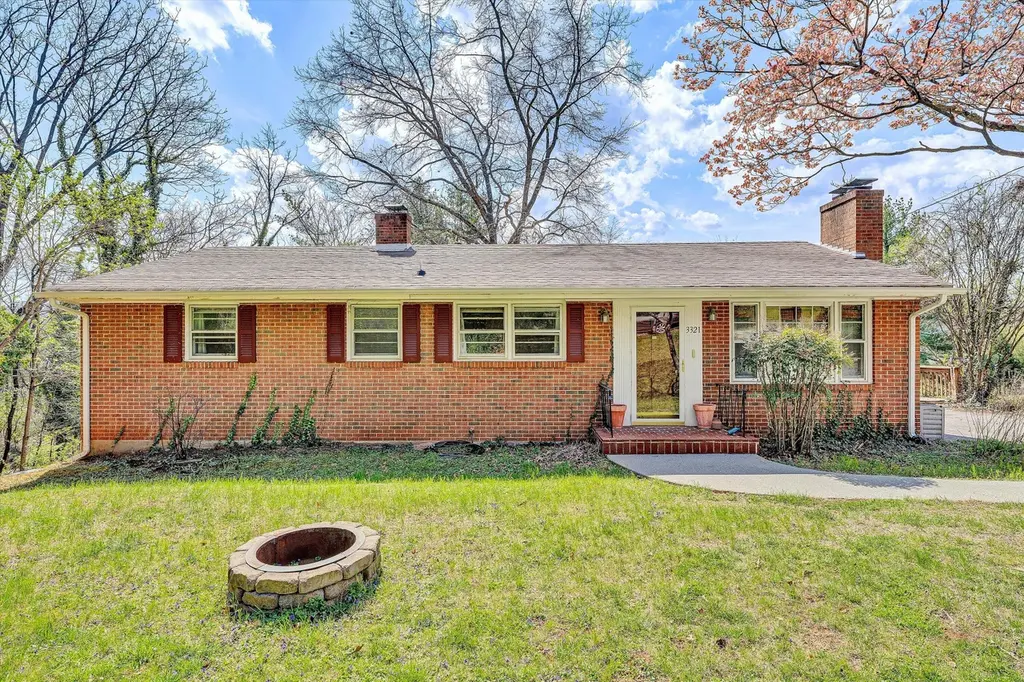
3321 Ledgewood Ave · Cave Spring, VA
Flood risk 1/10 · Minimal
- FEMA flood zone
- X (unshaded)
- Chance of flooding over 30 yrs
- 0.0%
- Est. flood insurance / yr
- $473 – $860
Fire risk 2/10 · Minimal
- Est. fire insurance / yr
- $666 – $1,236
Heat risk 5/10 · Moderate
- Hot days now (above 99°F)
- 7 days/yr
- Hot days in 30 yrs
- 20 days/yr
Wind risk 2/10 · Minimal
- Chance of severe wind over 30 yrs
- 1.0%
Air-quality risk 2/10 · Minimal
- Unhealthy air days now
- 0 days/yr
- Unhealthy air days in 30 yrs
- 1 days/yr
Risk factors via First Street. Map © Google.
Why this score? — see what drove the F grade
The composite is a weighted blend of 9 inputs, each scored 0–100. Each bar is that input's sub-score; the figure is the points it added to the 100-point composite (weight × sub-score).
- ARV discount +10.4/15.0
- Cash flow +6.6/30.0
- Schools +6.4/10.0
- Livability +3.8/5.0
- Rent growth +3.2/5.0
- Condition / age +2.5/5.0
- 1% rule +0.9/10.0
- DSCR +0.9/10.0
- Appreciation +0.0/10.0
$289,950
🖨 Deal sheet 📄 Offer letter ✓ Due diligence
Listing remarks MLS
Cozy 3BR/1.5 BA home offers beautiful mountain views from deck, sun room, and kitchen. Hardwood/ceramic tile floors , mstr bedroom, open living/dining room w/ fireplace and built in shelves. Full basement ready to be finished to double living space, already heated and cooled, high ceilings, fireplace, unbelievable window space. In heavy rains, some water leaks in under basement door.
Key facts
- Deck area
- Paved driveway
- Enclosed sun porch
Tags
Neighborhood map
What this means for you Summary
Snapshot
- This is a 3-bed/1.5-bath single-family listed at $290k.
Deal economics
- At list price, monthly cash flow is $-472 ($-6k/yr) — negative.
- To cash-flow at today's rent, offer at most $207k (28.8% below list).
- To meet the 1% rule (rent ≥ 1% of price), the offer needs to be $171k (41.0% below list).
- Recommended offer: $171k (41.0% below list) — sets the bar for 1% rule.
- Cap rate 4.3% vs local median 3.4% in Cave Spring — meaningfully above typical; check what's discounted (condition, days-on-market, listing class) to confirm the premium yield is real.
Location & tenants
- Location reads 76/100 on livability (#113 in VA, #3,513 nationally) — a middle-class / working-renter tenant base. Strengths: housing A+, health & safety A+, cost of living A-; Watch: amenities F, commute F.
- Roanoke County Public School District (suburban): math 71% / reading 78% proficiency, ranked #9 of 131 in VA (top 7%) — strong family-tenant draw, lease renewals of 3-5y typical.
- Zoned schools: Cave Spring Elementary (math 77% / reading 82%, grade A, #141 of 1,108 statewide, top 14%, 508 students, 24% FRL); Hidden Valley Middle (math 76% / reading 83%, grade A+, #28 of 342 statewide, top 8%, 578 students, 26% FRL); Hidden Valley High (math 90% / reading 92%, grade A+, #5 of 319 statewide, top 1%, 830 students, 24% FRL) — zoned schools at 25% FRL track the district average.
- Market conditions: Rents rising (+2.9%/yr); 333 active listings in the ZIP; 14 comparable units currently listed for rent nearby; rentals leasing fast (median 14d on market — plan ~1-2 weeks tenant-placement turnaround); solid renter incomes; 360 units permitted in Roanoke County in 2024 (228 in 5+ unit buildings).
Forward outlook
- Local home prices are declining (-3.0%/yr); year-one equity from $2k of loan paydown is wiped out by about $9k of value loss. Plan a longer hold.
- Roanoke County population projected at +5% by 2050 — modest demand growth; plan on rents tracking national, not racing it.
Negotiation context
- It's been on market 17 days — a 2% lower offer ($286k) is reasonable based on typical stale-listing flexibility.
- 3 sale attempts since 13y ago with the ask held roughly flat each time — persistent listings suggest the price (not the market) is what's stuck; bring a comps-based counter.
- Current owner paid $205k; 41% above their basis — modest negotiation headroom, anchor on the comps not their cost.
Risks & watch-outs
- Climate carrying-cost: extreme-heat days projected 7→20/yr by 2055 (HVAC capex compounding) — expect insurance premiums to compound above CPI over the hold.
Questions for the listing agent
- What do current leases actually rent for vs. the listed asking? Can we see a recent rent roll and the last 12 months of T-12 income?
- Built in 1960 — when were the roof, HVAC, electrical panel, plumbing, and water heater last replaced?
- Is there a deadline driving the sale (1031 exchange, divorce, estate, relocation)? That informs how much negotiation room exists.
- Schools are A-rated — typically a magnet for longer-tenancy family renters. What's the average tenant stay here, and is there a school-zone premium baked into asking?
- The area grade is low — what's the realistic commute time and amenity access for the typical tenant pool here? Any planned neighborhood developments (good or bad) we should know about?
- What's the average days-on-market for RENTAL listings here right now (not sales)? A rising rental-DOM trend means longer vacancies and softer asking-rent achievability than the comps imply.
- What's the recent tenant-quality profile in this submarket — average credit score on applications, eviction rate, late-payment / NSF rate, and stable-employment percentage? A property-management company in the area should have these aggregated.
- How much new for-sale + rental construction is in the pipeline within 1–3 miles? Heavy new supply typically softens prices + rents 12–24 months out; constrained supply supports both.
Investment metrics
- 1% rule
- 0.59% ✗
- Cap rate
- 4.34%
- Cash-on-cash
- -6.98%
- DSCR
- 0.69
- GRM
- 14.1
CMA / ARV
- ARV (on-the-fly)
- $309,600
- Comps found
- 8
Show comp detail 8 sales within ~0.75 mi
| Address | Dist | Beds/Ba | Sqft | Sold | Price | $/sf | Match |
|---|---|---|---|---|---|---|---|
| 3837 Antietam Dr | 0.45mi | 3/2.0 | 1,250 (+4%) | 8mo | $290,000 | $232 | 64 |
| 3617 View Ave | 0.69mi | 3/2.0 | 1,250 (+4%) | 2mo | $305,000 | $244 | 57 |
| 3106 Winterberry Sq | 0.58mi | 2/2.0 (-1) | 1,226 (+2%) | 7mo | $375,000 | $306 | 56 |
| 3221 Winterberry Dr | 0.65mi | 3/2.0 | 1,278 (+6%) | 9mo | $315,000 | $246 | 49 |
| 3109 Winterberry Sq | 0.60mi | 2/2.0 (-1) | 1,106 (-8%) | 11mo | $323,250 | $292 | 43 |
| 4322 Garstview Cir | 0.60mi | 2/2.0 (-1) | 1,358 (+13%) | 6mo | $350,000 | $258 | 38 |
| 3102 Winterberry Sq | 0.58mi | 2/2.0 (-1) | 1,106 (-8%) | 19mo | $301,000 | $272 | 37 |
| 4346 Garstview Cir | 0.62mi | 2/2.0 (-1) | 1,358 (+13%) | 24mo | $329,950 | $243 | 22 |
Match score weights: distance 35% · size 25% · config 20% · recency 20%. Top-matched comps best support the ARV.
Projected returns pro-forma
-3.0% appreciation · 2.88% rent growth · sell at horizon
- IRR
- -28.6%
- Equity multiple
- 0.05×
- Total profit
- $-77,335
- Equity at exit
- $43,232
- IRR
- -28.7%
- Equity multiple
- -0.32×
- Total profit
- $-107,239
- Equity at exit
- $25,070
Cash invested: $81,186 (down + closing). Projections, not guarantees.
Landlord ↔ Tenant lean methodology
- Overall (STATE)
- 55 Moderately Landlord-Leaning
- State Virginia
- 55 Moderately Landlord-Leaning · D+2
- County
- — inherits STATE
- City
- — inherits STATE
ZIP-level market 24018
- Rents YoY
- 2.9%
- Active inventory
- 333
- Price-to-rent
- 14.1×
Monthly cashflow live
- Estimated rent
- $1,711 high interval (Pro) →
- Mortgage (P&I)
- −$1,521
- Tax from tax record
- −$182 /mo · $2,186/yr
- Insurance
- −$121
- HOA
- −$0
- Vacancy / Maint / Mgmt
- −$359
- Net cashflow
- $-472
Break-even live
UW: 25.0% down · 7.5% · 30yr · 1.5% tax · 5.0% vac · 8.0% maint · 8.0% mgmt
Financing live
Cash to close
- Down payment
- $72,488
- Closing costs
- $8,698
- Reserves months
- —
- Total cash needed
- —
Loan-product check · same deal, 3 products live
Conventional
25% down · 7.5% · 30yr
- Down + closing
- —
- Monthly P&I
- —
- Monthly cashflow
- —
- DSCR
- —
- Eligible?
- —
Personal DTI + credit; lowest rate.
DSCR
20% down · 8.5% · 30yr
- Down + closing
- —
- Monthly P&I
- —
- Monthly cashflow
- —
- DSCR
- —
- Eligible?
- —
No personal income docs; deal must DSCR.
Hard money
10% down · 12.0% · 12mo
- Down + closing
- —
- Monthly P&I
- —
- Monthly cashflow
- —
- DSCR
- —
- Eligible?
- —
Short-term bridge; refi at stabilization.
Rent comps 14 comps
| Address | Beds | Baths | Sqft | Rent | $/sqft | DOM | Units | Dist |
|---|---|---|---|---|---|---|---|---|
| 3501 Normandy Ln Roanoke, VA | 2.0 | 1.0 | 925 | $1,250 | $1.35 | 13d | 1 | 0.24mi |
| 3709 Antietam Dr Roanoke, VA | 2.0 | 1.0 | 1016 | $1,899 | $1.87 | 13d | 1 | 0.51mi |
| 4356 Old Garst Ml Rd Cave Spring, VA | 1.0–2.0 | 1.0–1.5 | 889 | $1,341 | $1.51 | 13d | 14 | 0.61mi |
| 3620 Manassas Dr Roanoke, VA | 3.0 | 1.5 | 1200 | $2,300 | $1.92 | 43d | 1 | 0.63mi |
| 3363 View Ave Roanoke, VA | 3.0 | 1.0 | 1014 | $1,895 | $1.87 | 21d | 1 | 0.92mi |
| 3420 Chaparral Dr Roanoke, VA | 1.0–2.0 | 1.0–2.0 | 895 | $1,549 | $1.73 | 13d | 5 | 1.13mi |
| 3215 Chaparral Dr Unit H Cave Spring, VA | 2.0 | 2.0 | 750 | $1,023 | $1.36 | 43d | 1 | 1.17mi |
| 3464 Colonial Ave Roanoke, VA | 2.0 | 1.0 | 1100 | $1,495 | $1.36 | 13d | 5 | 1.25mi |
| 4630 Roxbury Ln Cave Spring, VA | 1.0–2.0 | 1.0–1.5 | 930 | $1,625 | $1.75 | 13d | 7 | 1.26mi |
| 3273 Forest Ridge Rd Roanoke, VA | 2.0 | 2.0 | 1252 | $1,850 | $1.48 | 21d | 1 | 1.27mi |
| 3366 Forest Ct Roanoke, VA | 2.0 | 2.0 | 1027 | $1,650 | $1.61 | 21d | 1 | 1.31mi |
| 3368 Forest Ct Roanoke, VA | 2.0 | 2.0 | 1027 | $2,350 | $2.29 | 13d | 1 | 1.31mi |
| 2119 Electric Rd Roanoke, VA | 2.0 | 1.5 | 1000 | $1,245 | $1.25 | 13d | 1 | 1.47mi |
| 2119 N Electric Rd Unit 24 Cave Spring, VA | 2.0 | 1.5 | 1000 | $1,245 | $1.25 | 43d | 1 | 1.48mi |
Listing history 9 events
-
2026-04-13status Pending
-
2026-03-27$289,950 Active
-
2021-07-01soldstatus $205,435
-
2021-06-30soldstatus $206,435
-
2021-05-27$198,500
-
2013-08-15soldstatus $145,000 386-char remark
Show marketing remark (386 chars)
Cozy 3BR/1.5 BA home offers beautiful mountain views from deck, sun room, and kitchen. Hardwood/ceramic tile floors , mstr bedroom, open living/dining room w/ fireplace and built in shelves. Full basement ready to be finished to double living space, already heated and cooled, high ceilings, fireplace, unbelievable window space. In heavy rains, some water leaks in under basement door.
-
2013-06-17$145,000 386-char remark
Show marketing remark (386 chars)
Cozy 3BR/1.5 BA home offers beautiful mountain views from deck, sun room, and kitchen. Hardwood/ceramic tile floors , mstr bedroom, open living/dining room w/ fireplace and built in shelves. Full basement ready to be finished to double living space, already heated and cooled, high ceilings, fireplace, unbelievable window space. In heavy rains, some water leaks in under basement door.
-
1997-03-01soldstatus $105,000
-
1996-05-01soldstatus $73,300
ⓘ Source: listings_history table (triggers on properties + properties_extension) + one-shot
backfill from property_details.listing_events for pre-trigger history.
Tax reassessment forecast VA · Resets to sale price
- Current annual tax
- $2,186 · $182/mo
- Projected year-2 tax
- $2,378 · $198/mo
- Expected delta
- +$192/yr (+$16/mo · 8.8%)
ⓘ Screening estimate from a state-policy table — verify with the county assessor before closing.
Climate risk First Street
- Flood 1/10 Low FEMA zone X (unshaded) · 0% chance over 30 yrs
- Wildfire 2/10 Low
- Heat 5/10 Major 7 d/yr ≥99°F today · 20 d/yr by 30 yrs out
- Wind 2/10 Low 100% chance of damaging wind over 30 yrs
- Air quality 2/10 Low 0 unhealthy d/yr today · 1 by 30 yrs out
Nearby sold comps map
Loading sold comps map…
Walkable amenities ~0.75 mi
Loading nearby amenities…
Taxation est. · year 1
- Rental income
- $20,529
- − Mortgage interest
- −$16,242
- − Property taxes
- −$2,186
- − Insurance
- −$1,450
- − Repairs & maintenance
- −$1,642
- − Management
- −$1,642
- − Depreciation
- −$8,435
- Taxable loss
- −$11,067
- Est. tax savings @ 24.0%
- +$2,656
- After-tax cash flow
- $-3,007/yr
For passive investors: Depreciation is non-cash, so a rental often shows a tax loss while cash-flowing — sheltering income. Rental losses are passive: they offset passive income freely, and up to $25,000/yr can offset ordinary (W-2) income if you actively participate and your MAGI is under $100k (phasing out to $0 by $150k); unused losses carry forward. On sale, claimed depreciation is recaptured at up to 25%, and gains may owe capital-gains tax (a 1031 exchange can defer both). Figures are a year-1 estimate at your 24.0% rate — not tax advice; consult a CPA.
Schools (NCES district)
- District
- Roanoke County Public School District
- NCES district ID
- 5103330
- Math proficiency
- 71% ▼ -19.00%
- Reading proficiency
- 78% ▼ -6.00%
- Median HH income
- $60,526
- Composite
- 64.08/100
- National rank
- #578
- State rank
- #9 of 131 in VA
Livability — Cave Spring
- Score
- 76/100
- State rank
- #113
- US rank
- #3513
Category grades
Schools grade is shown separately in the Schools card above.
Census & demographics
- Census place
- Cave Spring, VA
- County
- Roanoke County · 67,305 people
- Metro
- Roanoke, VA
- Population (ZIP)
- 38,720
- Household income
- $90,885
- Rent vs Own
- Severe rent burden
- 495.0
Population outlook (Roanoke County) Hauer SSP2
- Today (2025)
- 98,162 people
- By 2030
- 99,793 · +1.7%
- By 2040
- 101,965 · +3.9%
- By 2050
- 103,328 · +5.3%
- By 2075
- 108,641 · +10.7%
- By 2100
- 104,845 · +6.8%
Race, ethnicity, and origin ACS 2023
- Neighborhood character
- Predominantly White (83%)
- Race & ethnicity
- White 83% Asian 6% Hispanic / Latino 4% Two or more races 4% Black 4%
- Common ancestry
- Italian 4% Slovak 3% Serbian 3%
- Foreign-born
- 10% · Canada, China, Vietnam
- Languages at home
- 86% English-only · Spanish 5% Other Indo-European 3% Other Asian/Pacific 1%
Political lean MEDSL · Roanoke
- 2024 margin
- Strong R (+22.5) · D 38.2% · R 60.7% · Other 1.1%
- 2008→2024 swing
- -1.4pp toward R · 2008: -21.1pp · 2024: -22.5pp
- All cycles
- 2024: R+22.5 2020: R+21.8 2016: R+28.1 2012: R+25.6 2008: R+21.1
Not yet ingested
- Civics
- —
Market trends
- HPI YoY
- ▼ -266.18%
- Current HPI
- 176.0558
- Rent YoY
- ▲ 2.88%
- Metro
- Roanoke, VA
- State GDP YoY
- ▲ 2.40%
- F500 in state
- 50
Industry mix (Fortune 500 HQ in VA)
| Industry | F500 HQs | Revenue |
|---|---|---|
| Aerospace / Defense | 4 | $236B |
|
||
| Technology / Defense | 3 | $32B |
|
||
| Financial Services | 2 | $176B |
|
||
| Utilities | 2 | $27B |
|
||
| Insurance | 2 | $25B |
|
||
| Technology | 2 | $15B |
|
||
Price history
+295.6% since first listed9 events — show timeline
- 2026-04-13 Pending — MLSRV
- 2026-03-27 Listed $289,950 MLSRV
- 2021-07-01 Sold (Public Records) $205,435 Public Records
- 2021-06-30 Sold (MLS) $206,435 MLSRV
- 2021-05-27 Listed $198,500 MLSRV
- 2013-08-15 Sold (MLS) $145,000 MLSRV
- 2013-06-17 Listed $145,000 MLSRV
- 1997-03-01 Sold (Public Records) $105,000 Public Records
- 1996-05-01 Sold (Public Records) $73,300 Public Records
Property tax history
+3.8%/yrLatest (2025): $2,186 · +9.5% YoY. Source: county tax records.
Cash-flow waterfall
monthlySold comps — $/sqft
last 12 mo · ≤1 miLoading sold comps…