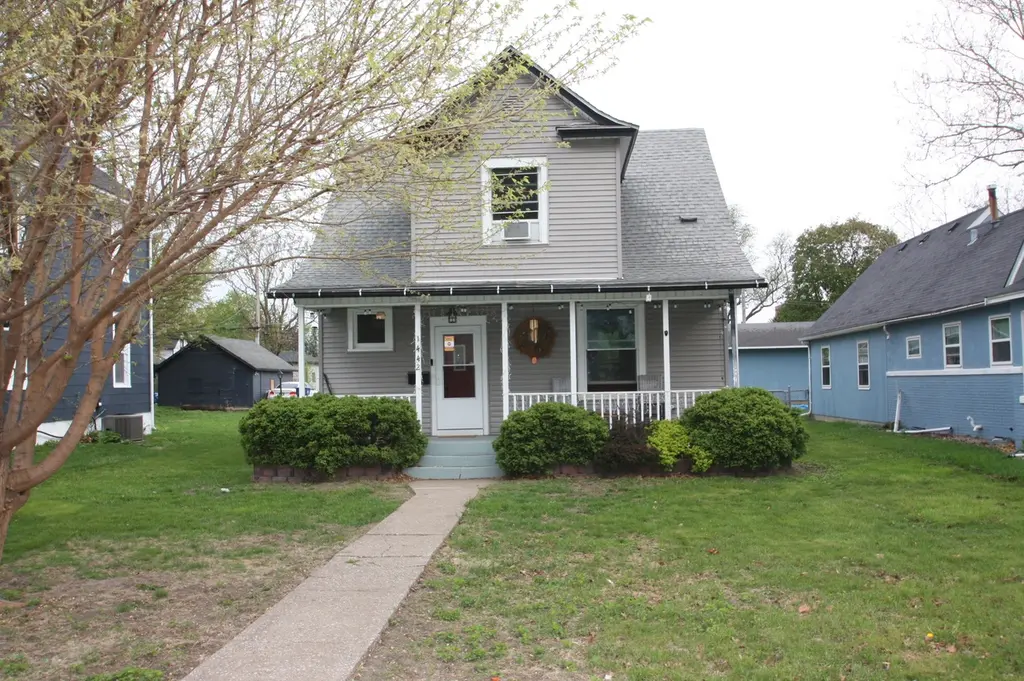
1442 W High St · Davenport, IA
Flood risk 6/10 · Moderate
- FEMA flood zone
- X (unshaded)
- Chance of flooding over 30 yrs
- 0.67%
- Est. flood insurance / yr
- $473 – $860
Fire risk 1/10 · Minimal
- Est. fire insurance / yr
- $902 – $1,676
Heat risk 3/10 · Minor
- Hot days now (above 103°F)
- 7 days/yr
- Hot days in 30 yrs
- 16 days/yr
Wind risk 2/10 · Minimal
- Chance of severe wind over 30 yrs
- —
Air-quality risk 3/10 · Minor
- Unhealthy air days now
- 2 days/yr
- Unhealthy air days in 30 yrs
- 3 days/yr
Risk factors via First Street. Map © Google.
Why this score? — see what drove the C- grade
The composite is a weighted blend of 9 inputs, each scored 0–100. Each bar is that input's sub-score; the figure is the points it added to the 100-point composite (weight × sub-score).
- ARV discount +14.5/15.0
- Cash flow +14.2/30.0
- 1% rule +4.3/10.0
- DSCR +4.3/10.0
- Livability +4.0/5.0
- Schools +3.9/10.0
- Rent growth +3.5/5.0
- Condition / age +2.5/5.0
- Appreciation +0.0/10.0
$130,000
🖨 Deal sheet (PDF) 📄 Offer letter ✓ Due diligence
Listing remarks
2 bedroom 2 bath. Fenced in backyard. 1 car garage with car port. Newly remodeled upper bathroom. Seller is Licensed Real Estate Agent
Key facts
- Fenced in backyard
- 8,712 sq ft lot
- Garage
Tags
Property features AI
Finance
- Other: School bus service available
- HOA & community: No master association fee required
Exterior
- Parking: Detached garage (concrete) — 1 garage space, 1 total parking space; Garage is owned
- Utilities: Public water; Public sewer
- Home design: Detached single-family home; 2-story; Fee simple ownership; Property is currently leased; Approximately 100+ years old
- Construction: Vinyl siding; Asphalt roof; Stone foundation; Total finished area approx. 1,263 (main ~742, upper ~521); total finished/unfinshed area listed as 2,005; Unfinished basement approx. 742
- Exterior features: Patio; Porch; Fenced yard
Interior
- Kitchen: Range; Refrigerator; Ceramic tile flooring in kitchen (approx. 12 x 13)
- Bedrooms: Master bedroom on second level (approx. 11 x 12) with carpet; Second bedroom on second level (approx. 11 x 12) with carpet
- Flooring: Carpet in living areas and bedrooms; Laminate in dining room; Ceramic tile in kitchen
- Bathrooms: 2 full bathrooms
- Heating & cooling: Natural gas, forced air heating; Central air conditioning
- Interior features: Built-in bookcases; 5 total rooms; Full, unfinished basement
- Laundry & utility: Laundry room in basement (approx. 10 x 10)
Neighborhood map
What this means for you Summary
Snapshot
- This is a 3-bed/2.0-bath single-family listed at $130k.
Deal economics
- At list price, monthly cash flow is $20 ($244/yr) — positive.
- The deal already cash-flows at list — no discount required.
- To meet the 1% rule (rent ≥ 1% of price), the offer needs to be $121k (7.3% below list).
- Recommended offer: $121k (7.3% below list) — sets the bar for 1% rule.
- Cap rate 6.5% vs local median 4.4% in Davenport — top-decile yield for the area; either an underpriced asset or a hidden risk that comps aren't pricing in. Stress-test before assuming the spread holds.
Location & tenants
- Location reads 79/100 on livability (#126 in IA, #2,312 nationally) — a middle-class / working-renter tenant base. Strengths: cost of living A+, housing A+, health & safety A+; Watch: employment C-, crime F.
- Davenport Community School District (urban): math 43% / reading 50% proficiency, ranked #288 of 289 in IA (top 100%) — families likely to look elsewhere, expect single-tenant / working-renter base with shorter leases.
- Zoned schools: Adams Elementary School (math 48% / reading 51%, grade D, #514 of 616 statewide, top 85%, 511 students, 54% FRL); Williams Intermediate (math 33% / reading 37%, grade F, #243 of 246 statewide, top 99%, 423 students, 63% FRL); North High School (math 45% / reading 59%, grade D+, #299 of 336 statewide, top 91%, 1,352 students, 50% FRL) — zoned schools at 56% FRL track the district average.
- Market conditions: Rents rising (+4.0%/yr); 162 active listings in the ZIP; 33 comparable units currently listed for rent nearby; rentals at typical pace (median 23d on market — plan ~3-4 weeks tenant-placement turnaround); 48% of comp listings sitting > 30 days — soft ceiling on asking rent; 805 units permitted in Scott County in 2024 (479 in 5+ unit buildings).
Forward outlook
- Local home prices are declining (-3.0%/yr); year-one equity from $899 of loan paydown is wiped out by about $4k of value loss. Plan a longer hold.
- Scott County population projected at +19% by 2050 — long-run rental-demand tailwind backs the buy-and-hold thesis.
Negotiation context
- Only 8 days on market — expect competitive offers; lowballing is unlikely to land.
- 5 sale attempts since 21y ago; this cycle's ask has dropped $10k (7%) from the opening price — seller is motivated, your offer sets the floor, not the list.
Risks & watch-outs
- Watch-outs: built in 1910 — expect roof / HVAC / electrical / plumbing capex.
- Climate carrying-cost: major flood risk — expect insurance premiums to compound above CPI over the hold.
Questions for the listing agent
- Built in 1910 — when were the roof, HVAC, electrical panel, plumbing, and water heater last replaced?
- Is there a deadline driving the sale (1031 exchange, divorce, estate, relocation)? That informs how much negotiation room exists.
- Crime grade is F in this area — have there been break-ins, vandalism, or insurance claims at this property in the last 3 years? What carrier currently insures it and at what premium?
- What's the average days-on-market for RENTAL listings here right now (not sales)? A rising rental-DOM trend means longer vacancies and softer asking-rent achievability than the comps imply.
- What's the recent tenant-quality profile in this submarket — average credit score on applications, eviction rate, late-payment / NSF rate, and stable-employment percentage? A property-management company in the area should have these aggregated.
- How much new for-sale + rental construction is in the pipeline within 1–3 miles? Heavy new supply typically softens prices + rents 12–24 months out; constrained supply supports both.
Investment metrics
- 1% rule
- 0.93% ✗
- Cap rate
- 6.48%
- Cash-on-cash
- 0.67%
- DSCR
- 1.03
- GRM
- 9.0
CMA / ARV
- ARV (median comp)
- $154,059
- List price
- $130,000
- Delta
- -15.62%
- Verdict
- UNDERPRICED
- Comps
- 20 within 1.0 mi
Show comp detail 12 sales within ~0.75 mi
| Address | Dist | Beds/Ba | Sqft | Sold | Price | $/sf | Match |
|---|---|---|---|---|---|---|---|
| 1442 W High St | 0.00mi | 2/2.0 (-1) | 1,263 (0%) | 1mo | $130,000 | $103 | 94 |
| 2030 N Sturdevant St | 0.18mi | 2/1.5 (-1) | 1,326 (+5%) | 1mo | $40,000 | $30 | 75 |
| 2323 Frances Pl | 0.44mi | 3/2.0 | 1,293 (+2%) | 1mo | $240,000 | $186 | 75 |
| 1341 W 14th St | 0.52mi | 3/1.5 | 1,244 (-2%) | 1mo | $131,900 | $106 | 70 |
| 1649 Florence Ln Ln | 0.29mi | 3/2.0 | 1,150 (-9%) | 2mo | $120,000 | $104 | 70 |
| 1324 Marquette St | 0.55mi | 3/2.0 | 1,302 (+3%) | 1mo | $115,000 | $88 | 68 |
| 1525 W High St St | 0.11mi | 2/1.5 (-1) | 1,096 (-13%) | 2mo | $148,000 | $135 | 65 |
| 1024 Berg Pl | 0.41mi | 3/1.5 | 1,136 (-10%) | 1mo | $192,000 | $169 | 61 |
| 2102 W 18th St | 0.67mi | 3/1.0 | 1,236 (-2%) | 2mo | $155,000 | $125 | 60 |
| 1629 W Columbia Ave | 0.43mi | 3/2.5 | 1,400 (+11%) | 0mo | $243,900 | $174 | 60 |
| 911 W 16th St | 0.58mi | 3/1.0 | 1,356 (+7%) | 2mo | $152,000 | $112 | 55 |
| 734 W 17th St | 0.62mi | 3/1.0 | 1,389 (+10%) | 2mo | $138,000 | $99 | 49 |
Match score weights: distance 35% · size 25% · config 20% · recency 20%. Top-matched comps best support the ARV.
Projected returns pro-forma
-3.0% appreciation · 3.99% rent growth · sell at horizon
- IRR
- -14.0%
- Equity multiple
- 0.49×
- Total profit
- $-18,516
- Equity at exit
- $19,383
- IRR
- -3.6%
- Equity multiple
- 0.75×
- Total profit
- $-9,217
- Equity at exit
- $11,240
Cash invested: $36,400 (down + closing). Projections, not guarantees.
Landlord ↔ Tenant lean methodology
- Overall (STATE)
- 83 Strongly Landlord-Friendly
- State Iowa
- 83 Strongly Landlord-Friendly · R+6
- County
- — inherits STATE
- City
- — inherits STATE
ZIP-level market 52804
- Home prices YoY
- -25.3%
- Rents YoY
- 4.0%
- Active inventory
- 162
- Price-to-rent
- 9.0×
Monthly cashflow live
- Estimated rent
- $1,206 high interval (Pro) →
- Mortgage (P&I)
- −$682
- Tax from tax record
- −$196 /mo · $2,354/yr
- Insurance
- −$54
- HOA
- −$0
- Vacancy / Maint / Mgmt
- −$253
- Net cashflow
- $20
Break-even live
Sensitivity live
| Price | -10% $94 | -5% $57 | +0% $20 | +5% $-16 | +10% $-53 |
|---|---|---|---|---|---|
| Rent | -10% $-75 | -5% $-27 | +0% $20 | +5% $68 | +10% $116 |
| Rate | -1.0pp $86 | -0.5pp $53 | base $20 | +0.5pp $-13 | +1.0pp $-48 |
UW: 25.0% down · 7.5% · 30yr · 1.5% tax · 5.0% vac · 8.0% maint · 8.0% mgmt
Financing live
Cash to close
- Down payment
- $32,500
- Closing costs
- $3,900
- Reserves months
- —
- Total cash needed
- —
Loan-product check · same deal, 3 products live
Conventional
25% down · 7.5% · 30yr
- Down + closing
- —
- Monthly P&I
- —
- Monthly cashflow
- —
- DSCR
- —
- Eligible?
- —
Personal DTI + credit; lowest rate.
DSCR
20% down · 8.5% · 30yr
- Down + closing
- —
- Monthly P&I
- —
- Monthly cashflow
- —
- DSCR
- —
- Eligible?
- —
No personal income docs; deal must DSCR.
Hard money
10% down · 12.0% · 12mo
- Down + closing
- —
- Monthly P&I
- —
- Monthly cashflow
- —
- DSCR
- —
- Eligible?
- —
Short-term bridge; refi at stabilization.
Rent comps 33 comps
| Address | Beds | Baths | Sqft | Rent | $/sqft | DOM | Units | Dist |
|---|---|---|---|---|---|---|---|---|
| 1723 W Locust St Davenport, IA | 3.0 | 1.0 | 1690 | $1,395 | $0.83 | 45d | 1 | 0.43mi |
| 1455 W 12th St Davenport, IA | 3.0 | 1.0 | 942 | $1,095 | $1.16 | 15d | 1 | 0.66mi |
| 915 W 14th St Davenport, IA | 3.0 | 1.0 | 1390 | $900 | $0.65 | 45d | 1 | 0.66mi |
| 901 W 15th St Davenport, IA | 1.0–2.0 | 1.0–2.0 | 950 | $895 | $0.94 | 15d | 1 | 0.72mi |
| 1318 1/2 Brown St Davenport, IA | 2.0 | 1.0 | 900 | $875 | $0.97 | 22d | 1 | 0.74mi |
| 1607 W 12th St Davenport, IA | 1.0–2.0 | 1.0 | 800 | $740 | $0.93 | 45d | 3 | 0.76mi |
| 1315 Brown St Unit 2 Davenport, IA | 3.0 | 1.0 | 1300 | $1,250 | $0.96 | 22d | 1 | 0.76mi |
| 621 W 15th St Davenport, IA | 4.0 | 2.0 | 1833 | $1,500 | $0.82 | 15d | 1 | 0.78mi |
| 537 W 16th St Davenport, IA | 3.0 | 1.0 | 1311 | $1,400 | $1.07 | 45d | 1 | 0.79mi |
| 1323 N Gaines St Davenport, IA | 4.0 | 2.0 | 1733 | $1,350 | $0.78 | 22d | 1 | 0.82mi |
| 1615 1/2 N Ripley St Davenport, IA | 2.0 | 1.0 | 900 | $825 | $0.92 | 45d | 1 | 0.92mi |
| 1519 N Ripley St Davenport, IA | 2.0 | 1.0 | 1144 | $1,100 | $0.96 | 15d | 1 | 0.94mi |
| 1511 N Ripley St Davenport, IA | 4.0 | 2.0 | 1872 | $1,450 | $0.77 | 22d | 1 | 0.95mi |
| 1716 W 7th St Davenport, IA | 4.0 | 1.0 | 1278 | $1,712 | $1.34 | 15d | 1 | 1.01mi |
| 730 Brown St Unit 3 Davenport, IA | 2.0 | 1.0 | 1000 | $800 | $0.80 | 45d | 1 | 1.06mi |
| 1421 N Main St #2 Davenport, IA | 3.0 | 1.0 | 1350 | $1,095 | $0.81 | 45d | 1 | 1.12mi |
| 2809 N Main St Davenport, IA | 3.0 | 1.5 | 1000 | $1,350 | $1.35 | 22d | 1 | 1.15mi |
| 201 E Locust St Unit Sw Davenport, IA | 2.0 | 1.0 | 1000 | $875 | $0.88 | 45d | 1 | 1.19mi |
| 1341 W 4th St Davenport, IA | 3.0 | 1.5 | 979 | $1,394 | $1.42 | 45d | 1 | 1.23mi |
| 1812 Pershing Ave Unit 1 Davenport, IA | 3.0 | 1.0 | 1000 | $1,200 | $1.20 | 22d | 1 | 1.24mi |
| 119 E 13th St Davenport, IA | 3.0 | 1.0 | 1728 | $1,495 | $0.87 | 45d | 1 | 1.26mi |
| 2224 Iowa St Unit 2224 Davenport, IA | 2.0 | 1.0 | 1214 | $925 | $0.76 | 45d | 1 | 1.28mi |
| 2224 Iowa St Davenport, IA | 2.0 | 1.0 | 1214 | $895 | $0.74 | 45d | 1 | 1.28mi |
| 317 Kirkwood Blvd Davenport, IA | 2.0 | 1.0 | 1300 | $950 | $0.73 | 45d | 1 | 1.32mi |
| 2925 Dubuque St Unit 5N Davenport, IA | 2.0 | 2.0 | 895 | $825 | $0.92 | 15d | 1 | 1.36mi |
| 2638 N Clark St Unit 2 Davenport, IA | 3.0 | 1.5 | 1200 | $1,250 | $1.04 | 15d | 1 | 1.40mi |
| 320 E 29th St Davenport, IA | 2.0 | 2.5 | 1450 | $1,750 | $1.21 | 45d | 1 | 1.44mi |
| 2209 Farnam St Unit 2211 Davenport, IA | 3.0 | 1.0 | 1138 | $1,050 | $0.92 | 22d | 1 | 1.46mi |
| 102 W 35th St Unit 128E_35R Davenport, IA | 2.0 | 2.0 | 1200 | $1,100 | $0.92 | 22d | 1 | 1.47mi |
| 102 W 35th St Unit 104E_35R Davenport, IA | 2.0 | 2.0 | 1200 | $1,050 | $0.88 | 22d | 1 | 1.47mi |
| 102 W 35th St Unit 119W_35R Davenport, IA | 2.0 | 2.0 | 1200 | $1,050 | $0.88 | 45d | 1 | 1.47mi |
| 102 W 35th St Unit 130E_35R Davenport, IA | 2.0 | 2.0 | 1200 | $1,100 | $0.92 | 15d | 1 | 1.47mi |
| 102 W 35th St Unit 105W_35 Davenport, IA | 3.0 | 2.0 | 1500 | $1,150 | $0.77 | 45d | 1 | 1.47mi |
Listing history 18 events
-
2026-05-08status Pending 136-char remark
-
2026-05-05price $130,000 136-char remark
-
2026-04-30$140,000 Active 136-char remark
-
2022-03-16historical
-
2021-08-06historical
-
2020-11-20soldstatus $110,000
-
2020-11-13soldstatus $110,000
-
2020-10-13$115,000
-
2014-09-09soldstatus $101,000
-
2014-09-05soldstatus $101,000
-
2014-09-05soldstatus $101,000
-
2014-03-17$102,000
-
2014-03-17$102,000
-
2010-01-27soldstatus $92,500
-
2007-03-09soldstatus $80,000
-
2006-02-06soldstatus $82,500
-
2006-01-31soldstatus $82,500
-
2005-12-03$79,900
ⓘ Source: listings_history table (triggers on properties + properties_extension) + one-shot
backfill from property_details.listing_events for pre-trigger history.
Tax reassessment forecast IA · Partial reset (capped growth)
- Current annual tax
- $2,354 · $196/mo
- Projected year-2 tax
- $2,354 · $196/mo
- Expected delta
- $0/yr ($0/mo · 0.0%)
ⓘ Screening estimate from a state-policy table — verify with the county assessor before closing.
Climate risk First Street
- Flood 6/10 Major FEMA zone X (unshaded) · 67% chance over 30 yrs
- Wildfire 1/10 Low
- Heat 3/10 Moderate 7 d/yr ≥103°F today · 16 d/yr by 30 yrs out
- Wind 2/10 Low
- Air quality 3/10 Moderate 2 unhealthy d/yr today · 3 by 30 yrs out
Nearby sold comps map
Loading sold comps map…
Walkable amenities ~0.75 mi
Loading nearby amenities…
Taxation est. · year 1
- Rental income
- $14,467
- − Mortgage interest
- −$7,282
- − Property taxes
- −$2,354
- − Insurance
- −$650
- − Repairs & maintenance
- −$1,157
- − Management
- −$1,157
- − Depreciation
- −$3,782
- Taxable loss
- −$1,915
- Est. tax savings @ 24.0%
- +$460
- After-tax cash flow
- $704/yr
For passive investors: Depreciation is non-cash, so a rental often shows a tax loss while cash-flowing — sheltering income. Rental losses are passive: they offset passive income freely, and up to $25,000/yr can offset ordinary (W-2) income if you actively participate and your MAGI is under $100k (phasing out to $0 by $150k); unused losses carry forward. On sale, claimed depreciation is recaptured at up to 25%, and gains may owe capital-gains tax (a 1031 exchange can defer both). Figures are a year-1 estimate at your 24.0% rate — not tax advice; consult a CPA.
Schools (NCES district)
- District
- Davenport Community School District
- NCES district ID
- 1908580
- Math proficiency
- 43% ▼ -11.00%
- Reading proficiency
- 50% ▼ -3.00%
- Median HH income
- $46,157
- Composite
- 39.49/100
- National rank
- #3951
- State rank
- #288 of 289 in IA
Livability — Davenport
- Score
- 79/100
- State rank
- #126
- US rank
- #2312
Category grades
Schools grade is shown separately in the Schools card above.
Census & demographics
- Census place
- Davenport, IA
- County
- Scott County · 144,583 people
- City population
- 103,319
- Metro
- Davenport-Moline-Rock Island, IA-IL
- Population (ZIP)
- 26,835
- Household income
- $65,849
- Rent vs Own
- Severe rent burden
- 830.0
Population outlook (Scott County) Hauer SSP2
- Today (2025)
- 188,878 people
- By 2030
- 196,648 · +4.1%
- By 2040
- 210,860 · +11.6%
- By 2050
- 224,359 · +18.8%
- By 2075
- 258,884 · +37.1%
- By 2100
- 286,447 · +51.7%
Race, ethnicity, and origin ACS 2023
- Neighborhood character
- Predominantly White (71%)
- Race & ethnicity
- White 71% Black 10% Hispanic / Latino 10% Two or more races 9% Asian 2%
- Hispanic origin (detail)
- Mexican 8%
- Common ancestry
- Iranian 2% Romanian 2% Portuguese 1%
- Foreign-born
- 4% · Canada, China, Vietnam
- Languages at home
- 94% English-only · Spanish 3% Russian/Polish/Slavic 1% Chinese 1%
Political lean MEDSL · Scott
- 2024 margin
- Toss-up / Even · D 47.3% · R 51.2% · Other 1.4%
- 2008→2024 swing
- -18.4pp toward R · 2008: 14.6pp · 2024: -3.9pp
- All cycles
- 2024: R+3.9 2020: D+3.5 2016: D+1.4 2012: D+13.8 2008: D+14.6
Not yet ingested
- Civics
- —
Market trends
- HPI YoY
- ▼ -66.50%
- Current HPI
- 196.2267
- Rent YoY
- ▲ 3.99%
- Metro
- Davenport-Moline-Rock Island, IA-IL
- State GDP YoY
- ▲ 2.48%
- F500 in state
- 4
Industry mix (Fortune 500 HQ in IA)
| Industry | F500 HQs | Revenue |
|---|---|---|
| Financial Services | 1 | $16B |
|
||
| Retail / Convenience | 1 | $15B |
|
||
Price history
+62.7% since first listed19 events — show timeline
- 2026-06-05 Sold (MLS) $130,000 MRED as Distributed by MLS Grid
- 2026-05-08 Pending — MRED as Distributed by MLS Grid
- 2026-05-05 Price Changed $130,000 MRED as Distributed by MLS Grid
- 2026-04-30 Listed $140,000 MRED as Distributed by MLS Grid
- 2022-03-16 Listing Removed — RMLSA as Distributed by MLS Grid
- 2021-08-06 Listing Removed — RMLSA as Distributed by MLS Grid
- 2020-11-20 Sold (Public Records) $110,000 Public Records
- 2020-11-13 Sold (MLS) $110,000 RMLSA as Distributed by MLS Grid
- 2020-10-13 Listed $115,000 RMLSA as Distributed by MLS Grid
- 2014-09-09 Sold (Public Records) $101,000 Public Records
- 2014-09-05 Sold (MLS) $101,000 MRED as Distributed by MLS Grid
- 2014-09-05 Sold (MLS) $101,000 RMLSA as Distributed by MLS Grid
- 2014-03-17 Listed $102,000 MRED as Distributed by MLS Grid
- 2014-03-17 Listed $102,000 RMLSA as Distributed by MLS Grid
- 2010-01-27 Sold (Public Records) $92,500 Public Records
- 2007-03-09 Sold (Public Records) $80,000 Public Records
- 2006-02-06 Sold (Public Records) $82,500 Public Records
- 2006-01-31 Sold (MLS) $82,500 RMLSA as Distributed by MLS Grid
- 2005-12-03 Listed $79,900 RMLSA as Distributed by MLS Grid
Property tax history
+2.8%/yrLatest (2025): $2,354 · +2.5% YoY. Source: county tax records.
Cash-flow waterfall
monthlySold comps — $/sqft
last 12 mo · ≤1 miLoading sold comps…