 Multi-family
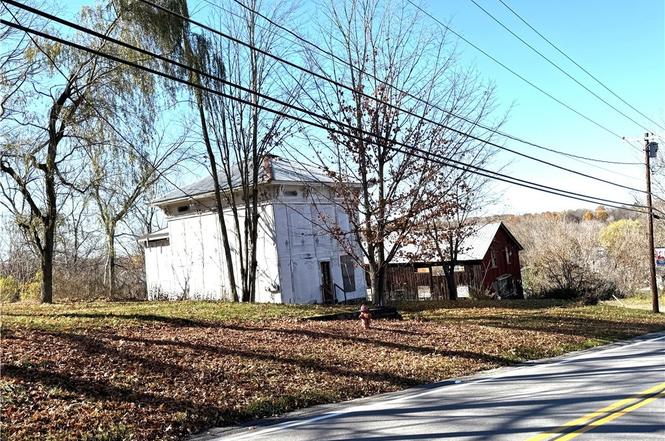
311 Main St · Theresa, NY
Flood risk 1/10 · Minimal
- FEMA flood zone
- X
- Chance of flooding over 30 yrs
- 0.0%
- Est. flood insurance / yr
- $473 – $860
Fire risk 3/10 · Minor
- Est. fire insurance / yr
- $691 – $1,283
Heat risk 2/10 · Minimal
- Hot days now (above 93°F)
- 7 days/yr
- Hot days in 30 yrs
- 15 days/yr
Wind risk 1/10 · Minimal
- Chance of severe wind over 30 yrs
- 0.0%
Air-quality risk 2/10 · Minimal
- Unhealthy air days now
- 1 days/yr
- Unhealthy air days in 30 yrs
- 1 days/yr
Risk factors via First Street. Map © Google.
Why this score? — see what drove the B+ grade
The composite is a weighted blend of 9 inputs, each scored 0–100. Each bar is that input's sub-score; the figure is the points it added to the 100-point composite (weight × sub-score).
- Cash flow +30.0/30.0
- 1% rule +10.0/10.0
- DSCR +10.0/10.0
- Appreciation +7.8/10.0
- ARV discount +7.5/15.0
- Schools +3.5/10.0
- Livability +3.2/5.0
- Rent growth +2.5/5.0
- Condition / age +2.5/5.0
$69,900
🖨 Deal sheet 📄 Offer letter ✓ Due diligence
Multi-family units
County records classify this as Multi-Family (2-4 Unit). Listing-text estimate: 1 unit. estimate disagrees with records
Listing remarks MLS
DUPLEX IN THE VILLAGE. THIS ASSET NEEDS WORK, ARE YOU UP FOR IT? THIS DUPLEX IS A LOWER AND UPPER. ALSO HAS A LARGE BARN FOR PARKING OR WHAT EVER. CALL TODAY !!!
Key facts
- Open layout
- High ceilings
- Large storage garage
Tags
Property features AI
Exterior
- Parking: Detached garage; 2-car garage
- Utilities: Electricity connected; Public water connected; Sewer connected
- Home design: 2 stories; Existing construction
- Construction: Wood siding; Architectural shingle roof; Block and stone foundation; Finished basement
- Exterior features: Gravel driveway; Rectangular residential lot; City street frontage; Lot dimensions approximately 132 x 165
Interior
- Kitchen: Eat-in kitchen
- Bedrooms: 1 main-level bedroom
- Bathrooms: 2 full bathrooms; 1 main-level bathroom
- Heating & cooling: Heating: see remarks
- Interior features: Separate/formal dining room; Eat-in kitchen; Workshop; Other (see remarks)
- Laundry & utility: Main-level laundry
Neighborhood map
What this means for you Summary
Snapshot
- This is a 2-bed/2.0-bath multifamily listed at $70k.
Deal economics
- At list price, monthly cash flow is $307 ($4k/yr) — positive.
- The deal already cash-flows at list — no discount required.
- Meets the 1% rule at list price ($1k rent vs $70k).
- Recommended offer: $62k (12.0% below list) — sets the bar for market timing.
Location & tenants
- Location reads 65/100 on livability (#693 in NY) — a middle-class / working-renter tenant base. Strengths: housing A+, crime A, cost of living A-; Watch: employment D, health & safety D, amenities F.
- Indian River Central School District (rural): math 33% / reading 50% proficiency, ranked #502 of 590 in NY (top 85%) — families likely to look elsewhere, expect single-tenant / working-renter base with shorter leases.
- Market conditions: 30 active listings in the ZIP; 196 units permitted in Jefferson County in 2024 (0 in 5+ unit buildings).
Forward outlook
- In year one you build about $4k of equity ($483 loan paydown + $4k appreciation (5.6% local appreciation)).
- Jefferson County population projected at -12% by 2050 — secular population decline; favor cash flow + early exit over multi-decade hold.
- At projected returns (5.6% appreciation + 3.0% rent growth), your $20k cash investment doubles in ~3 years — after that, you're playing with house money.
- By year 8, paydown + projected appreciation supports a ~$34k cash-out refi (75% LTV) — recoverable capital for the next deal without selling this one.
Negotiation context
- It's been on market 186 days — a 12% lower offer ($62k) is reasonable based on typical stale-listing flexibility.
- 2 sale attempts since 7y ago with the ask held roughly flat each time — persistent listings suggest the price (not the market) is what's stuck; bring a comps-based counter.
- Current owner paid $10k; list at $70k implies a 582% gain — meaningful room to come down on a strong offer.
Risks & watch-outs
- Watch-outs: property tax is 2.8% of price; built in 1880 — expect roof / HVAC / electrical / plumbing capex.
Questions for the listing agent
- It's been on market 186 days. Have you received any prior offers? Is the seller open to a 12% concession, seller financing, or rate buy-down credit?
- Built in 1880 — when were the roof, HVAC, electrical panel, plumbing, and water heater last replaced?
- Property tax is high relative to price — has the assessment been appealed recently, and will the sale trigger a re-assessment?
- Why hasn't it sold? Are there any deal-killer items the seller is aware of (foundation, flood, title, zoning, code violations)?
- Is there a deadline driving the sale (1031 exchange, divorce, estate, relocation)? That informs how much negotiation room exists.
- What's the average days-on-market for RENTAL listings here right now (not sales)? A rising rental-DOM trend means longer vacancies and softer asking-rent achievability than the comps imply.
- What's the recent tenant-quality profile in this submarket — average credit score on applications, eviction rate, late-payment / NSF rate, and stable-employment percentage? A property-management company in the area should have these aggregated.
- How much new apartment / multifamily construction is in the pipeline within 1–3 miles? Heavy new supply (>2% of stock underway) typically softens rents 12–24 months out; light construction supports rent growth.
Investment metrics
- 1% rule
- 1.57% ✓
- Cap rate
- 11.56%
- Cash-on-cash
- 18.81%
- DSCR
- 1.84
- GRM
- 5.3
CMA / ARV
No comps found within radius.
Projected returns pro-forma
5.63% appreciation · 3.0% rent growth · sell at horizon
- IRR
- 30.4%
- Equity multiple
- 2.95×
- Total profit
- $38,243
- Equity at exit
- $42,296
- IRR
- 28.6%
- Equity multiple
- 5.99×
- Total profit
- $97,758
- Equity at exit
- $75,320
Cash invested: $19,572 (down + closing). Projections, not guarantees.
Landlord ↔ Tenant lean methodology
- Overall (STATE)
- 15 Strongly Tenant-Friendly
- State New York
- 15 Strongly Tenant-Friendly · D+10
- County
- — inherits STATE
- City
- — inherits STATE
ZIP-level market 13691
- Home prices YoY
- 1.2%
- Active inventory
- 30
- Price-to-rent
- 5.3×
Monthly cashflow live
- Estimated rent
- $1,098 medium interval (Pro) →
- Mortgage (P&I)
- −$367
- Tax from tax record
- −$165 /mo · $1,976/yr
- Insurance
- −$29
- HOA
- −$0
- Vacancy / Maint / Mgmt
- −$231
- Net cashflow
- $307
Break-even live
UW: 25.0% down · 7.5% · 30yr · 1.5% tax · 5.0% vac · 8.0% maint · 8.0% mgmt
Financing live
Cash to close
- Down payment
- $17,475
- Closing costs
- $2,097
- Reserves months
- —
- Total cash needed
- —
Loan-product check · same deal, 3 products live
Conventional
25% down · 7.5% · 30yr
- Down + closing
- —
- Monthly P&I
- —
- Monthly cashflow
- —
- DSCR
- —
- Eligible?
- —
Personal DTI + credit; lowest rate.
DSCR
20% down · 8.5% · 30yr
- Down + closing
- —
- Monthly P&I
- —
- Monthly cashflow
- —
- DSCR
- —
- Eligible?
- —
No personal income docs; deal must DSCR.
Hard money
10% down · 12.0% · 12mo
- Down + closing
- —
- Monthly P&I
- —
- Monthly cashflow
- —
- DSCR
- —
- Eligible?
- —
Short-term bridge; refi at stabilization.
Listing history 20 events
-
2026-06-19days on market $69,900 Active 186 DOM
-
2026-06-18days on market $69,900 Active 185 DOM
-
2026-06-17days on market $69,900 Active 184 DOM
-
2026-06-16days on market $69,900 Active 183 DOM
-
2026-06-15days on market $69,900 Active 182 DOM
-
2026-06-14days on market $69,900 Active 180 DOM
-
2026-06-12days on market $69,900 Active 179 DOM
-
2026-06-09days on market $69,900 Active 176 DOM
-
2026-06-08days on market $69,900 Active 175 DOM
-
2026-06-07days on market $69,900 Active 174 DOM
-
2026-06-05days on market $69,900 Active 171 DOM
-
2026-06-03days on market $69,900 Active 170 DOM
-
2026-06-02days on market $69,900 Active 169 DOM
-
2026-06-01days on market $69,900 Active 168 DOM
-
2026-05-31days on market $69,900 Active 167 DOM
-
2026-05-30days on market $69,900 Active 166 DOM
-
2025-12-14$69,900 Active
-
2019-07-30soldstatus $10,250 161-char remark
Show marketing remark (161 chars)
DUPLEX IN THE VILLAGE. THIS ASSET NEEDS WORK, ARE YOU UP FOR IT? THIS DUPLEX IS A LOWER AND UPPER. ALSO HAS A LARGE BARN FOR PARKING OR WHAT EVER. CALL TODAY !!!
-
2019-03-11$12,500 161-char remark
Show marketing remark (161 chars)
DUPLEX IN THE VILLAGE. THIS ASSET NEEDS WORK, ARE YOU UP FOR IT? THIS DUPLEX IS A LOWER AND UPPER. ALSO HAS A LARGE BARN FOR PARKING OR WHAT EVER. CALL TODAY !!!
-
2006-06-27soldstatus $55,000
ⓘ Source: listings_history table (triggers on properties + properties_extension) + one-shot
backfill from property_details.listing_events for pre-trigger history.
Tax reassessment forecast NY · Partial reset (capped growth)
- Current annual tax
- $1,976 · $165/mo
- Projected year-2 tax
- $1,976 · $165/mo
- Expected delta
- $0/yr ($0/mo · 0.0%)
ⓘ Screening estimate from a state-policy table — verify with the county assessor before closing.
Climate risk First Street
- Flood 1/10 Low FEMA zone X · 0% chance over 30 yrs
- Wildfire 3/10 Moderate
- Heat 2/10 Low 7 d/yr ≥93°F today · 15 d/yr by 30 yrs out
- Wind 1/10 Low 0% chance of damaging wind over 30 yrs
- Air quality 2/10 Low 1 unhealthy d/yr today · 1 by 30 yrs out
Nearby sold comps map
Loading sold comps map…
Walkable amenities ~0.75 mi
Loading nearby amenities…
Taxation est. · year 1
- Rental income
- $13,173
- − Mortgage interest
- −$3,915
- − Property taxes
- −$1,976
- − Insurance
- −$350
- − Repairs & maintenance
- −$1,054
- − Management
- −$1,054
- − Depreciation
- −$2,033
- Taxable income
- $2,791
- Est. tax owed @ 24.0%
- −$670
- After-tax cash flow
- $3,013/yr
For passive investors: Depreciation is non-cash, so a rental often shows a tax loss while cash-flowing — sheltering income. Rental losses are passive: they offset passive income freely, and up to $25,000/yr can offset ordinary (W-2) income if you actively participate and your MAGI is under $100k (phasing out to $0 by $150k); unused losses carry forward. On sale, claimed depreciation is recaptured at up to 25%, and gains may owe capital-gains tax (a 1031 exchange can defer both). Figures are a year-1 estimate at your 24.0% rate — not tax advice; consult a CPA.
Schools (NCES district)
- District
- Indian River Central School District
- NCES district ID
- 3615300
- Math proficiency
- 33% ▼ -21.00%
- Reading proficiency
- 50% ▲ 1.00%
- Median HH income
- $45,599
- Composite
- 35.25/100
- National rank
- #4977
- State rank
- #502 of 590 in NY
Livability — Theresa
- Score
- 65/100
- State rank
- #693
- US rank
- #13103
Category grades
Schools grade is shown separately in the Schools card above.
Census & demographics
- Census place
- Theresa, NY
- Population (ZIP)
- 3,172
Population outlook (Jefferson County) Hauer SSP2
- Today (2025)
- 111,748 people
- By 2030
- 109,370 · -2.1%
- By 2040
- 103,828 · -7.1%
- By 2050
- 98,523 · -11.8%
- By 2075
- 91,422 · -18.2%
- By 2100
- 78,214 · -30.0%
Race, ethnicity, and origin ACS 2023
- Neighborhood character
- Predominantly White (82%)
- Race & ethnicity
- White 82% Two or more races 12% Asian 3% Hispanic / Latino 2%
- Common ancestry
- Lithuanian 5% Slovak 2% Romanian 2%
- Foreign-born
- 2% · China, Canada
- Languages at home
- 97% English-only · Other Indo-European 1% Spanish 1% Chinese 1%
Political lean MEDSL · Jefferson
- 2024 margin
- Strong R (+23.6) · D 38.2% · R 61.8%
- 2008→2024 swing
- -18.3pp toward R · 2008: -5.3pp · 2024: -23.6pp
- All cycles
- 2024: R+23.6 2020: R+19.0 2016: R+22.4 2012: R+2.9 2008: R+5.3
Not yet ingested
- Civics
- —
Market trends
- HPI YoY
- ▲ 5.63%
- Current HPI
- 459.7016
- Rent YoY
- —
- Metro
- —
- State GDP YoY
- ▲ 2.60%
- F500 in state
- 92
Industry mix (Fortune 500 HQ in NY)
| Industry | F500 HQs | Revenue |
|---|---|---|
| Financial Services | 10 | $950B |
|
||
| Consumer Goods | 9 | $162B |
|
||
| Insurance | 4 | $225B |
|
||
| Telecommunications | 2 | $144B |
|
||
| Pharmaceuticals | 2 | $112B |
|
||
| Media / Entertainment | 2 | $69B |
|
||
Price history
+27.1% since first listed4 events — show timeline
- 2025-12-14 Listed $69,900 CNYIS
- 2019-07-30 Sold (MLS) $10,250 CNYIS
- 2019-03-11 Listed $12,500 CNYIS
- 2006-06-27 Sold (Public Records) $55,000 Public Records
Property tax history
+0.7%/yrLatest (2025): $1,976 · +0.3% YoY. Source: county tax records.
Cash-flow waterfall
monthlySold comps — $/sqft
last 12 mo · ≤1 miLoading sold comps…