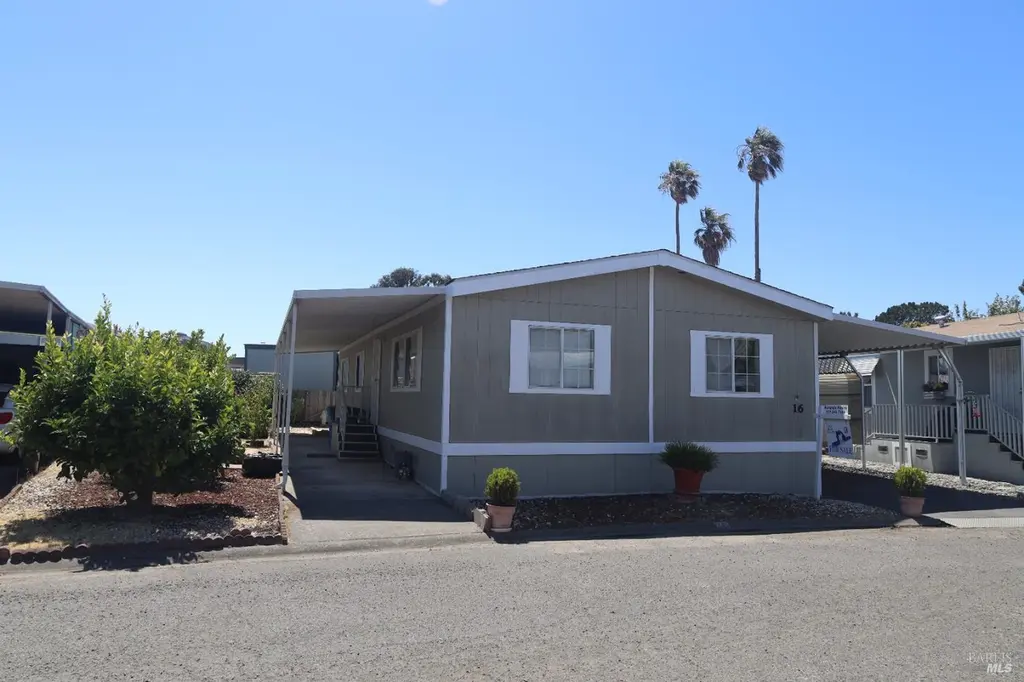
3000 Broadway St #16 · American Canyon, CA
Flood risk 1/10 · Minimal
- FEMA flood zone
- A
- Chance of flooding over 30 yrs
- 0.0%
- Est. flood insurance / yr
- $1,009 – $1,996
Fire risk 5/10 · Moderate
- Est. fire insurance / yr
- $659 – $1,223
Heat risk 4/10 · Minor
- Hot days now (above 94°F)
- 7 days/yr
- Hot days in 30 yrs
- 12 days/yr
Wind risk 1/10 · Minimal
- Chance of severe wind over 30 yrs
- —
Air-quality risk 8/10 · Major
- Unhealthy air days now
- 13 days/yr
- Unhealthy air days in 30 yrs
- 13 days/yr
Risk factors via First Street. Map © Google.
Why this score? — see what drove the C+ grade
The composite is a weighted blend of 9 inputs, each scored 0–100. Each bar is that input's sub-score; the figure is the points it added to the 100-point composite (weight × sub-score).
- Cash flow +30.0/30.0
- DSCR +10.0/10.0
- 1% rule +8.3/10.0
- Schools +4.0/10.0
- Livability +3.7/5.0
- Rent growth +2.5/5.0
- Condition / age +2.5/5.0
- ARV discount +0.0/15.0
- Appreciation +0.0/10.0
$225,000
🖨 Deal sheet (PDF) 📄 Offer letter ✓ Due diligence
Listing remarks MLS
Great 1995 Home in the sought after Las Casitas Mobile Home Park. This unit offers a generous amount of living space, as well as good size bedrooms. its in move-in ready condition and is complete with a refrigerator, and a washer and dryer. New interior paint, dual pane windows, storage shed and ample parking. This is a great mobile home and it won't last!
Key facts
- Laundry area
- Kitchen
- Covered carport
Tags
Property features AI
Finance
- Financial info: Monthly land lease: $750
- HOA & community: No association; Senior community
Exterior
- Parking: 2 parking spaces; Covered parking; Guest parking available
- Security: Carbon monoxide detector; Smoke detector
- Utilities: Individual electric meter; Natural gas connected; Public sewer; 220 volt outlet in laundry
- Home design: Manufactured home (double wide) located in a park; Original condition; Land lease community
- Construction: Composition roof; Wood skirt; Make: Oakmanor; Manufacturer: 90002 Skyline HM INC
- Exterior features: Covered patio; Porch steps; Carport awning; Patio awning; Porch awning; Outbuilding, shed(s) and storage
Interior
- Kitchen: Dishwasher; Disposal; Free-standing gas oven; Gas cooktop; Hood over range; Free-standing refrigerator; Breakfast area; Ceramic counter; Pantry cabinet; Dining/Living combo
- Bedrooms: 2 bedrooms
- Flooring: Carpet; Vinyl
- Bathrooms: 2 full bathrooms; Tub with shower over
- Heating & cooling: Central heating (gas); No cooling
- Interior features: Cathedral ceiling; Carbon monoxide detector; Smoke detector; Accessibility features
- Laundry & utility: Washer and dryer included; Laundry inside
Neighborhood map
What this means for you Summary
Snapshot
- This is a 2-bed/2.0-bath manufactured listed at $225k.
Deal economics
- At list price, monthly cash flow is $915 ($11k/yr) — positive.
- The deal already cash-flows at list — no discount required.
- Meets the 1% rule at list price ($3k rent vs $225k).
- Recommended offer: $222k (1.5% below list) — sets the bar for market timing.
- Cap rate 11.8% vs local median 3.2% in American Canyon — top-decile yield for the area; either an underpriced asset or a hidden risk that comps aren't pricing in. Stress-test before assuming the spread holds.
Location & tenants
- Location reads 74/100 on livability (#133 in CA, #4,684 nationally) — a middle-class / working-renter tenant base. Strengths: employment A+, housing A+, health & safety A+; Watch: amenities F, cost of living F.
- Napa Valley Unified (urban): math 35% / reading 48% proficiency, ranked #599 of 1,400 in CA (top 43%) — families likely to look elsewhere, expect single-tenant / working-renter base with shorter leases.
- Zoned schools: Canyon Oaks Elementary (708 students, 58% FRL); American Canyon Middle (1,007 students, 60% FRL); American Canyon High (1,722 students, 53% FRL) — zoned schools average 57% FRL vs 38% district-wide (18 pts higher); higher-poverty schools than district average — tighter screening recommended.
- Market conditions: 67 active listings in the ZIP; 8 comparable units currently listed for rent nearby; rentals at typical pace (median 16d on market — plan ~3-4 weeks tenant-placement turnaround); high-income renter base; 427 units permitted in Napa County in 2024 (189 in 5+ unit buildings).
Forward outlook
- Local home prices are declining (-3.0%/yr); year-one equity from $2k of loan paydown is wiped out by about $7k of value loss. Plan a longer hold.
- Napa County population projected at +14% by 2050 — modest demand growth; plan on rents tracking national, not racing it.
- At projected returns (-3.0% appreciation + 3.0% rent growth), your $63k cash investment doubles in ~7 years — after that, you're playing with house money.
Negotiation context
- It's been on market 18 days — a 2% lower offer ($222k) is reasonable based on typical stale-listing flexibility.
- 4 sale attempts since 9y ago with the ask held roughly flat each time — persistent listings suggest the price (not the market) is what's stuck; bring a comps-based counter.
- Current owner paid $105k; list at $225k implies a 114% gain — meaningful room to come down on a strong offer.
Risks & watch-outs
- Watch-outs: flood insurance adds $125/mo.
- Climate carrying-cost: in FEMA flood zone A (mandatory federal flood insurance); moderate wildfire risk — expect insurance premiums to compound above CPI over the hold.
Questions for the listing agent
- What's the actual annual flood-insurance premium (NFIP or private), and is the property in a SFHA with mandatory coverage?
- Is there a deadline driving the sale (1031 exchange, divorce, estate, relocation)? That informs how much negotiation room exists.
- What's the average days-on-market for RENTAL listings here right now (not sales)? A rising rental-DOM trend means longer vacancies and softer asking-rent achievability than the comps imply.
- What's the recent tenant-quality profile in this submarket — average credit score on applications, eviction rate, late-payment / NSF rate, and stable-employment percentage? A property-management company in the area should have these aggregated.
- How much new for-sale + rental construction is in the pipeline within 1–3 miles? Heavy new supply typically softens prices + rents 12–24 months out; constrained supply supports both.
Investment metrics
- 1% rule
- 1.33% ✓
- Cap rate
- 11.84%
- Cash-on-cash
- 19.81%
- DSCR
- 1.88
- GRM
- 6.3
CMA / ARV
- ARV (on-the-fly)
- $175,968
- Comps found
- 12
Show comp detail 12 sales within ~0.75 mi
| Address | Dist | Beds/Ba | Sqft | Sold | Price | $/sf | Match |
|---|---|---|---|---|---|---|---|
| 3000 Broadway St #5 | 0.00mi | 3/2.0 (+1) | 1,227 (-2%) | 17mo | $245,000 | $200 | 78 |
| 244 American Canyon RD Spc 25 #25 | 0.20mi | 2/2.0 | 1,325 (+6%) | 3mo | $180,000 | $136 | 77 |
| 3000 Broadway St #93 | 0.07mi | 2/2.0 | 1,344 (+8%) | 14mo | $160,000 | $119 | 73 |
| 3000 3000 Broadway St Apt 92 St #92 | 0.00mi | 2/2.0 | 1,080 (-14%) | 7mo | $145,000 | $134 | 71 |
| 244 American Canyon Rd #193 | 0.20mi | 2/2.0 | 1,392 (+12%) | 4mo | $137,000 | $98 | 68 |
| 260 American Canyon Rd #93 | 0.32mi | 3/2.0 (+1) | 1,344 (+8%) | 13mo | $160,000 | $119 | 56 |
| 244 American Canyon Rd #133 | 0.13mi | 2/2.0 | 1,060 (-15%) | 17mo | $188,000 | $177 | 55 |
| 2525 Flosden Rd #90 | 0.69mi | 3/2.0 (+1) | 1,306 (+5%) | 1mo | $240,000 | $184 | 54 |
| 33 Flosden Rd | 0.58mi | 2/2.0 | 1,344 (+8%) | 9mo | $166,000 | $124 | 53 |
| 2555 Flosden Rd #11 | 0.68mi | 2/2.0 | 1,200 (-4%) | 12mo | $332,500 | $277 | 51 |
| 260 American Canyon Rd #58 | 0.42mi | 2/2.0 | 1,416 (+14%) | 11mo | $200,000 | $141 | 49 |
| 2555 Flosden Rd #65 | 0.68mi | 3/2.0 (+1) | 1,400 (+12%) | 2mo | $304,500 | $218 | 41 |
Match score weights: distance 35% · size 25% · config 20% · recency 20%. Top-matched comps best support the ARV.
Projected returns pro-forma
-3.0% appreciation · 3.0% rent growth · sell at horizon
- IRR
- 8.8%
- Equity multiple
- 1.35×
- Total profit
- $21,768
- Equity at exit
- $33,548
- IRR
- 18.0%
- Equity multiple
- 2.49×
- Total profit
- $93,875
- Equity at exit
- $19,454
Cash invested: $63,000 (down + closing). Projections, not guarantees.
Landlord ↔ Tenant lean methodology
- Overall (STATE)
- 18 Strongly Tenant-Friendly
- State California
- 18 Strongly Tenant-Friendly · D+13
- County
- — inherits STATE
- City
- — inherits STATE
ZIP-level market 94503
- Home prices YoY
- -21.0%
- Active inventory
- 67
- Price-to-rent
- 6.3×
Monthly cashflow live
- Estimated rent
- $2,989 high interval (Pro) →
- Mortgage (P&I)
- −$1,180
- Tax from tax record
- −$48 /mo · $578/yr
- Insurance
- −$94
- Flood insurance flood zone
- −$125 /mo · $1,502/yr
- HOA
- −$0
- Vacancy / Maint / Mgmt
- −$628
- Net cashflow
- $915
Break-even live
Sensitivity live
| Price | -10% $1,042 | -5% $978 | +0% $915 | +5% $851 | +10% $787 |
|---|---|---|---|---|---|
| Rent | -10% $678 | -5% $796 | +0% $915 | +5% $1,033 | +10% $1,151 |
| Rate | -1.0pp $1,028 | -0.5pp $972 | base $915 | +0.5pp $856 | +1.0pp $797 |
UW: 25.0% down · 7.5% · 30yr · 1.5% tax · 5.0% vac · 8.0% maint · 8.0% mgmt
Financing live
Cash to close
- Down payment
- $56,250
- Closing costs
- $6,750
- Reserves months
- —
- Total cash needed
- —
Loan-product check · same deal, 3 products live
Conventional
25% down · 7.5% · 30yr
- Down + closing
- —
- Monthly P&I
- —
- Monthly cashflow
- —
- DSCR
- —
- Eligible?
- —
Personal DTI + credit; lowest rate.
DSCR
20% down · 8.5% · 30yr
- Down + closing
- —
- Monthly P&I
- —
- Monthly cashflow
- —
- DSCR
- —
- Eligible?
- —
No personal income docs; deal must DSCR.
Hard money
10% down · 12.0% · 12mo
- Down + closing
- —
- Monthly P&I
- —
- Monthly cashflow
- —
- DSCR
- —
- Eligible?
- —
Short-term bridge; refi at stabilization.
Rent comps 8 comps
| Address | Beds | Baths | Sqft | Rent | $/sqft | DOM | Units | Dist |
|---|---|---|---|---|---|---|---|---|
| 100 Toscana Dr American Canyon, CA | 2.0–3.0 | 2.5–3.5 | 1466 | $3,244 | $2.21 | 16d | 5 | 0.25mi |
| 300 Swan Way Vallejo, CA | 3.0 | 2.0 | 1134 | $2,775 | $2.45 | 23d | 1 | 0.55mi |
| 2525 Flosden Rd #16 American Canyon, CA | 3.0 | 2.0 | 1244 | $2,795 | $2.25 | 16d | 1 | 0.67mi |
| 137 Imelda St Unit 3BR/1BA Vallejo, CA | 3.0 | 1.0 | 1080 | $3,250 | $3.01 | 16d | 1 | 0.73mi |
| 123 David Ct Vallejo, CA | 3.0 | 2.0 | 1323 | $3,149 | $2.38 | 16d | 1 | 0.83mi |
| 424 Corcoran Ave Vallejo, CA | 2.0 | 1.0 | 1200 | $2,300 | $1.92 | 16d | 1 | 0.96mi |
| 125 Hibiscus Ct Vallejo, CA | 3.0 | 1.0 | 1000 | $2,709 | $2.71 | 45d | 1 | 1.24mi |
| 165 Georgetown Ct Vallejo, CA | 3.0 | 2.0 | 1144 | $2,695 | $2.36 | 25d | 1 | 1.33mi |
Listing history 19 events
-
2026-06-10days on market $225,000 Active 18 DOM
-
2026-06-09days on market $225,000 Active 17 DOM
-
2026-06-08days on market $225,000 Active 16 DOM
-
2026-06-07days on market $225,000 Active 15 DOM
-
2026-06-05days on market $225,000 Active 12 DOM
-
2026-06-03days on market $225,000 Active 11 DOM
-
2026-06-02days on market $225,000 Active 10 DOM
-
2026-06-01days on market $225,000 Active 9 DOM
-
2026-05-31days on market $225,000 Active 8 DOM
-
2026-05-30days on market $225,000 Active 7 DOM
-
2026-03-07$225,000 Active
-
2025-11-12status Active
-
2025-11-12price $235,000
-
2025-10-07historical Contingent (Show)
-
2025-09-07price $245,000
-
2025-08-01$254,900 Active
-
2017-12-06soldstatus $105,000 Sold 359-char remark
Show marketing remark (359 chars)
Great 1995 Home in the sought after Las Casitas Mobile Home Park. This unit offers a generous amount of living space, as well as good size bedrooms. its in move-in ready condition and is complete with a refrigerator, and a washer and dryer. New interior paint, dual pane windows, storage shed and ample parking. This is a great mobile home and it won't last!
-
2017-11-10status Pending 359-char remark
Show marketing remark (359 chars)
Great 1995 Home in the sought after Las Casitas Mobile Home Park. This unit offers a generous amount of living space, as well as good size bedrooms. its in move-in ready condition and is complete with a refrigerator, and a washer and dryer. New interior paint, dual pane windows, storage shed and ample parking. This is a great mobile home and it won't last!
-
2017-10-14$109,000 Active 359-char remark
Show marketing remark (359 chars)
Great 1995 Home in the sought after Las Casitas Mobile Home Park. This unit offers a generous amount of living space, as well as good size bedrooms. its in move-in ready condition and is complete with a refrigerator, and a washer and dryer. New interior paint, dual pane windows, storage shed and ample parking. This is a great mobile home and it won't last!
ⓘ Source: listings_history table (triggers on properties + properties_extension) + one-shot
backfill from property_details.listing_events for pre-trigger history.
Tax reassessment forecast CA · Resets to sale price
- Current annual tax
- $578 · $48/mo
- Projected year-2 tax
- $1,710 · $142/mo
- Expected delta
- +$1,132/yr (+$94/mo · 195.6%)
ⓘ Screening estimate from a state-policy table — verify with the county assessor before closing.
Climate risk First Street
- Flood 1/10 Low FEMA zone A · 0% chance over 30 yrs
- Wildfire 5/10 Major
- Heat 4/10 Moderate 7 d/yr ≥94°F today · 12 d/yr by 30 yrs out
- Wind 1/10 Low
- Air quality 8/10 Severe 13 unhealthy d/yr today · 13 by 30 yrs out
Nearby sold comps map
Loading sold comps map…
Walkable amenities ~0.75 mi
Loading nearby amenities…
Taxation est. · year 1
- Rental income
- $35,873
- − Mortgage interest
- −$12,603
- − Property taxes
- −$578
- − Insurance
- −$2,628
- − Repairs & maintenance
- −$2,870
- − Management
- −$2,870
- − Depreciation
- −$6,545
- Taxable income
- $7,779
- Est. tax owed @ 24.0%
- −$1,867
- After-tax cash flow
- $9,108/yr
For passive investors: Depreciation is non-cash, so a rental often shows a tax loss while cash-flowing — sheltering income. Rental losses are passive: they offset passive income freely, and up to $25,000/yr can offset ordinary (W-2) income if you actively participate and your MAGI is under $100k (phasing out to $0 by $150k); unused losses carry forward. On sale, claimed depreciation is recaptured at up to 25%, and gains may owe capital-gains tax (a 1031 exchange can defer both). Figures are a year-1 estimate at your 24.0% rate — not tax advice; consult a CPA.
Schools (NCES district)
- District
- Napa Valley Unified
- NCES district ID
- 0626640
- Math proficiency
- 35% ▲ 1.00%
- Reading proficiency
- 48% ▲ 2.00%
- Median HH income
- $72,007
- Composite
- 40.18/100
- National rank
- #7827
- State rank
- #599 of 1400 in CA
Livability — American Canyon
- Score
- 74/100
- State rank
- #133
- US rank
- #4684
Category grades
Schools grade is shown separately in the Schools card above.
Census & demographics
- Census place
- American Canyon, CA
- County
- Napa County · 120,669 people
- City population
- 21,841
- Metro
- Napa, CA
- Population (ZIP)
- 21,841
- Household income
- $121,088
- Rent vs Own
- Severe rent burden
- 486.0
Population outlook (Napa County) Hauer SSP2
- Today (2025)
- 153,987 people
- By 2030
- 159,490 · +3.6%
- By 2040
- 168,796 · +9.6%
- By 2050
- 176,213 · +14.4%
- By 2075
- 190,113 · +23.5%
- By 2100
- 190,528 · +23.7%
Race, ethnicity, and origin ACS 2023
- Neighborhood character
- Highly diverse neighborhood (Simpson 0.75)
- Race & ethnicity
- Asian 33% Hispanic / Latino 31% White 21% Two or more races 15% Black 6% Pacific Islander 1%
- Hispanic origin (detail)
- Mexican 25%
- Common ancestry
- Italian 2% Lithuanian 1% Romanian 1%
- Foreign-born
- 31% · Canada, China, Vietnam
- Languages at home
- 57% English-only · Spanish 22% Tagalog/Filipino 15% Other Indo-European 3%
Political lean MEDSL · Napa
- 2024 margin
- Solid D (+34.9) · D 65.9% · R 31.1% · Other 3.0%
- 2008→2024 swing
- +2.4pp toward D · 2008: 32.5pp · 2024: 34.9pp
- All cycles
- 2024: D+34.9 2020: D+40.4 2016: D+35.2 2012: D+25.7 2008: D+32.5
Not yet ingested
- Civics
- —
Market trends
- HPI YoY
- ▼ -97.47%
- Current HPI
- 366.9139
- Rent YoY
- —
- Metro
- Napa, CA
- State GDP YoY
- ▲ 3.21%
- F500 in state
- 116
Industry mix (Fortune 500 HQ in CA)
| Industry | F500 HQs | Revenue |
|---|---|---|
| Technology | 27 | $1,492B |
|
||
| Financial Services | 3 | $174B |
|
||
| Retail | 3 | $44B |
|
||
| Insurance | 3 | $26B |
|
||
| Media / Entertainment | 2 | $115B |
|
||
| Pharmaceuticals / Biotech | 2 | $62B |
|
||
Price history
+106.4% since first listed9 events — show timeline
- 2026-03-07 Listed $225,000 BAREIS
- 2025-11-12 Relisted — BAREIS
- 2025-11-12 Price Changed $235,000 BAREIS
- 2025-10-07 Contingent — BAREIS
- 2025-09-07 Price Changed $245,000 BAREIS
- 2025-08-01 Listed $254,900 BAREIS
- 2017-12-06 Sold (MLS) $105,000 BAREIS
- 2017-11-10 Pending — BAREIS
- 2017-10-14 Listed $109,000 BAREIS
Property tax history
+0.2%/yrLatest (2025): $578 · +13.2% YoY. Source: county tax records.
Cash-flow waterfall
monthlySold comps — $/sqft
last 12 mo · ≤1 miLoading sold comps…