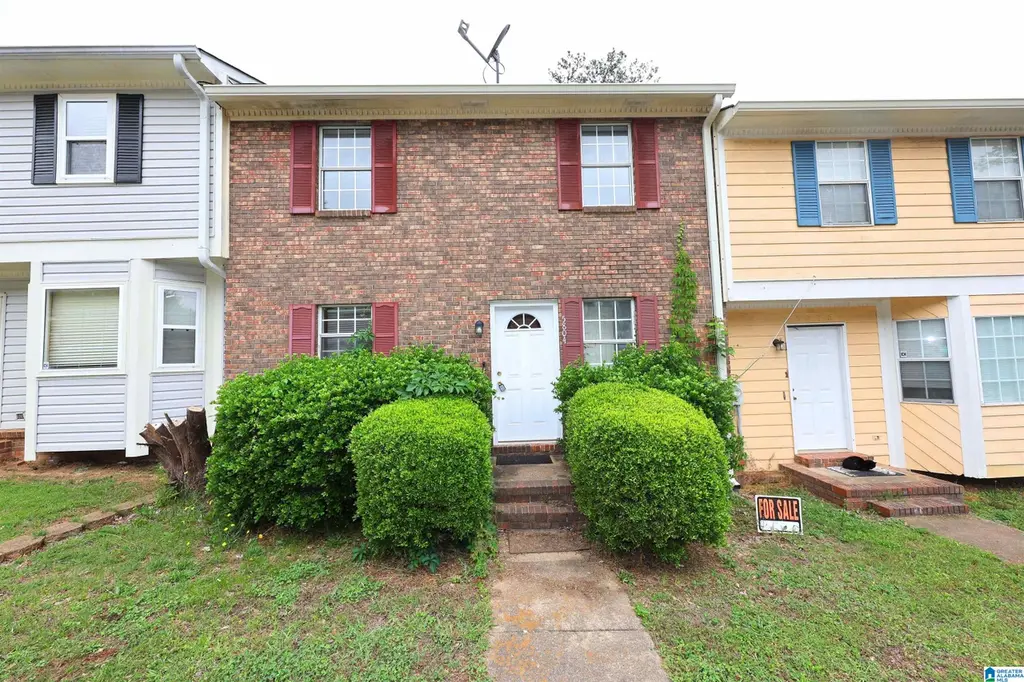
5804 Woodgate Cir · Anniston, AL
Flood risk 1/10 · Minimal
- FEMA flood zone
- X (unshaded)
- Chance of flooding over 30 yrs
- 0.0%
- Est. flood insurance / yr
- $507 – $1,088
Fire risk 4/10 · Minor
- Est. fire insurance / yr
- $916 – $1,700
Heat risk 7/10 · Major
- Hot days now (above 105°F)
- 7 days/yr
- Hot days in 30 yrs
- 21 days/yr
Wind risk 6/10 · Moderate
- Chance of severe wind over 30 yrs
- 27.0%
Air-quality risk 2/10 · Minimal
- Unhealthy air days now
- 1 days/yr
- Unhealthy air days in 30 yrs
- 1 days/yr
Risk factors via First Street. Map © Google.
Why this score? — see what drove the C+ grade
The composite is a weighted blend of 9 inputs, each scored 0–100. Each bar is that input's sub-score; the figure is the points it added to the 100-point composite (weight × sub-score).
- Cash flow +25.3/30.0
- ARV discount +15.0/15.0
- DSCR +8.4/10.0
- 1% rule +5.9/10.0
- Livability +2.9/5.0
- Rent growth +2.5/5.0
- Condition / age +2.5/5.0
- Schools +0.5/10.0
- Appreciation +0.0/10.0
$119,900
🖨 Deal sheet (PDF) 📄 Offer letter ✓ Due diligence
Listing remarks
Move-in ready and conveniently located! This charming townhouse in the Woodgate subdivision features 3 bedrooms, 2½ bathrooms, new flooring, and fresh paint throughout. Enjoy the convenience of being just minutes from shopping, dining, and everyday amenities. This home offers the perfect combination of comfort, convenience, and value. Don’t miss out—schedule your showing today!
Key facts
- Built 1986
- Listed 19 days
Property features AI
Finance
- Other: Approximately 0.05 acres; Subdivision: WOODGATE
Exterior
- Parking: Driveway parking
- Utilities: Public water; Connected sewer; Electric water heater; Internet service available
- Home design: One-side brick construction; Slab foundation; Existing year built; Split-level layout
- Construction: 1-side brick exterior; Slab foundation
- Exterior features: Porch; Open deck
Interior
- Kitchen: Laminate countertops; Built-in dishwasher
- Bedrooms: Bedrooms on upper level; Walk-in closets; Linen closet
- Flooring: Carpet; Vinyl
- Bathrooms: Two full bathrooms; One half bathroom; Tub/shower combo
- Heating & cooling: Central heating; Central cooling
- Interior features: Recessed lighting; Other ceiling details
- Laundry & utility: Main-level laundry room; Washer hookup; Electric dryer hookup
Neighborhood map
What this means for you Summary
Snapshot
- This is a 3-bed/1.5-bath townhouse listed at $120k.
Deal economics
- At list price, monthly cash flow is $274 ($3k/yr) — positive.
- The deal already cash-flows at list — no discount required.
- Meets the 1% rule at list price ($1k rent vs $120k).
- Recommended offer: $118k (1.5% below list) — sets the bar for market timing.
- Cap rate 9.0% vs local median 5.1% in Anniston — top-decile yield for the area; either an underpriced asset or a hidden risk that comps aren't pricing in. Stress-test before assuming the spread holds.
Location & tenants
- Location reads 58/100 on livability (#348 in AL) — a working-class tenant base; expect higher turnover. Strengths: cost of living A+, housing A+, health & safety A+; Watch: crime F, amenities F, commute F.
- Anniston City (urban): math 2% / reading 12% proficiency, ranked #128 of 129 in AL (top 99%) — low school quality limits family demand, transient renter base, plan for 1-2y turnover; 87% free/reduced lunch — lower-income household profile, screen leases tightly.
- Zoned schools: Randolph Park Elementary School (math 2% / reading 22%, grade F, #536 of 627 statewide, top 88%, 337 students, 95% FRL); Anniston Middle School (math 2% / reading 0%, grade F, #257 of 257 statewide, top 100%, 393 students, 91% FRL); Anniston High School (math 2% / reading 12%, grade F, #265 of 305 statewide, top 89%, 466 students, 86% FRL) — zoned schools at 91% FRL track the district average.
- Market conditions: 40 active listings in the ZIP; 135 units permitted in Calhoun County in 2024 (0 in 5+ unit buildings).
- This rent runs 31% of the median local income ($51k/yr) — at the standard rent-burdened threshold; future hikes will face affordability resistance.
Forward outlook
- Local home prices are declining (-3.0%/yr); year-one equity from $829 of loan paydown is wiped out by about $4k of value loss. Plan a longer hold.
- Calhoun County population projected at -21% by 2050 — secular population decline; favor cash flow + early exit over multi-decade hold.
Negotiation context
- It's been on market 19 days — a 2% lower offer ($118k) is reasonable based on typical stale-listing flexibility.
Risks & watch-outs
- Climate carrying-cost: major wind risk, 27% chance of damaging wind over 30y; extreme-heat days projected 7→21/yr by 2055 (HVAC capex compounding) — expect insurance premiums to compound above CPI over the hold.
Questions for the listing agent
- Is there a deadline driving the sale (1031 exchange, divorce, estate, relocation)? That informs how much negotiation room exists.
- Schools are D-rated, which usually means shorter tenancies and higher turnover. Who's the typical renter profile here, and what's been the actual vacancy rate?
- Crime grade is F in this area — have there been break-ins, vandalism, or insurance claims at this property in the last 3 years? What carrier currently insures it and at what premium?
- What's the average days-on-market for RENTAL listings here right now (not sales)? A rising rental-DOM trend means longer vacancies and softer asking-rent achievability than the comps imply.
- What's the recent tenant-quality profile in this submarket — average credit score on applications, eviction rate, late-payment / NSF rate, and stable-employment percentage? A property-management company in the area should have these aggregated.
- How much new for-sale + rental construction is in the pipeline within 1–3 miles? Heavy new supply typically softens prices + rents 12–24 months out; constrained supply supports both.
Investment metrics
- 1% rule
- 1.09% ✓
- Cap rate
- 9.03%
- Cash-on-cash
- 9.78%
- DSCR
- 1.44
- GRM
- 7.7
CMA / ARV
- ARV (on-the-fly)
- $172,032
- Comps found
- 2
Show comp detail 2 sales within ~0.75 mi
| Address | Dist | Beds/Ba | Sqft | Sold | Price | $/sf | Match |
|---|---|---|---|---|---|---|---|
| 593 Morton Rd | 0.32mi | 3/2.0 | 1,519 (-1%) | 24mo | $170,000 | $112 | 62 |
| 5805 Woodgate Cir | 0.03mi | 3/2.5 | 1,752 (+14%) | 15mo | $120,000 | $68 | 59 |
Match score weights: distance 35% · size 25% · config 20% · recency 20%. Top-matched comps best support the ARV.
Projected returns pro-forma
-3.0% appreciation · 3.0% rent growth · sell at horizon
- IRR
- -1.6%
- Equity multiple
- 0.94×
- Total profit
- $-2,018
- Equity at exit
- $17,877
- IRR
- 8.1%
- Equity multiple
- 1.61×
- Total profit
- $20,597
- Equity at exit
- $10,367
Cash invested: $33,572 (down + closing). Projections, not guarantees.
Landlord ↔ Tenant lean methodology
- Overall (STATE)
- 90 Strongly Landlord-Friendly
- State Alabama
- 90 Strongly Landlord-Friendly · R+15
- County
- — inherits STATE
- City
- — inherits STATE
ZIP-level market 36206
- Home prices YoY
- -20.6%
- Active inventory
- 40
- Price-to-rent
- 7.7×
Monthly cashflow live
- Estimated rent
- $1,306 medium interval (Pro) →
- Mortgage (P&I)
- −$629
- Tax from tax record
- −$79 /mo · $951/yr
- Insurance
- −$50
- HOA
- −$0
- Vacancy / Maint / Mgmt
- −$274
- Net cashflow
- $274
Break-even live
Sensitivity live
| Price | -10% $342 | -5% $308 | +0% $274 | +5% $240 | +10% $206 |
|---|---|---|---|---|---|
| Rent | -10% $171 | -5% $222 | +0% $274 | +5% $325 | +10% $377 |
| Rate | -1.0pp $334 | -0.5pp $304 | base $274 | +0.5pp $243 | +1.0pp $211 |
UW: 25.0% down · 7.5% · 30yr · 1.5% tax · 5.0% vac · 8.0% maint · 8.0% mgmt
Financing live
Cash to close
- Down payment
- $29,975
- Closing costs
- $3,597
- Reserves months
- —
- Total cash needed
- —
Loan-product check · same deal, 3 products live
Conventional
25% down · 7.5% · 30yr
- Down + closing
- —
- Monthly P&I
- —
- Monthly cashflow
- —
- DSCR
- —
- Eligible?
- —
Personal DTI + credit; lowest rate.
DSCR
20% down · 8.5% · 30yr
- Down + closing
- —
- Monthly P&I
- —
- Monthly cashflow
- —
- DSCR
- —
- Eligible?
- —
No personal income docs; deal must DSCR.
Hard money
10% down · 12.0% · 12mo
- Down + closing
- —
- Monthly P&I
- —
- Monthly cashflow
- —
- DSCR
- —
- Eligible?
- —
Short-term bridge; refi at stabilization.
Listing history 15 events
-
2026-06-22days on market $119,900 Active 19 DOM
-
2026-06-19days on market $119,900 Active 17 DOM
-
2026-06-18days on market $119,900 Active 16 DOM
-
2026-06-17days on market $119,900 Active 15 DOM
-
2026-06-16days on market $119,900 Active 14 DOM
-
2026-06-15days on market $119,900 Active 13 DOM
-
2026-06-14days on market $119,900 Active 11 DOM
-
2026-06-13days on market $119,900 Active 10 DOM
-
2026-06-10days on market $119,900 Active 8 DOM
-
2026-06-09days on market $119,900 Active 7 DOM
-
2026-06-08days on market $119,900 Active 6 DOM
-
2026-06-07days on market $119,900 Active 5 DOM
-
2026-06-05days on market $119,900 Active 2 DOM
-
2026-06-03remarks 380-char remark
-
2026-06-03$119,900 Active 1 DOM
ⓘ Source: listings_history table (triggers on properties + properties_extension) + one-shot
backfill from property_details.listing_events for pre-trigger history.
Tax reassessment forecast AL · Resets to sale price
- Current annual tax
- $951 · $79/mo
- Projected year-2 tax
- $951 · $79/mo
- Expected delta
- $0/yr ($0/mo · 0.0%)
ⓘ Screening estimate from a state-policy table — verify with the county assessor before closing.
Climate risk First Street
- Flood 1/10 Low FEMA zone X (unshaded) · 0% chance over 30 yrs
- Wildfire 4/10 Moderate
- Heat 7/10 Severe 7 d/yr ≥105°F today · 21 d/yr by 30 yrs out
- Wind 6/10 Major 27% chance of damaging wind over 30 yrs
- Air quality 2/10 Low 1 unhealthy d/yr today · 1 by 30 yrs out
Nearby sold comps map
Loading sold comps map…
Walkable amenities ~0.75 mi
Loading nearby amenities…
Taxation est. · year 1
- Rental income
- $15,671
- − Mortgage interest
- −$6,716
- − Property taxes
- −$951
- − Insurance
- −$600
- − Repairs & maintenance
- −$1,254
- − Management
- −$1,254
- − Depreciation
- −$3,488
- Taxable income
- $1,409
- Est. tax owed @ 24.0%
- −$338
- After-tax cash flow
- $2,947/yr
For passive investors: Depreciation is non-cash, so a rental often shows a tax loss while cash-flowing — sheltering income. Rental losses are passive: they offset passive income freely, and up to $25,000/yr can offset ordinary (W-2) income if you actively participate and your MAGI is under $100k (phasing out to $0 by $150k); unused losses carry forward. On sale, claimed depreciation is recaptured at up to 25%, and gains may owe capital-gains tax (a 1031 exchange can defer both). Figures are a year-1 estimate at your 24.0% rate — not tax advice; consult a CPA.
Schools (NCES district)
- District
- Anniston City
- NCES district ID
- 0100090
- Math proficiency
- 2% ▼ -20.00%
- Reading proficiency
- 12% ▼ -15.00%
- Median HH income
- $31,824
- Composite
- 5.36/100
- National rank
- #10030
- State rank
- #128 of 129 in AL
Livability — Anniston
- Score
- 58/100
- State rank
- #348
- US rank
- #20680
Category grades
Schools grade is shown separately in the Schools card above.
Census & demographics
- Census place
- Anniston, AL
- County
- Calhoun County · 71,763 people
- City population
- 19,220
- Metro
- Anniston-Oxford, AL
- Population (ZIP)
- 11,172
- Household income
- $51,116
- Rent vs Own
- Severe rent burden
- 300.0
Population outlook (Calhoun County) Hauer SSP2
- Today (2025)
- 109,765 people
- By 2030
- 105,708 · -3.7%
- By 2040
- 96,192 · -12.4%
- By 2050
- 86,413 · -21.3%
- By 2075
- 63,467 · -42.2%
- By 2100
- 44,704 · -59.3%
Race, ethnicity, and origin ACS 2023
- Neighborhood character
- Diverse neighborhood (Simpson 0.59)
- Race & ethnicity
- White 51% Black 38% Hispanic / Latino 5% Two or more races 4% Asian 2%
- Hispanic origin (detail)
- Mexican 4%
- Common ancestry
- Serbian 2% Italian 1% Slovak 1%
- Foreign-born
- 6% · Canada
- Languages at home
- 92% English-only · Spanish 5% Other Asian/Pacific 1%
Political lean MEDSL · Calhoun
- 2024 margin
- Solid R (+44.8) · D 27.2% · R 71.9%
- 2008→2024 swing
- -12.2pp toward R · 2008: -32.5pp · 2024: -44.8pp
- All cycles
- 2024: R+44.8 2020: R+39.0 2016: R+41.4 2012: R+31.9 2008: R+32.5
Not yet ingested
- Civics
- —
Market trends
- HPI YoY
- ▼ -45.39%
- Current HPI
- 175.4422
- Rent YoY
- —
- Metro
- Anniston-Oxford, AL
- State GDP YoY
- ▲ 2.94%
- F500 in state
- 4
Industry mix (Fortune 500 HQ in AL)
| Industry | F500 HQs | Revenue |
|---|---|---|
| Financial Services | 1 | $8B |
|
||
| Healthcare | 1 | $5B |
|
||
Price history
1 event — show timeline
- 2026-06-02 Listed $119,900 Greater Alabama MLS
Property tax history
+4.4%/yrLatest (2025): $951 · +0.0% YoY. Source: county tax records.
Cash-flow waterfall
monthlySold comps — $/sqft
last 12 mo · ≤1 miLoading sold comps…