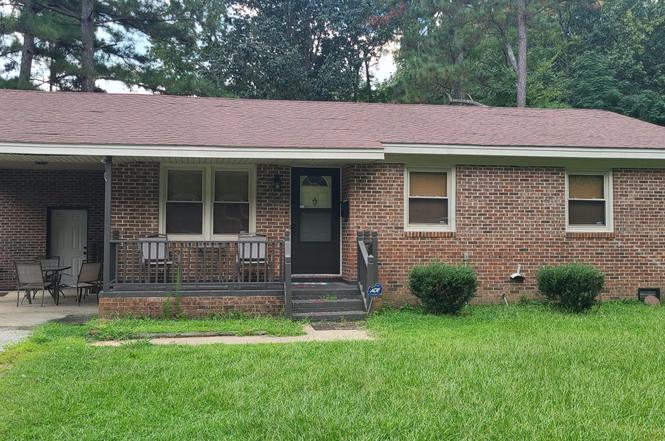
216 E Troy St · Ahoskie, NC
Flood risk 3/10 · Minor
- FEMA flood zone
- X (unshaded)
- Chance of flooding over 30 yrs
- 0.2%
- Est. flood insurance / yr
- $507 – $1,088
Fire risk 3/10 · Minor
- Est. fire insurance / yr
- $906 – $1,684
Heat risk 8/10 · Major
- Hot days now (above 106°F)
- 7 days/yr
- Hot days in 30 yrs
- 16 days/yr
Wind risk 8/10 · Major
- Chance of severe wind over 30 yrs
- 80.0%
Air-quality risk 1/10 · Minimal
- Unhealthy air days now
- 0 days/yr
- Unhealthy air days in 30 yrs
- 0 days/yr
Risk factors via First Street. Map © Google.
Why this score? — see what drove the B grade
The composite is a weighted blend of 9 inputs, each scored 0–100. Each bar is that input's sub-score; the figure is the points it added to the 100-point composite (weight × sub-score).
- Cash flow +30.0/30.0
- 1% rule +10.0/10.0
- DSCR +10.0/10.0
- ARV discount +7.5/15.0
- Appreciation +6.3/10.0
- Livability +2.9/5.0
- Rent growth +2.5/5.0
- Condition / age +2.5/5.0
- Schools +1.6/10.0
$75,000
🖨 Deal sheet 📄 Offer letter ✓ Due diligence
Listing remarks
Handyman's Special in Ahoskie - 3 Bedroom Home with Great Potential Bring your vision to life at 216 E Troy Street, Ahoskie, NC! This 3-bedroom, 1-bath home is the perfect opportunity for investors, DIY enthusiasts, or first-time buyers looking for a project. The home features a traditional floor plan with comfortable living spaces and ample natural light. While it needs substantial work to the floors and some updating throughout, the solid layout and charming location make it a fantastic canvas for customization. Situated on a nice lot in a quiet neighborhood, this property offers both convenience and potential value. With some TLC, it can be transformed into a cozy family home, a profi
Key facts
- 7,405 sq ft lot
- Parking
- Built 1970
Property features AI
Exterior
- Parking: Carport with 1 space; Gravel and aggregate parking surface
- Utilities: Public water; Sewer connected; Natural gas available; Cable available; Water connected
- Home design: Single-family residence; One level
- Construction: Brick veneer construction; Composition roof; Brick/mortar foundation; Built on a 0.17-acre lot (approx. 85 x 86 x 85 x 86)
- Exterior features: Front porch; Storm door(s); Has a view; Paved road frontage on city street and state road
Interior
- Bedrooms: Total of 5 rooms (includes bedrooms and living spaces)
- Bathrooms: 1 full bathroom; 1 half bathroom
- Heating & cooling: Central air conditioning; Electric forced-air heating
- Interior features: No fireplace; No basement
Neighborhood map
What this means for you Summary
Snapshot
- This is a 3-bed/1.0-bath single-family listed at $75k.
Deal economics
- At list price, monthly cash flow is $770 ($9k/yr) — positive.
- The deal already cash-flows at list — no discount required.
- Meets the 1% rule at list price ($2k rent vs $75k).
- Recommended offer: $66k (12.0% below list) — sets the bar for market timing.
- Cap rate 18.6% vs local median 7.7% in Ahoskie — top-decile yield for the area; either an underpriced asset or a hidden risk that comps aren't pricing in. Stress-test before assuming the spread holds.
Location & tenants
- Location reads 57/100 on livability (#600 in NC) — a working-class tenant base; expect higher turnover. Strengths: cost of living A+, health & safety A+, housing B+; Watch: crime F, amenities F, commute F.
- Hertford County Schools (town): math 14% / reading 26% proficiency, ranked #171 of 178 in NC (top 96%) — low school quality limits family demand, transient renter base, plan for 1-2y turnover; 74% free/reduced lunch — lower-income household profile, screen leases tightly.
- Zoned schools: Ahoskie Elementary (math 12% / reading 26%, grade F, #1,269 of 1,410 statewide, top 91%, 228 students, 99% FRL); Hertford County Middle (math 6% / reading 26%, grade F, #455 of 475 statewide, top 96%, 536 students, 99% FRL); Hertford County High (math 12% / reading 12%, grade F, #518 of 535 statewide, top 97%, 573 students, 100% FRL) — zoned schools average 99% FRL vs 74% district-wide (26 pts higher); higher-poverty schools than district average — tighter screening recommended.
- Market conditions: 59 active listings in the ZIP; 5 units permitted in Hertford County in 2024 (0 in 5+ unit buildings).
Forward outlook
- In year one you build about $2k of equity ($519 loan paydown + $2k appreciation (2.5% local appreciation)).
- Hertford County population projected at -15% by 2050 — secular population decline; favor cash flow + early exit over multi-decade hold.
- At projected returns (2.5% appreciation + 3.0% rent growth), your $21k cash investment doubles in ~2 years — after that, you're playing with house money.
Negotiation context
- It's been on market 257 days — a 12% lower offer ($66k) is reasonable based on typical stale-listing flexibility.
- 7 sale attempts since 4y ago with the ask held roughly flat each time — persistent listings suggest the price (not the market) is what's stuck; bring a comps-based counter.
Risks & watch-outs
- Climate carrying-cost: severe wind risk, 80% chance of damaging wind over 30y; extreme-heat days projected 7→16/yr by 2055 (HVAC capex compounding) — expect insurance premiums to compound above CPI over the hold.
Questions for the listing agent
- It's been on market 257 days. Have you received any prior offers? Is the seller open to a 12% concession, seller financing, or rate buy-down credit?
- Built in 1970 — when were the roof, HVAC, electrical panel, plumbing, and water heater last replaced?
- Why hasn't it sold? Are there any deal-killer items the seller is aware of (foundation, flood, title, zoning, code violations)?
- Is there a deadline driving the sale (1031 exchange, divorce, estate, relocation)? That informs how much negotiation room exists.
- Schools are F-rated, which usually means shorter tenancies and higher turnover. Who's the typical renter profile here, and what's been the actual vacancy rate?
- Crime grade is F in this area — have there been break-ins, vandalism, or insurance claims at this property in the last 3 years? What carrier currently insures it and at what premium?
- What's the average days-on-market for RENTAL listings here right now (not sales)? A rising rental-DOM trend means longer vacancies and softer asking-rent achievability than the comps imply.
- What's the recent tenant-quality profile in this submarket — average credit score on applications, eviction rate, late-payment / NSF rate, and stable-employment percentage? A property-management company in the area should have these aggregated.
- How much new for-sale + rental construction is in the pipeline within 1–3 miles? Heavy new supply typically softens prices + rents 12–24 months out; constrained supply supports both.
Investment metrics
- 1% rule
- 2.17% ✓
- Cap rate
- 18.61%
- Cash-on-cash
- 43.99%
- DSCR
- 2.96
- GRM
- 3.8
CMA / ARV
- ARV (on-the-fly)
- $153,216
- Comps found
- 6
Show comp detail 6 sales within ~0.75 mi
| Address | Dist | Beds/Ba | Sqft | Sold | Price | $/sf | Match |
|---|---|---|---|---|---|---|---|
| 904 Dr. Martin Luther King Jr Dr | 0.24mi | 3/1.0 | 959 (-10%) | 14mo | $138,000 | $144 | 61 |
| 623 Curtis St N | 0.64mi | 3/1.5 | 1,080 (+2%) | 9mo | $65,000 | $60 | 58 |
| 109 Malibu Dr | 0.74mi | 3/2.0 | 1,056 (-1%) | 8mo | $155,000 | $147 | 53 |
| 514 N Mitchell St | 0.33mi | 3/1.0 | 1,188 (+12%) | 15mo | $23,500 | $20 | 53 |
| 1009 Curtis St N | 0.67mi | 3/1.0 | 1,184 (+11%) | 10mo | $180,000 | $152 | 42 |
| 912 N Liberty St | 0.73mi | 3/2.0 | 1,133 (+6%) | 16mo | $116,200 | $103 | 38 |
Match score weights: distance 35% · size 25% · config 20% · recency 20%. Top-matched comps best support the ARV.
Projected returns pro-forma
2.52% appreciation · 3.0% rent growth · sell at horizon
- IRR
- 48.7%
- Equity multiple
- 3.68×
- Total profit
- $56,201
- Equity at exit
- $31,720
- IRR
- 48.9%
- Equity multiple
- 7.37×
- Total profit
- $133,788
- Equity at exit
- $47,381
Cash invested: $21,000 (down + closing). Projections, not guarantees.
Landlord ↔ Tenant lean methodology
- Overall (STATE)
- 85 Strongly Landlord-Friendly
- State North Carolina
- 85 Strongly Landlord-Friendly · R+3
- County
- — inherits STATE
- City
- — inherits STATE
ZIP-level market 27910
- Home prices YoY
- 1.9%
- Active inventory
- 59
- Price-to-rent
- 3.8×
Monthly cashflow live
- Estimated rent
- $1,624 medium interval (Pro) →
- Mortgage (P&I)
- −$393
- Tax from tax record
- −$88 /mo · $1,062/yr
- Insurance
- −$31
- HOA
- −$0
- Vacancy / Maint / Mgmt
- −$341
- Net cashflow
- $770
Break-even live
UW: 25.0% down · 7.5% · 30yr · 1.5% tax · 5.0% vac · 8.0% maint · 8.0% mgmt
Financing live
Cash to close
- Down payment
- $18,750
- Closing costs
- $2,250
- Reserves months
- —
- Total cash needed
- —
Loan-product check · same deal, 3 products live
Conventional
25% down · 7.5% · 30yr
- Down + closing
- —
- Monthly P&I
- —
- Monthly cashflow
- —
- DSCR
- —
- Eligible?
- —
Personal DTI + credit; lowest rate.
DSCR
20% down · 8.5% · 30yr
- Down + closing
- —
- Monthly P&I
- —
- Monthly cashflow
- —
- DSCR
- —
- Eligible?
- —
No personal income docs; deal must DSCR.
Hard money
10% down · 12.0% · 12mo
- Down + closing
- —
- Monthly P&I
- —
- Monthly cashflow
- —
- DSCR
- —
- Eligible?
- —
Short-term bridge; refi at stabilization.
Listing history 25 events
-
2026-06-18days on market $75,000 Active 257 DOM
-
2026-06-17days on market $75,000 Active 256 DOM
-
2026-06-16days on market $75,000 Active 255 DOM
-
2026-06-15days on market $75,000 Active 254 DOM
-
2026-06-13days on market $75,000 Active 252 DOM
-
2026-06-12days on market $75,000 Active 251 DOM
-
2026-06-09days on market $75,000 Active 248 DOM
-
2026-06-08days on market $75,000 Active 247 DOM
-
2026-06-07days on market $75,000 Active 246 DOM
-
2026-06-07days on market $75,000 Active 245 DOM
-
2026-06-04days on market $75,000 Active 242 DOM
-
2026-06-02days on market $75,000 Active 241 DOM
-
2026-06-01days on market $75,000 Active 240 DOM
-
2026-05-31days on market $75,000 Active 239 DOM
-
2026-03-26status Active
-
2026-03-26historical
-
2026-02-21status Active
-
2026-02-20historical
-
2026-01-11status Active
-
2025-12-31historical
-
2025-09-22$75,000 Active
-
2025-05-19historical
-
2025-04-22$65,000 Active
-
2025-03-07$75,000 Active
-
2022-09-05$110,000
ⓘ Source: listings_history table (triggers on properties + properties_extension) + one-shot
backfill from property_details.listing_events for pre-trigger history.
Tax reassessment forecast NC · Resets to sale price
- Current annual tax
- $1,062 · $88/mo
- Projected year-2 tax
- $1,062 · $88/mo
- Expected delta
- $0/yr ($0/mo · 0.0%)
ⓘ Screening estimate from a state-policy table — verify with the county assessor before closing.
Climate risk First Street
- Flood 3/10 Moderate FEMA zone X (unshaded) · 20% chance over 30 yrs
- Wildfire 3/10 Moderate
- Heat 8/10 Severe 7 d/yr ≥106°F today · 16 d/yr by 30 yrs out
- Wind 8/10 Severe 80% chance of damaging wind over 30 yrs
- Air quality 1/10 Low 0 unhealthy d/yr today · 0 by 30 yrs out
Nearby sold comps map
Loading sold comps map…
Walkable amenities ~0.75 mi
Loading nearby amenities…
Taxation est. · year 1
- Rental income
- $19,486
- − Mortgage interest
- −$4,201
- − Property taxes
- −$1,062
- − Insurance
- −$375
- − Repairs & maintenance
- −$1,559
- − Management
- −$1,559
- − Depreciation
- −$2,182
- Taxable income
- $8,548
- Est. tax owed @ 24.0%
- −$2,052
- After-tax cash flow
- $7,186/yr
For passive investors: Depreciation is non-cash, so a rental often shows a tax loss while cash-flowing — sheltering income. Rental losses are passive: they offset passive income freely, and up to $25,000/yr can offset ordinary (W-2) income if you actively participate and your MAGI is under $100k (phasing out to $0 by $150k); unused losses carry forward. On sale, claimed depreciation is recaptured at up to 25%, and gains may owe capital-gains tax (a 1031 exchange can defer both). Figures are a year-1 estimate at your 24.0% rate — not tax advice; consult a CPA.
Schools (NCES district)
- District
- Hertford County Schools
- NCES district ID
- 3702160
- Math proficiency
- 14% ▼ -3.00%
- Reading proficiency
- 26% ▼ -1.00%
- Median HH income
- $33,467
- Composite
- 16.29/100
- National rank
- #9213
- State rank
- #171 of 178 in NC
Livability — Ahoskie
- Score
- 57/100
- State rank
- #600
- US rank
- #21815
Category grades
Schools grade is shown separately in the Schools card above.
Census & demographics
- Census place
- Ahoskie, NC
- City population
- 10,427
- Population (ZIP)
- 10,427
Population outlook (Hertford County) Hauer SSP2
- Today (2025)
- 23,401 people
- By 2030
- 22,708 · -3.0%
- By 2040
- 21,227 · -9.3%
- By 2050
- 19,942 · -14.8%
- By 2075
- 17,844 · -23.7%
- By 2100
- 15,148 · -35.3%
Race, ethnicity, and origin ACS 2023
- Neighborhood character
- Diverse neighborhood (Simpson 0.55)
- Race & ethnicity
- Black 59% White 32% Hispanic / Latino 4% Two or more races 3% Native American 2% Asian 1%
- Common ancestry
- Serbian 1% Slovak 1%
- Foreign-born
- 3% · Canada, Philippines
- Languages at home
- 96% English-only · Spanish 3% Other Asian/Pacific 1%
Political lean MEDSL · Hertford
- 2024 margin
- Strong D (+26.8) · D 63.0% · R 36.3%
- 2008→2024 swing
- -14.8pp toward R · 2008: 41.5pp · 2024: 26.8pp
- All cycles
- 2024: D+26.8 2020: D+34.0 2016: D+37.7 2012: D+44.3 2008: D+41.5
Not yet ingested
- Civics
- —
Market trends
- HPI YoY
- ▲ 2.52%
- Current HPI
- 135.494
- Rent YoY
- —
- Metro
- —
- State GDP YoY
- ▲ 3.28%
- F500 in state
- 26
Industry mix (Fortune 500 HQ in NC)
| Industry | F500 HQs | Revenue |
|---|---|---|
| Financial Services | 2 | $213B |
|
||
| Retail | 2 | $95B |
|
||
| Industrial Conglomerate | 1 | $38B |
|
||
| Metals / Steel | 1 | $35B |
|
||
| Utilities | 1 | $30B |
|
||
| Industrial Machinery | 1 | $19B |
|
||
Price history
-31.8% since first listed11 events — show timeline
- 2026-03-26 Relisted — Hive MLS
- 2026-03-26 Listing Removed — Hive MLS
- 2026-02-21 Relisted — Hive MLS
- 2026-02-20 Listing Removed — Hive MLS
- 2026-01-11 Relisted — Hive MLS
- 2025-12-31 Listing Removed — Hive MLS
- 2025-09-22 Listed $75,000 Hive MLS
- 2025-05-19 Listing Removed — Hive MLS
- 2025-04-22 Listed $65,000 Hive MLS
- 2025-03-07 Listed $75,000 RVLG
- 2022-09-05 Listed $110,000 RVLG
Property tax history
+1.3%/yrLatest (2025): $1,062 · +0.0% YoY. Source: county tax records.
Cash-flow waterfall
monthlySold comps — $/sqft
last 12 mo · ≤1 miLoading sold comps…