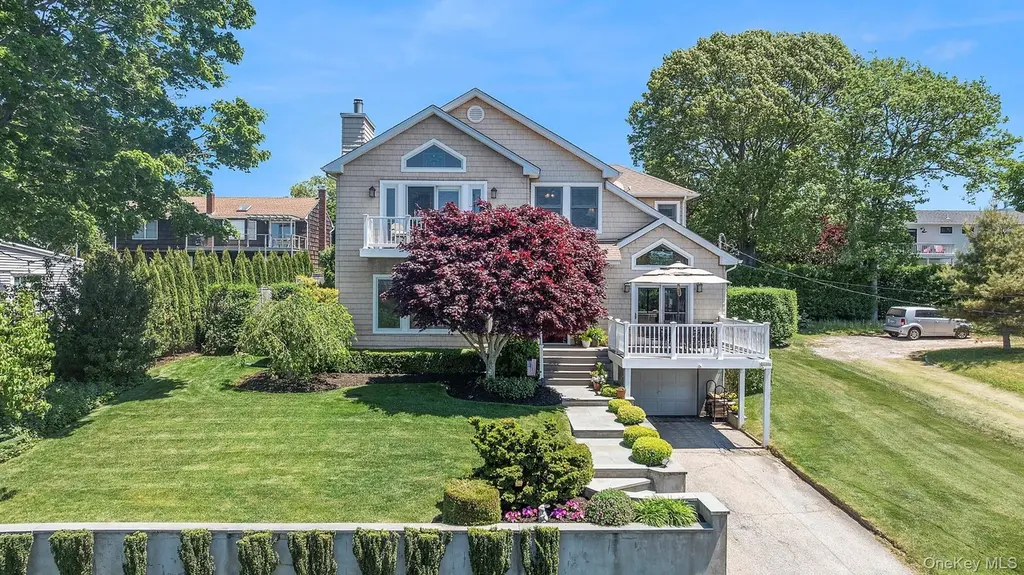
58 Cliff Dr · Noyack, NY
Flood risk 1/10 · Minimal
- FEMA flood zone
- X (unshaded)
- Chance of flooding over 30 yrs
- 0.0%
- Est. flood insurance / yr
- $473 – $860
Fire risk 1/10 · Minimal
- Est. fire insurance / yr
- $691 – $1,283
Heat risk 5/10 · Moderate
- Hot days now (above 90°F)
- 7 days/yr
- Hot days in 30 yrs
- 19 days/yr
Wind risk 8/10 · Major
- Chance of severe wind over 30 yrs
- 80.0%
Air-quality risk 3/10 · Minor
- Unhealthy air days now
- 2 days/yr
- Unhealthy air days in 30 yrs
- 3 days/yr
Risk factors via First Street. Map © Google.
Why this score? — see what drove the B- grade
The composite is a weighted blend of 9 inputs, each scored 0–100. Each bar is that input's sub-score; the figure is the points it added to the 100-point composite (weight × sub-score).
- Cash flow +27.9/30.0
- DSCR +9.8/10.0
- Appreciation +9.6/10.0
- 1% rule +6.3/10.0
- Schools +5.6/10.0
- Rent growth +5.0/5.0
- Livability +2.9/5.0
- Condition / age +2.5/5.0
- ARV discount +0.0/15.0
$2,395,000
🖨 Deal sheet 📄 Offer letter ✓ Due diligence
Listing remarks
365 Sunset Views - Bay Point - If you dream about water views, sunset views, moon and star views - you want to see this home. Set in Sag Harbor's coveted Bay Point, this 4-bedroom, 2-bath traditional offers a rare opportunity to live in closer rhythm with water, light, and seasonality. Thoughtfully rebuilt and expanded in 2007, the approximately 2,176-square-foot home sits on a manageable 0.17-acre parcel designed for ease, comfort, and a more intentional coastal lifestyle. Inside, an open kitchen with granite counters anchors the main living spaces, while the living room, dining area, and study create flexible zones for gathering, retreat, and everyday flow. Water views, a fireplace, and a
Key facts
- Ocean beaches
- Sag harbor village
- Granite counters
Tags
Property features AI
Finance
- HOA & community: Association present with annual fee
Exterior
- Parking: Driveway; Off-street parking; Private 1-car garage; 1-car carport
- Utilities: Electric service by PSEG; Septic tank; Cable connected; Electricity connected; Water connected
- Home design: Single family residence; Two levels; Living area reported from public records
- Construction: Frame construction
- Exterior features: Frame construction; Private pool; Not waterfront
Interior
- Kitchen: Cooktop; Oven; Dishwasher; Refrigerator; Stainless steel appliances; Wine refrigerator
- Bedrooms: 7 total rooms (bedroom count not specified)
- Flooring: Carpet; Hardwood
- Bathrooms: 2 full bathrooms
- Heating & cooling: Forced air heating (oil); Central air conditioning; Living room fireplace (1)
- Interior features: First-floor full bath; Breakfast bar; Open floor plan; Open kitchen; Stone counters; Partially finished basement with storage space; Pull-down attic stairs
- Laundry & utility: Washer; Dryer
Neighborhood map
What this means for you Summary
Snapshot
- This is a 4-bed/1.0-bath single-family listed at $2.40M.
Deal economics
- At list price, monthly cash flow is $7k ($88k/yr) — positive.
- The deal already cash-flows at list — no discount required.
- Meets the 1% rule at list price ($27k rent vs $2.40M).
- Cap rate 10.0% vs local median 7.1% in Noyack — top-decile yield for the area; either an underpriced asset or a hidden risk that comps aren't pricing in. Stress-test before assuming the spread holds.
Location & tenants
- Location reads 57/100 on livability (#1,084 in NY) — a working-class tenant base; expect higher turnover. Strengths: crime A+, employment A+; Watch: housing D+, amenities F, commute F.
- Sag Harbor Union Free School District (suburban): math 54% / reading 70% proficiency, ranked #175 of 590 in NY (top 30%) — acceptable for families but not a draw, mixed tenant base, ~2y average lease; only 8% free/reduced lunch — higher-income household profile.
- Zoned schools: Sag Harbor Elementary School (math 47% / reading 72%, grade B-, #745 of 2,108 statewide, top 39%, 426 students, 22% FRL); Pierson Middle/High School (math 61% / reading 72%, grade B, #763 of 1,100 statewide, top 69%, 525 students, 25% FRL) — zoned schools average 24% FRL vs 8% district-wide (16 pts higher); higher-poverty schools than district average — tighter screening recommended.
- Market conditions: Rents rising fast (+10.8%/yr); 65 active listings in the ZIP; 5 comparable units currently listed for rent nearby; rentals at typical pace (median 24d on market — plan ~3-4 weeks tenant-placement turnaround); 40% of comp listings sitting > 30 days — soft ceiling on asking rent; high-income renter base; 1,366 units permitted in Suffolk County in 2024 (216 in 5+ unit buildings).
- At $27,044/mo this rent would consume 254% of the median local household income ($128k/yr) (locally 95% of renters already pay >50% of income on rent) — very limited rent-growth headroom before tenants either downsize or default.
Forward outlook
- In year one you build about $237k of equity ($17k loan paydown + $220k appreciation (9.2% local appreciation)).
- Suffolk County population projected to shrink 5% by 2050 — rents likely to lag national; underwrite the cash flow, not the appreciation.
- At projected returns (9.2% appreciation + 8.0% rent growth), your $671k cash investment doubles in ~2 years — after that, you're playing with house money.
- By year 2, paydown + projected appreciation supports a ~$380k cash-out refi (75% LTV) — recoverable capital for the next deal without selling this one.
Negotiation context
- Only 14 days on market — expect competitive offers; lowballing is unlikely to land.
Risks & watch-outs
- Watch-outs: built in 1954 — expect roof / HVAC / electrical / plumbing capex.
- Climate carrying-cost: severe wind risk, 80% chance of damaging wind over 30y; extreme-heat days projected 7→19/yr by 2055 (HVAC capex compounding) — expect insurance premiums to compound above CPI over the hold.
Questions for the listing agent
- Built in 1954 — when were the roof, HVAC, electrical panel, plumbing, and water heater last replaced?
- Is there a deadline driving the sale (1031 exchange, divorce, estate, relocation)? That informs how much negotiation room exists.
- What's the average days-on-market for RENTAL listings here right now (not sales)? A rising rental-DOM trend means longer vacancies and softer asking-rent achievability than the comps imply.
- What's the recent tenant-quality profile in this submarket — average credit score on applications, eviction rate, late-payment / NSF rate, and stable-employment percentage? A property-management company in the area should have these aggregated.
- How much new for-sale + rental construction is in the pipeline within 1–3 miles? Heavy new supply typically softens prices + rents 12–24 months out; constrained supply supports both.
Investment metrics
- 1% rule
- 1.13% ✓
- Cap rate
- 9.97%
- Cash-on-cash
- 13.14%
- DSCR
- 1.58
- GRM
- 7.4
CMA / ARV
- ARV (on-the-fly)
- $1,629,824
- Comps found
- 2
Show comp detail 2 sales within ~0.75 mi
| Address | Dist | Beds/Ba | Sqft | Sold | Price | $/sf | Match |
|---|---|---|---|---|---|---|---|
| 65 Ridge Dr | 0.07mi | 4/3.5 | 2,435 (+12%) | 12mo | $1,825,000 | $749 | 56 |
| 221 Redwood Rd | 0.48mi | 3/2.0 (-1) | 2,010 (-8%) | 23mo | $1,451,000 | $722 | 36 |
Match score weights: distance 35% · size 25% · config 20% · recency 20%. Top-matched comps best support the ARV.
Projected returns pro-forma
9.19% appreciation · 8.0% rent growth · sell at horizon
- IRR
- 34.6%
- Equity multiple
- 3.66×
- Total profit
- $1,781,531
- Equity at exit
- $2,017,021
- IRR
- 31.9%
- Equity multiple
- 8.76×
- Total profit
- $5,201,709
- Equity at exit
- $4,208,384
Cash invested: $670,600 (down + closing). Projections, not guarantees.
Landlord ↔ Tenant lean methodology
- Overall (STATE)
- 15 Strongly Tenant-Friendly
- State New York
- 15 Strongly Tenant-Friendly · D+10
- County
- — inherits STATE
- City
- — inherits STATE
ZIP-level market 11963
- Home prices YoY
- 1.9%
- Rents YoY
- 10.8%
- Active inventory
- 65
- Price-to-rent
- 7.4×
Monthly cashflow live
- Estimated rent
- $27,044 medium interval (Pro) →
- Mortgage (P&I)
- −$12,560
- Tax from tax record
- −$467 /mo · $5,600/yr
- Insurance
- −$998
- HOA
- −$0
- Vacancy / Maint / Mgmt
- −$5,679
- Net cashflow
- $7,341
Break-even live
UW: 25.0% down · 7.5% · 30yr · 1.5% tax · 5.0% vac · 8.0% maint · 8.0% mgmt
Financing live
Cash to close
- Down payment
- $598,750
- Closing costs
- $71,850
- Reserves months
- —
- Total cash needed
- —
Loan-product check · same deal, 3 products live
Conventional
25% down · 7.5% · 30yr
- Down + closing
- —
- Monthly P&I
- —
- Monthly cashflow
- —
- DSCR
- —
- Eligible?
- —
Personal DTI + credit; lowest rate.
DSCR
20% down · 8.5% · 30yr
- Down + closing
- —
- Monthly P&I
- —
- Monthly cashflow
- —
- DSCR
- —
- Eligible?
- —
No personal income docs; deal must DSCR.
Hard money
10% down · 12.0% · 12mo
- Down + closing
- —
- Monthly P&I
- —
- Monthly cashflow
- —
- DSCR
- —
- Eligible?
- —
Short-term bridge; refi at stabilization.
Rent comps 5 comps
| Address | Beds | Baths | Sqft | Rent | $/sqft | DOM | Units | Dist |
|---|---|---|---|---|---|---|---|---|
| 68 W Water St Sag Harbor, NY | 3.0 | 2.0 | 1740 | $40,000 | $22.99 | 43d | 1 | 0.59mi |
| 16 Payne Ave Sag Harbor, NY | 3.0 | 3.0 | 1800 | $25,000 | $13.89 | 44d | 1 | 0.80mi |
| 91 Sunset Beach Rd Sag Harbor, NY | 4.0 | 3.0 | 2456 | $25,000 | $10.18 | 1d | 1 | 0.89mi |
| 4056 Noyack Rd Sag Harbor, NY | 4.0 | 3.0 | 2323 | $35,000 | $15.07 | 21d | 1 | 1.00mi |
| 70 Ridge Rd W Sag Harbor, NY | 3.0 | 3.0 | 2405 | $65,000 | $27.03 | 24d | 1 | 1.18mi |
Listing history 9 events
-
2026-06-18days on market $2,395,000 Active 14 DOM
-
2026-06-17days on market $2,395,000 Active 13 DOM
-
2026-06-16days on market $2,395,000 Active 12 DOM
-
2026-06-15days on market $2,395,000 Active 11 DOM
-
2026-06-13days on market $2,395,000 Active 9 DOM
-
2026-06-09days on market $2,395,000 Active 5 DOM
-
2026-06-08days on market $2,395,000 Active 4 DOM
-
2026-06-07remarks 699-char remark
-
2026-06-07$2,395,000 Active 3 DOM
ⓘ Source: listings_history table (triggers on properties + properties_extension) + one-shot
backfill from property_details.listing_events for pre-trigger history.
Tax reassessment forecast NY · Partial reset (capped growth)
- Current annual tax
- $5,600 · $467/mo
- Projected year-2 tax
- $23,038 · $1,920/mo
- Expected delta
- +$17,438/yr (+$1,453/mo · 311.4%)
ⓘ Screening estimate from a state-policy table — verify with the county assessor before closing.
Climate risk First Street
- Flood 1/10 Low FEMA zone X (unshaded) · 0% chance over 30 yrs
- Wildfire 1/10 Low
- Heat 5/10 Major 7 d/yr ≥90°F today · 19 d/yr by 30 yrs out
- Wind 8/10 Severe 80% chance of damaging wind over 30 yrs
- Air quality 3/10 Moderate 2 unhealthy d/yr today · 3 by 30 yrs out
Nearby sold comps map
Loading sold comps map…
Walkable amenities ~0.75 mi
Loading nearby amenities…
Taxation est. · year 1
- Rental income
- $324,528
- − Mortgage interest
- −$134,157
- − Property taxes
- −$5,600
- − Insurance
- −$11,975
- − Repairs & maintenance
- −$25,962
- − Management
- −$25,962
- − Depreciation
- −$69,673
- Taxable income
- $51,199
- Est. tax owed @ 24.0%
- −$12,288
- After-tax cash flow
- $75,799/yr
For passive investors: Depreciation is non-cash, so a rental often shows a tax loss while cash-flowing — sheltering income. Rental losses are passive: they offset passive income freely, and up to $25,000/yr can offset ordinary (W-2) income if you actively participate and your MAGI is under $100k (phasing out to $0 by $150k); unused losses carry forward. On sale, claimed depreciation is recaptured at up to 25%, and gains may owe capital-gains tax (a 1031 exchange can defer both). Figures are a year-1 estimate at your 24.0% rate — not tax advice; consult a CPA.
Schools (NCES district)
- District
- Sag Harbor Union Free School District
- NCES district ID
- 3625380
- Math proficiency
- 54% ▼ -13.00%
- Reading proficiency
- 70% ▲ 7.00%
- Median HH income
- $81,547
- Composite
- 55.69/100
- National rank
- #1222
- State rank
- #175 of 590 in NY
Livability — Noyack
- Score
- 57/100
- State rank
- #1084
- US rank
- #21915
Category grades
Schools grade is shown separately in the Schools card above.
Census & demographics
- Census place
- Noyack, NY
- County
- Suffolk County · 679,920 people
- City population
- 8,114
- Metro
- New York-Newark-Jersey City, NY-NJ-PA
- Population (ZIP)
- 8,390
- Household income
- $127,746
- Rent vs Own
- Severe rent burden
- 95.0
Population outlook (Suffolk County) Hauer SSP2
- Today (2025)
- 1,505,262 people
- By 2030
- 1,498,318 · -0.5%
- By 2040
- 1,471,101 · -2.3%
- By 2050
- 1,424,848 · -5.3%
- By 2075
- 1,337,157 · -11.2%
- By 2100
- 1,217,720 · -19.1%
Race, ethnicity, and origin ACS 2023
- Neighborhood character
- Predominantly White (78%)
- Race & ethnicity
- White 78% Hispanic / Latino 13% Two or more races 11% Asian 4% Black 2%
- Hispanic origin (detail)
- Mexican 8%
- Common ancestry
- Scotch-Irish 4% Romanian 3% Italian 2%
- Foreign-born
- 13% · Canada, China, Jamaica
- Languages at home
- 81% English-only · Spanish 9% Other Indo-European 5% French/Haitian/Cajun 2%
Political lean MEDSL · Suffolk
- 2024 margin
- Lean R (+10.0) · D 45.0% · R 55.0%
- 2008→2024 swing
- -16.0pp toward R · 2008: 6.0pp · 2024: -10.0pp
- All cycles
- 2024: R+10.0 2020: R+0.0 2016: R+8.2 2012: D+2.9 2008: D+6.0
Not yet ingested
- Civics
- —
Market trends
- HPI YoY
- ▲ 9.19%
- Current HPI
- 499.3304
- Rent YoY
- ▲ 10.76%
- Metro
- New York-Newark-Jersey City, NY-NJ-PA
- State GDP YoY
- ▲ 2.60%
- F500 in state
- 92
Industry mix (Fortune 500 HQ in NY)
| Industry | F500 HQs | Revenue |
|---|---|---|
| Financial Services | 10 | $950B |
|
||
| Consumer Goods | 9 | $162B |
|
||
| Insurance | 4 | $225B |
|
||
| Telecommunications | 2 | $144B |
|
||
| Pharmaceuticals | 2 | $112B |
|
||
| Media / Entertainment | 2 | $69B |
|
||
Price history
1 event — show timeline
- 2026-05-22 Listed $2,395,000 OneKey® MLS as Distributed by MLS Grid
Property tax history
+3.6%/yrLatest (2022): $5,600 · +0.0% YoY. Source: county tax records.
Cash-flow waterfall
monthlySold comps — $/sqft
last 12 mo · ≤1 miLoading sold comps…