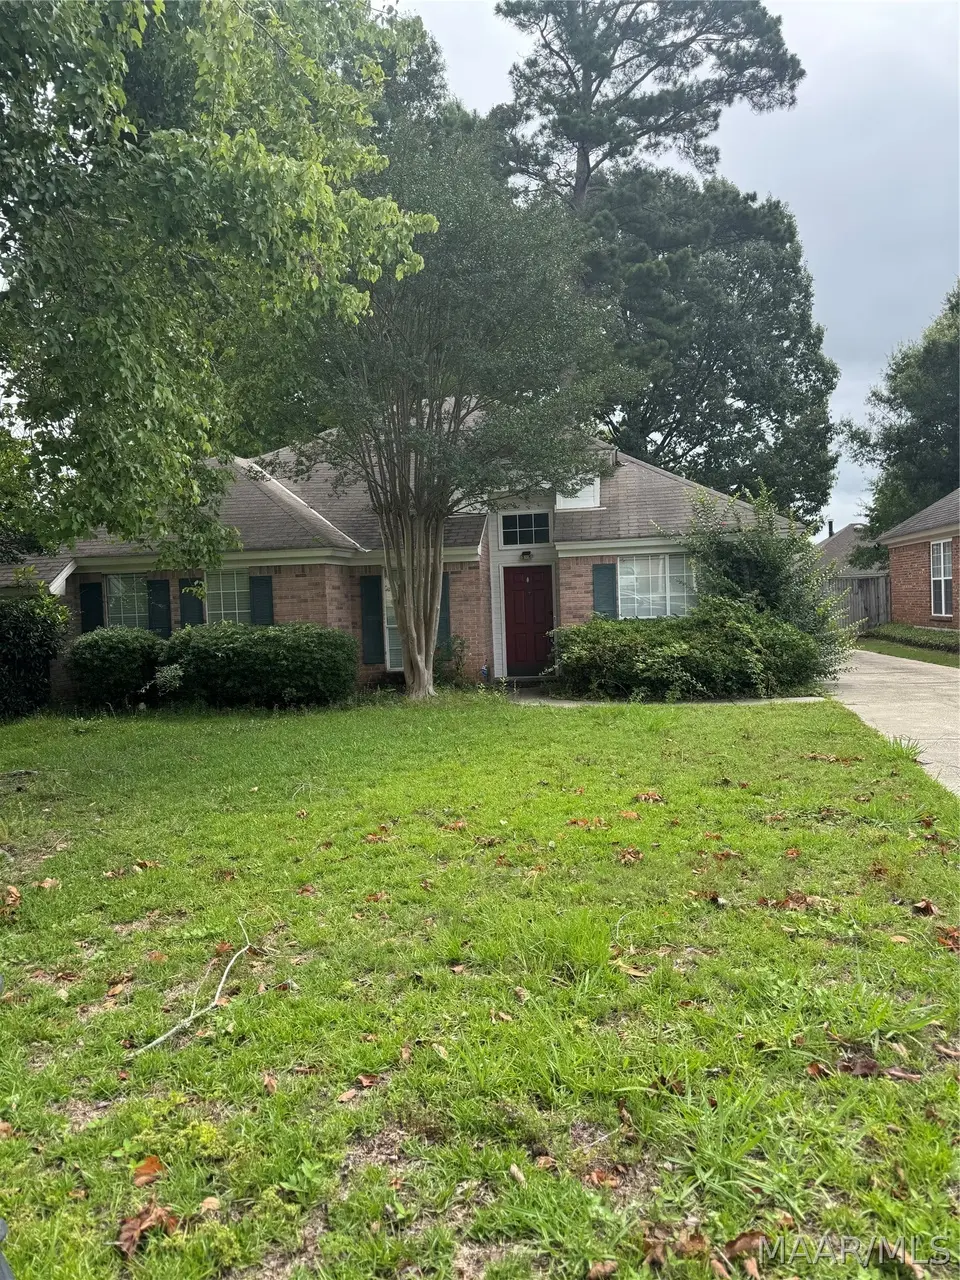
855 Autumn Ridge Rd · Montgomery, AL
Flood risk 1/10 · Minimal
- FEMA flood zone
- X (unshaded)
- Chance of flooding over 30 yrs
- 0.0%
- Est. flood insurance / yr
- $507 – $1,088
Fire risk 1/10 · Minimal
- Est. fire insurance / yr
- $916 – $1,700
Heat risk 8/10 · Major
- Hot days now (above 108°F)
- 7 days/yr
- Hot days in 30 yrs
- 20 days/yr
Wind risk 6/10 · Moderate
- Chance of severe wind over 30 yrs
- 76.0%
Air-quality risk 4/10 · Minor
- Unhealthy air days now
- 4 days/yr
- Unhealthy air days in 30 yrs
- 5 days/yr
Risk factors via First Street. Map © Google.
Why this score? — see what drove the D- grade
The composite is a weighted blend of 9 inputs, each scored 0–100. Each bar is that input's sub-score; the figure is the points it added to the 100-point composite (weight × sub-score).
- Cash flow +15.0/30.0
- ARV discount +5.2/15.0
- DSCR +4.6/10.0
- Rent growth +3.2/5.0
- Livability +3.2/5.0
- 1% rule +3.1/10.0
- Condition / age +2.5/5.0
- Schools +1.7/10.0
- Appreciation +0.0/10.0
$244,900
🖨 Deal sheet (PDF) 📄 Offer letter ✓ Due diligence
Listing remarks MLS
BEAUTIFUL HOME WITH GREAT FLOOR PLAN/MINUTES FROM MAXWELL AND I-85/HAS A SPACIOUS COVERED PATIO GREAT FOR ENTERTAINING/MATURE TREES/PRIVACY FENCE NEIGHBORHOOD LAKE WITH GAZEBO/THIS IS A MUST SEE!
Key facts
- Mature trees
- 8,712 sq ft lot
- Parking
Tags
Property features AI
Finance
- HOA & community: Homeowners association with an annual fee of $250 (fee details: see agent)
Exterior
- Parking: Driveway
- Security: Fire alarm
- Utilities: Natural gas available; Public water; Public sewer
- Home design: Single-story home; Brick and vinyl siding exterior; Slab foundation
- Construction: Built (year per public records); Brick construction; Vinyl siding
- Exterior features: Covered patio; Covered patio/porch; Fully fenced yard; Privacy fencing; Mature trees; City lot
Interior
- Kitchen: Dishwasher; Electric cooktop; Electric oven; Electric range; Disposal; Breakfast bar
- Bedrooms: Walk-in closet(s)
- Flooring: Carpet; Tile; Vinyl
- Bathrooms: 2 full bathrooms
- Heating & cooling: Central heating (electric, heat pump); Central air (electric, heat pump); Attic fan
- Interior features: Tray ceilings; High ceilings; Double vanity; Garden (Roman) tub; Separate shower; Linen closet; Pull-down attic stairs; Window treatments; Blinds; Breakfast bar
- Laundry & utility: Washer hookup; Dryer hookup; Gas water heater
Neighborhood map
What this means for you Summary
Snapshot
- This is a 3-bed/2.0-bath single-family listed at $245k.
Deal economics
- At list price, monthly cash flow is $74 ($890/yr) — positive.
- The deal already cash-flows at list — no discount required.
- To meet the 1% rule (rent ≥ 1% of price), the offer needs to be $198k (19.1% below list).
- Recommended offer: $198k (19.1% below list) — sets the bar for 1% rule.
Location & tenants
- Location reads 65/100 on livability (#138 in AL) — a middle-class / working-renter tenant base. Strengths: cost of living A+, housing A+; Watch: employment D, crime F, amenities D-.
- Montgomery County (urban): math 9% / reading 31% proficiency, ranked #106 of 129 in AL (top 82%) — low school quality limits family demand, transient renter base, plan for 1-2y turnover; 70% free/reduced lunch — lower-income household profile, screen leases tightly.
- Zoned schools: Halcyon Elementary School (math 8% / reading 31%, grade F, #477 of 627 statewide, top 76%, 615 students, 52% FRL); Park Crossing High School (math 12% / reading 27%, grade F, #169 of 305 statewide, top 59%, 906 students, 53% FRL) — zoned schools average 53% FRL vs 70% district-wide (17 pts lower); this property's tenant base skews higher-income than the district average.
- Market conditions: Rents rising (+3.0%/yr); 409 active listings in the ZIP; 14 comparable units currently listed for rent nearby; rentals at typical pace (median 23d on market — plan ~3-4 weeks tenant-placement turnaround); 460 units permitted in Montgomery County in 2024 (37 in 5+ unit buildings).
- This rent runs 32% of the median local income ($75k/yr) — at the standard rent-burdened threshold; future hikes will face affordability resistance.
Forward outlook
- Local home prices are declining (-3.0%/yr); year-one equity from $2k of loan paydown is wiped out by about $7k of value loss. Plan a longer hold.
- Montgomery County population projected to shrink 8% by 2050 — rents likely to lag national; underwrite the cash flow, not the appreciation.
Negotiation context
- It's been on market 20 days — a 2% lower offer ($241k) is reasonable based on typical stale-listing flexibility.
- 3 sale attempts since 27y ago with the ask held roughly flat each time — persistent listings suggest the price (not the market) is what's stuck; bring a comps-based counter.
- Current owner paid $134k; list at $245k implies a 83% gain — meaningful room to come down on a strong offer.
Risks & watch-outs
- Climate carrying-cost: major wind risk, 76% chance of damaging wind over 30y; extreme-heat days projected 7→20/yr by 2055 (HVAC capex compounding) — expect insurance premiums to compound above CPI over the hold.
Questions for the listing agent
- What does the HOA fee cover, when was the last increase, and are there any pending special assessments or reserve-fund shortfalls?
- Is there a deadline driving the sale (1031 exchange, divorce, estate, relocation)? That informs how much negotiation room exists.
- Crime grade is F in this area — have there been break-ins, vandalism, or insurance claims at this property in the last 3 years? What carrier currently insures it and at what premium?
- The area grade is low — what's the realistic commute time and amenity access for the typical tenant pool here? Any planned neighborhood developments (good or bad) we should know about?
- What's the average days-on-market for RENTAL listings here right now (not sales)? A rising rental-DOM trend means longer vacancies and softer asking-rent achievability than the comps imply.
- What's the recent tenant-quality profile in this submarket — average credit score on applications, eviction rate, late-payment / NSF rate, and stable-employment percentage? A property-management company in the area should have these aggregated.
- How much new for-sale + rental construction is in the pipeline within 1–3 miles? Heavy new supply typically softens prices + rents 12–24 months out; constrained supply supports both.
Investment metrics
- 1% rule
- 0.81% ✗
- Cap rate
- 6.66%
- Cash-on-cash
- 1.30%
- DSCR
- 1.06
- GRM
- 10.3
CMA / ARV
- ARV (on-the-fly)
- $232,995
- Comps found
- 12
Show comp detail 12 sales within ~0.75 mi
| Address | Dist | Beds/Ba | Sqft | Sold | Price | $/sf | Match |
|---|---|---|---|---|---|---|---|
| 7164 Breckenridge Dr | 0.23mi | 3/2.0 | 1,585 (0%) | 2mo | $225,000 | $142 | 87 |
| 7542 Pinnacle Pt | 0.23mi | 3/2.0 | 1,574 (-1%) | 2mo | $248,900 | $158 | 87 |
| 7233 Brampton Ln | 0.18mi | 3/2.0 | 1,529 (-4%) | 1mo | $200,000 | $131 | 85 |
| 7150 White Oak Ln | 0.22mi | 3/2.0 | 1,528 (-4%) | 1mo | $200,000 | $131 | 83 |
| 7136 Breckenridge Dr | 0.30mi | 3/2.0 | 1,544 (-3%) | 3mo | $190,000 | $123 | 79 |
| 406 Fieldstone Ct | 0.44mi | 3/2.0 | 1,563 (-1%) | 0mo | $239,000 | $153 | 77 |
| 7411 S Brampton Ct | 0.25mi | 3/2.0 | 1,502 (-5%) | 5mo | $212,999 | $142 | 76 |
| 7928 Copperfield Dr | 0.50mi | 3/2.0 | 1,544 (-3%) | 4mo | $142,000 | $92 | 69 |
| 7613 Preservation Park Dr | 0.44mi | 3/2.0 | 1,742 (+10%) | 2mo | $288,000 | $165 | 62 |
| 7841 Copperfield Dr | 0.50mi | 3/2.0 | 1,401 (-12%) | 2mo | $225,000 | $161 | 56 |
| 8206 Wexford Trce | 0.67mi | 3/2.0 | 1,461 (-8%) | 2mo | $215,000 | $147 | 54 |
| 8200 Wexford Trce | 0.67mi | 3/2.0 | 1,413 (-11%) | 2mo | $227,000 | $161 | 49 |
Match score weights: distance 35% · size 25% · config 20% · recency 20%. Top-matched comps best support the ARV.
Projected returns pro-forma
-3.0% appreciation · 2.99% rent growth · sell at horizon
- IRR
- -14.3%
- Equity multiple
- 0.49×
- Total profit
- $-35,076
- Equity at exit
- $36,515
- IRR
- -5.6%
- Equity multiple
- 0.64×
- Total profit
- $-24,928
- Equity at exit
- $21,174
Cash invested: $68,572 (down + closing). Projections, not guarantees.
Landlord ↔ Tenant lean methodology
- Overall (STATE)
- 90 Strongly Landlord-Friendly
- State Alabama
- 90 Strongly Landlord-Friendly · R+15
- County
- — inherits STATE
- City
- — inherits STATE
ZIP-level market 36117
- Home prices YoY
- -20.0%
- Rents YoY
- 3.0%
- Active inventory
- 409
- Price-to-rent
- 10.3×
Monthly cashflow live
- Estimated rent
- $1,980 high interval (Pro) →
- Mortgage (P&I)
- −$1,284
- Tax from tax record
- −$83 /mo · $995/yr
- Insurance
- −$102
- HOA
- −$21
- Vacancy / Maint / Mgmt
- −$416
- Net cashflow
- $74
Break-even live
Sensitivity live
| Price | -10% $213 | -5% $143 | +0% $74 | +5% $5 | +10% $-64 |
|---|---|---|---|---|---|
| Rent | -10% $-82 | -5% $-4 | +0% $74 | +5% $152 | +10% $231 |
| Rate | -1.0pp $197 | -0.5pp $136 | base $74 | +0.5pp $11 | +1.0pp $-54 |
UW: 25.0% down · 7.5% · 30yr · 1.5% tax · 5.0% vac · 8.0% maint · 8.0% mgmt
Financing live
Cash to close
- Down payment
- $61,225
- Closing costs
- $7,347
- Reserves months
- —
- Total cash needed
- —
Loan-product check · same deal, 3 products live
Conventional
25% down · 7.5% · 30yr
- Down + closing
- —
- Monthly P&I
- —
- Monthly cashflow
- —
- DSCR
- —
- Eligible?
- —
Personal DTI + credit; lowest rate.
DSCR
20% down · 8.5% · 30yr
- Down + closing
- —
- Monthly P&I
- —
- Monthly cashflow
- —
- DSCR
- —
- Eligible?
- —
No personal income docs; deal must DSCR.
Hard money
10% down · 12.0% · 12mo
- Down + closing
- —
- Monthly P&I
- —
- Monthly cashflow
- —
- DSCR
- —
- Eligible?
- —
Short-term bridge; refi at stabilization.
Rent comps 14 comps
| Address | Beds | Baths | Sqft | Rent | $/sqft | DOM | Units | Dist |
|---|---|---|---|---|---|---|---|---|
| 7448 Pinnacle Pt Montgomery, AL | 3.0 | 2.0 | 1581 | $2,000 | $1.27 | 45d | 1 | 0.19mi |
| 7528 Pinnacle Ct Montgomery, AL | 3.0 | 2.0 | 1607 | $1,850 | $1.15 | 45d | 1 | 0.23mi |
| 7136 Breckenridge Dr Montgomery, AL | 4.0 | 2.0 | 1544 | $1,970 | $1.28 | 45d | 1 | 0.30mi |
| 7117 Stamford Ct Montgomery, AL | 3.0 | 2.0 | 1527 | $1,700 | $1.11 | 15d | 1 | 0.38mi |
| 280 New Haven Blvd Montgomery, AL | 1.0–3.0 | 1.0–2.0 | 1175 | $1,714 | $1.46 | 15d | 18 | 0.65mi |
| 8850 Crosswind Cir Montgomery, AL | 1.0–3.0 | 1.0–2.0 | 1047 | $1,688 | $1.61 | 15d | 11 | 1.07mi |
| 113 Kentucky Oaks Montgomery, AL | 3.0 | 2.0 | 1246 | $1,600 | $1.28 | 23d | 1 | 1.11mi |
| 135 Hambleton Rd Montgomery, AL | 1.0–3.0 | 1.0–2.0 | 900 | $1,640 | $1.82 | 15d | 11 | 1.17mi |
| 8462 Eastchase Pkwy Montgomery, AL | 1.0–3.0 | 1.0–2.0 | 1015 | $1,796 | $1.77 | 15d | 17 | 1.23mi |
| 111 Arrowhead Dr Montgomery, AL | 3.0 | 2.0 | 2234 | $2,150 | $0.96 | 23d | 1 | 1.31mi |
| 6536 Monmouth Mews Unit 1533650P Montgomery, AL | 3.0 | 2.0 | 1894 | $4,714 | $2.49 | 23d | 1 | 1.32mi |
| 6509 Enfield Mews Unit 1471753P Montgomery, AL | 4.0 | 2.0 | 1969 | $4,686 | $2.38 | 15d | 1 | 1.35mi |
| 137 Hillabee Ct Montgomery, AL | 3.0 | 2.0 | 1881 | $1,900 | $1.01 | 45d | 1 | 1.45mi |
| 6637 Ridgeview Cir Montgomery, AL | 3.0 | 2.5 | 1458 | $1,700 | $1.17 | 23d | 1 | 1.48mi |
HOA detail
- Monthly dues
- $21 · $252/yr
Listing history 17 events
-
2026-06-21days on market $244,900 Active 20 DOM
-
2026-06-18days on market $244,900 Active 17 DOM
-
2026-06-17days on market $244,900 Active 16 DOM
-
2026-06-16days on market $244,900 Active 15 DOM
-
2026-06-15days on market $244,900 Active 14 DOM
-
2026-06-14days on market $244,900 Active 12 DOM
-
2026-06-13days on market $244,900 Active 11 DOM
-
2026-06-10days on market $244,900 Active 9 DOM
-
2026-06-09days on market $244,900 Active 8 DOM
-
2026-06-08days on market $244,900 Active 7 DOM
-
2026-06-07days on market $244,900 Active 6 DOM
-
2026-06-03days on market $244,900 Active 5 DOM
-
2026-06-02days on market $244,900 Active 4 DOM
-
2026-06-01days on market $244,900 Active 3 DOM
-
2026-05-31days on market $244,900 Active 2 DOM
-
2026-05-30remarks 686-char remark
-
2026-05-30$244,900 Active 1 DOM
ⓘ Source: listings_history table (triggers on properties + properties_extension) + one-shot
backfill from property_details.listing_events for pre-trigger history.
Tax reassessment forecast AL · Resets to sale price
- Current annual tax
- $995 · $83/mo
- Projected year-2 tax
- $1,004 · $84/mo
- Expected delta
- +$9/yr (+$1/mo · 0.9%)
ⓘ Screening estimate from a state-policy table — verify with the county assessor before closing.
Climate risk First Street
- Flood 1/10 Low FEMA zone X (unshaded) · 0% chance over 30 yrs
- Wildfire 1/10 Low
- Heat 8/10 Severe 7 d/yr ≥108°F today · 20 d/yr by 30 yrs out
- Wind 6/10 Major 76% chance of damaging wind over 30 yrs
- Air quality 4/10 Moderate 4 unhealthy d/yr today · 5 by 30 yrs out
Nearby sold comps map
Loading sold comps map…
Walkable amenities ~0.75 mi
Loading nearby amenities…
Taxation est. · year 1
- Rental income
- $23,763
- − Mortgage interest
- −$13,718
- − Property taxes
- −$995
- − Insurance
- −$1,224
- − Repairs & maintenance
- −$1,901
- − Management
- −$1,901
- − HOA
- −$252
- − Depreciation
- −$7,124
- Taxable loss
- −$3,353
- Est. tax savings @ 24.0%
- +$805
- After-tax cash flow
- $1,695/yr
For passive investors: Depreciation is non-cash, so a rental often shows a tax loss while cash-flowing — sheltering income. Rental losses are passive: they offset passive income freely, and up to $25,000/yr can offset ordinary (W-2) income if you actively participate and your MAGI is under $100k (phasing out to $0 by $150k); unused losses carry forward. On sale, claimed depreciation is recaptured at up to 25%, and gains may owe capital-gains tax (a 1031 exchange can defer both). Figures are a year-1 estimate at your 24.0% rate — not tax advice; consult a CPA.
Schools (NCES district)
- District
- Montgomery County
- NCES district ID
- 0102430
- Math proficiency
- 9% ▼ -21.00%
- Reading proficiency
- 31% ▼ -1.00%
- Median HH income
- $43,902
- Composite
- 17.24/100
- National rank
- #9093
- State rank
- #106 of 129 in AL
Livability — Montgomery
- Score
- 65/100
- State rank
- #138
- US rank
- #13416
Category grades
Schools grade is shown separately in the Schools card above.
Census & demographics
- Census place
- Montgomery, AL
- County
- Montgomery County · 190,016 people
- City population
- 175,913
- Metro
- Montgomery, AL
- Population (ZIP)
- 53,172
- Household income
- $74,720
- Rent vs Own
- Severe rent burden
- 1742.0
Population outlook (Montgomery County) Hauer SSP2
- Today (2025)
- 224,008 people
- By 2030
- 221,460 · -1.1%
- By 2040
- 214,179 · -4.4%
- By 2050
- 204,912 · -8.5%
- By 2075
- 177,821 · -20.6%
- By 2100
- 145,134 · -35.2%
Race, ethnicity, and origin ACS 2023
- Neighborhood character
- Diverse neighborhood (Simpson 0.60)
- Race & ethnicity
- Black 53% White 34% Asian 8% Two or more races 3% Hispanic / Latino 3%
- Common ancestry
- Italian 1% Slovak 1% Lithuanian 1%
- Foreign-born
- 9% · South Korea, Canada, China
- Languages at home
- 90% English-only · Korean 4% Spanish 3% Other Indo-European 1%
Political lean MEDSL · Montgomery
- 2024 margin
- Solid D (+30.7) · D 64.8% · R 34.1% · Other 1.1%
- 2008→2024 swing
- +11.5pp toward D · 2008: 19.2pp · 2024: 30.7pp
- All cycles
- 2024: D+30.7 2020: D+31.5 2016: D+26.2 2012: D+24.3 2008: D+19.2
Not yet ingested
- Civics
- —
Market trends
- HPI YoY
- ▼ -37.24%
- Current HPI
- 148.7728
- Rent YoY
- ▲ 2.99%
- Metro
- Montgomery, AL
- State GDP YoY
- ▲ 2.94%
- F500 in state
- 4
Industry mix (Fortune 500 HQ in AL)
| Industry | F500 HQs | Revenue |
|---|---|---|
| Financial Services | 1 | $8B |
|
||
| Healthcare | 1 | $5B |
|
||
Price history
+99.9% since first listed5 events — show timeline
- 2026-05-29 Listed $244,900 MAAR
- 2002-04-29 Sold (MLS) $133,500 MAAR
- 2002-03-01 Listed $133,900 MAAR
- 1999-11-12 Sold (MLS) $121,500 MAAR
- 1999-06-29 Listed $122,500 MAAR
Property tax history
+6.8%/yrLatest (2025): $995 · +7.0% YoY. Source: county tax records.
Cash-flow waterfall
monthlySold comps — $/sqft
last 12 mo · ≤1 miLoading sold comps…