 🔨 Auction
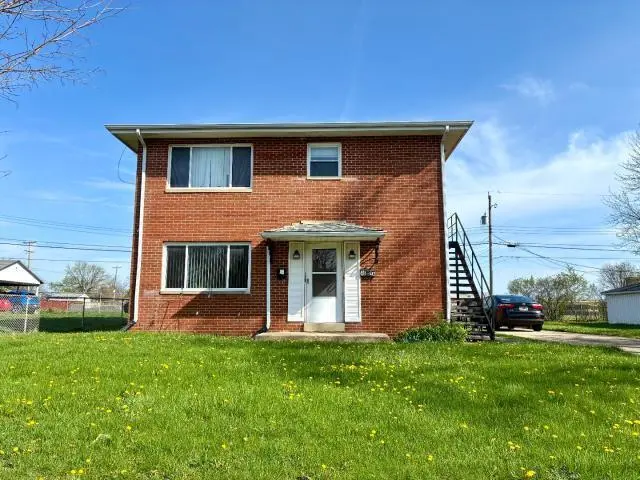
3696-3698 Arnelle Rd · Columbus, OH
Flood risk 1/10 · Minimal
- FEMA flood zone
- X (unshaded)
- Chance of flooding over 30 yrs
- 0.0%
- Est. flood insurance / yr
- $473 – $860
Fire risk 1/10 · Minimal
- Est. fire insurance / yr
- $713 – $1,323
Heat risk 4/10 · Minor
- Hot days now (above 102°F)
- 7 days/yr
- Hot days in 30 yrs
- 18 days/yr
Wind risk 2/10 · Minimal
- Chance of severe wind over 30 yrs
- 1.0%
Air-quality risk 2/10 · Minimal
- Unhealthy air days now
- 1 days/yr
- Unhealthy air days in 30 yrs
- 2 days/yr
Risk factors via First Street. Map © Google.
Why this score? — see what drove the D grade
The composite is a weighted blend of 9 inputs, each scored 0–100. Each bar is that input's sub-score; the figure is the points it added to the 100-point composite (weight × sub-score).
- Cash flow +13.2/30.0
- ARV discount +7.5/15.0
- DSCR +4.0/10.0
- Livability +4.0/5.0
- Schools +3.8/10.0
- 1% rule +3.7/10.0
- Condition / age +2.5/5.0
- Rent growth +2.3/5.0
- Appreciation +0.0/10.0
$1
🖨 Deal sheet 📄 Offer letter ✓ Due diligence
Multi-family units
County records classify this as Multi-Family (2-4 Unit). Listing-text estimate: 2 units. confirmed
Listing remarks
Court Ordered Sale by Private Selling Officer. Auction ends on May 5, 2026. All information we have on the property is included. We have no additional information, property condition is unknown. NO SHOWINGS, NO trespassing for any reason. Information is thought to be correct but not guaranteed. 5% Buyer Premium added to the high bid, $5,000 deposit is due within 24 hours of bidding end.
Key facts
- 8,712 sq ft lot
- Built 1967
Neighborhood map
What this means for you Summary
Snapshot
- This is a 2 × 2-bed/1-bath units multifamily listed at $1.
Deal economics
- At list price, monthly cash flow is $-5 ($-55/yr) — negative. Per door: $-2/mo.
- The deal already cash-flows at list — no discount required.
- Meets the 1% rule at list price ($2k rent vs $1).
- Cap rate 6.3% vs local median 3.8% in Columbus — top-decile yield for the area; either an underpriced asset or a hidden risk that comps aren't pricing in. Stress-test before assuming the spread holds.
Location & tenants
- Location reads 81/100 on livability (#97 in OH, #1,491 nationally) — a professional / high-income tenant draw. Strengths: commute A+, cost of living A+, housing A+; Watch: employment C-, crime F.
- South-Western City (suburban): math 40% / reading 48% proficiency, ranked #500 of 656 in OH (top 76%) — families likely to look elsewhere, expect single-tenant / working-renter base with shorter leases.
- Market conditions: Rents soft (-0.6%/yr); 192 active listings in the ZIP; 11 comparable units currently listed for rent nearby; rentals leasing fast (median 13d on market — plan ~1-2 weeks tenant-placement turnaround); 8,139 units permitted in Franklin County in 2024 (5,940 in 5+ unit buildings).
- At $2,341/mo this rent would consume 46% of the median local household income ($62k/yr) (locally 3284% of renters already pay >50% of income on rent) — very limited rent-growth headroom before tenants either downsize or default.
Forward outlook
- Local home prices are declining (-3.0%/yr); year-one equity from $2k of loan paydown is wiped out by about $8k of value loss. Plan a longer hold.
- Franklin County population projected at +34% by 2050 — long-run rental-demand tailwind backs the buy-and-hold thesis.
Negotiation context
- Only 1 days on market — expect competitive offers; lowballing is unlikely to land.
- 4 sale attempts since 17y ago with the ask held roughly flat each time — persistent listings suggest the price (not the market) is what's stuck; bring a comps-based counter.
Risks & watch-outs
- Watch-outs: property tax is 402408.0% of price.
Questions for the listing agent
- What do current leases actually rent for vs. the listed asking? Can we see a recent rent roll and the last 12 months of T-12 income?
- Can we see the unit-by-unit rent roll, current vacancy, and any below-market leases? What's the average tenancy length?
- What capital expenditures (roof, boiler, parking lot, exteriors) have been made in the last 5 years, and what's planned in the next 2?
- Built in 1967 — when were the roof, HVAC, electrical panel, plumbing, and water heater last replaced?
- Property tax is high relative to price — has the assessment been appealed recently, and will the sale trigger a re-assessment?
- Is there a deadline driving the sale (1031 exchange, divorce, estate, relocation)? That informs how much negotiation room exists.
- Crime grade is F in this area — have there been break-ins, vandalism, or insurance claims at this property in the last 3 years? What carrier currently insures it and at what premium?
- The area grade is low — what's the realistic commute time and amenity access for the typical tenant pool here? Any planned neighborhood developments (good or bad) we should know about?
- What's the average days-on-market for RENTAL listings here right now (not sales)? A rising rental-DOM trend means longer vacancies and softer asking-rent achievability than the comps imply.
- What's the recent tenant-quality profile in this submarket — average credit score on applications, eviction rate, late-payment / NSF rate, and stable-employment percentage? A property-management company in the area should have these aggregated.
- How much new apartment / multifamily construction is in the pipeline within 1–3 miles? Heavy new supply (>2% of stock underway) typically softens rents 12–24 months out; light construction supports rent growth.
Investment metrics
- 1% rule
- 0.87% ✗
- Cap rate
- 6.27%
- Cash-on-cash
- -0.07%
- DSCR
- 1.00
- GRM
- 9.5
CMA / ARV
- ARV (on-the-fly)
- $268,272
- Comps found
- 8
Show comp detail 8 sales within ~0.75 mi
| Address | Dist | Beds/Ba | Sqft | Sold | Price | $/sf | Match |
|---|---|---|---|---|---|---|---|
| 3696-3698 Arnelle Rd | 0.00mi | 4/— | 1,944 (0%) | 0mo | $159,810 | $82 | 100 |
| 1123-1125 Mccarley Dr W | 0.06mi | 4/— | 1,688 (-13%) | 16mo | $248,000 | $147 | 62 |
| 885-887 Derrer Rd | 0.38mi | 5/— (+1) | 1,667 (-14%) | 11mo | $230,000 | $138 | 45 |
| 639 Derrer Rd | 0.70mi | 4/— | 1,684 (-13%) | 4mo | $145,000 | $86 | 42 |
| 886 Derrer Rd | 0.39mi | 5/— (+1) | 1,667 (-14%) | 17mo | $216,900 | $130 | 39 |
| 3468 Race St | 0.74mi | 4/— | 1,706 (-12%) | 13mo | $265,000 | $155 | 34 |
| 3614 Eakin Rd | 0.55mi | 5/— (+1) | 1,673 (-14%) | 14mo | $207,000 | $124 | 34 |
| 3476-3478 Race St | 0.73mi | 4/— | 1,706 (-12%) | 15mo | $245,000 | $144 | 33 |
Match score weights: distance 35% · size 25% · config 20% · recency 20%. Top-matched comps best support the ARV.
Projected returns pro-forma
-3.0% appreciation · 0.0% rent growth · sell at horizon
- IRR
- -19.8%
- Equity multiple
- 0.33×
- Total profit
- $-50,588
- Equity at exit
- $40,000
- IRR
- -21.0%
- Equity multiple
- 0.06×
- Total profit
- $-70,797
- Equity at exit
- $23,195
Cash invested: $75,116 (down + closing). Projections, not guarantees.
Landlord ↔ Tenant lean methodology
- Overall (STATE)
- 73 Landlord-Friendly
- State Ohio
- 73 Landlord-Friendly · R+6
- County
- — inherits STATE
- City
- — inherits STATE
ZIP-level market 43228
- Rents YoY
- -0.6%
- Active inventory
- 192
Monthly cashflow live
- Estimated rent
- $2,341 high interval (Pro) →
- Mortgage (P&I)
- −$1,407
- Tax est. 1.5%
- −$335 /mo · $4,024/yr
- Insurance
- −$112
- HOA
- −$0
- Vacancy / Maint / Mgmt
- −$492
- Net cashflow
- $-5
Break-even live
2-unit breakdown (identical units grouped — click to expand)
| Units | Beds | Baths | Est. rent |
|---|---|---|---|
| 2× units | 2 | 1 | $2,342 |
| #1 | 2 | 1 | $1,171 |
| #2 | 2 | 1 | $1,171 |
| Total (2 units) | $2,341 | ||
UW: 25.0% down · 7.5% · 30yr · 1.5% tax · 5.0% vac · 8.0% maint · 8.0% mgmt
Financing live
Cash to close
- Down payment
- $67,068
- Closing costs
- $8,048
- Reserves months
- —
- Total cash needed
- —
Loan-product check · same deal, 3 products live
Conventional
25% down · 7.5% · 30yr
- Down + closing
- —
- Monthly P&I
- —
- Monthly cashflow
- —
- DSCR
- —
- Eligible?
- —
Personal DTI + credit; lowest rate.
DSCR
20% down · 8.5% · 30yr
- Down + closing
- —
- Monthly P&I
- —
- Monthly cashflow
- —
- DSCR
- —
- Eligible?
- —
No personal income docs; deal must DSCR.
Hard money
10% down · 12.0% · 12mo
- Down + closing
- —
- Monthly P&I
- —
- Monthly cashflow
- —
- DSCR
- —
- Eligible?
- —
Short-term bridge; refi at stabilization.
Rent comps 11 comps
| Address | Beds | Baths | Sqft | Rent | $/sqft | DOM | Units | Dist |
|---|---|---|---|---|---|---|---|---|
| 1369 Greenock Rd Columbus, OH | 4.0 | 2.5 | 1680 | $2,031 | $1.21 | 23d | 1 | 0.37mi |
| 3735 Gairlock Dr Columbus, OH | 3.0 | 2.0 | 1329 | $1,905 | $1.43 | 23d | 1 | 0.49mi |
| 1241 Riegelwood Ln Columbus, OH | 4.0 | 3.0 | 1868 | $2,480 | $1.33 | 2d | 1 | 0.52mi |
| 1433 Tall Meadows Dr Columbus, OH | 3.0 | 1.5 | 1428 | $1,995 | $1.40 | 12d | 1 | 0.76mi |
| 1634 Golden Cloud Ln Columbus, OH | 3.0 | 2.0 | 2015 | $2,101 | $1.04 | 44d | 1 | 0.76mi |
| 1602 Covina Dr Columbus, OH | 4.0 | 2.5 | 1808 | $2,450 | $1.36 | 10d | 1 | 1.21mi |
| 1983 Lake Crest Dr Grove City, OH | 3.0 | 2.0 | 1437 | $2,025 | $1.41 | 3d | 1 | 1.25mi |
| 4510 Switchback Trl Columbus, OH | 3.0 | 2.0 | 1244 | $2,170 | $1.74 | 4d | 1 | 1.25mi |
| 2060 Pentress Dr Grove City, OH | 3.0 | 2.5 | 1818 | $2,550 | $1.40 | 12d | 1 | 1.36mi |
| 3963 Genteel Dr Grove City, OH | 4.0 | 2.5 | 2034 | $2,540 | $1.25 | 2d | 1 | 1.48mi |
| 4573 Westport Rd Unit 4507-303 Columbus, OH | 4.0 | 2.0 | 1558 | $1,897 | $1.22 | 44d | 1 | 1.49mi |
Listing history 9 events
-
2026-05-05status Pending
-
2026-04-24historical
-
2026-04-24$1 Active
-
2015-01-22historical
-
2013-06-19historical
-
2013-06-19$72,000
-
2012-04-14$77,800
-
2009-12-28historical
-
2009-04-01$99,000
ⓘ Source: listings_history table (triggers on properties + properties_extension) + one-shot
backfill from property_details.listing_events for pre-trigger history.
Climate risk First Street
- Flood 1/10 Low FEMA zone X (unshaded) · 0% chance over 30 yrs
- Wildfire 1/10 Low
- Heat 4/10 Moderate 7 d/yr ≥102°F today · 18 d/yr by 30 yrs out
- Wind 2/10 Low 100% chance of damaging wind over 30 yrs
- Air quality 2/10 Low 1 unhealthy d/yr today · 2 by 30 yrs out
Nearby sold comps map
Loading sold comps map…
Walkable amenities ~0.75 mi
Loading nearby amenities…
Taxation est. · year 1
- Rental income
- $28,092
- − Mortgage interest
- −$15,027
- − Property taxes
- −$4,024
- − Insurance
- −$1,341
- − Repairs & maintenance
- −$2,247
- − Management
- −$2,247
- − Depreciation
- −$7,804
- Taxable loss
- −$4,600
- Est. tax savings @ 24.0%
- +$1,104
- After-tax cash flow
- $1,049/yr
For passive investors: Depreciation is non-cash, so a rental often shows a tax loss while cash-flowing — sheltering income. Rental losses are passive: they offset passive income freely, and up to $25,000/yr can offset ordinary (W-2) income if you actively participate and your MAGI is under $100k (phasing out to $0 by $150k); unused losses carry forward. On sale, claimed depreciation is recaptured at up to 25%, and gains may owe capital-gains tax (a 1031 exchange can defer both). Figures are a year-1 estimate at your 24.0% rate — not tax advice; consult a CPA.
Schools (NCES district)
- District
- South-Western City
- NCES district ID
- 3904480
- Math proficiency
- 40% ▼ -18.00%
- Reading proficiency
- 48% ▼ -10.00%
- Median HH income
- $51,689
- Composite
- 37.95/100
- National rank
- #4305
- State rank
- #500 of 656 in OH
Livability — Columbus
- Score
- 81/100
- State rank
- #97
- US rank
- #1491
Category grades
Schools grade is shown separately in the Schools card above.
Census & demographics
- Census place
- Columbus, OH
- County
- Franklin County · 1,351,780 people
- City population
- 612,189
- Metro
- Columbus, OH
- Population (ZIP)
- 59,077
- Household income
- $61,713
- Rent vs Own
- Severe rent burden
- 3284.0
Population outlook (Franklin County) Hauer SSP2
- Today (2025)
- 1,456,139 people
- By 2030
- 1,556,890 · +6.9%
- By 2040
- 1,757,349 · +20.7%
- By 2050
- 1,950,539 · +34.0%
- By 2075
- 2,376,171 · +63.2%
- By 2100
- 2,636,796 · +81.1%
Race, ethnicity, and origin ACS 2023
- Neighborhood character
- Diverse neighborhood (Simpson 0.64)
- Race & ethnicity
- White 54% Black 23% Hispanic / Latino 14% Two or more races 11% Asian 3%
- Hispanic origin (detail)
- Mexican 8% Dominican 1%
- Common ancestry
- Slovak 2% Italian 1% Romanian 1%
- Foreign-born
- 19% · Canada, Jamaica
- Languages at home
- 74% English-only · Spanish 12% Other Indo-European 1% Other Asian/Pacific 1%
Political lean MEDSL · Franklin
- 2024 margin
- Strong D (+28.4) · D 63.7% · R 35.3% · Other 1.0%
- 2008→2024 swing
- +7.7pp toward D · 2008: 20.7pp · 2024: 28.4pp
- All cycles
- 2024: D+28.4 2020: D+31.4 2016: D+25.9 2012: D+21.7 2008: D+20.7
Not yet ingested
- Civics
- —
Market trends
- HPI YoY
- ▼ -245.97%
- Current HPI
- 234.1992
- Rent YoY
- ▼ -0.63%
- Metro
- Columbus, OH
- State GDP YoY
- ▲ 1.98%
- F500 in state
- 48
Industry mix (Fortune 500 HQ in OH)
| Industry | F500 HQs | Revenue |
|---|---|---|
| Insurance | 3 | $145B |
|
||
| Industrial Machinery | 3 | $49B |
|
||
| Financial Services | 3 | $24B |
|
||
| Consumer Goods | 2 | $93B |
|
||
| Aerospace / Defense | 2 | $47B |
|
||
| Utilities | 2 | $33B |
|
||
Price history
-27.3% since first listed9 events — show timeline
- 2026-05-05 Pending — CBRMLS
- 2026-04-24 Listed $1 CBRMLS
- 2026-04-24 Listing Removed — CBRMLS
- 2015-01-22 Listing Removed — CBRMLS
- 2013-06-19 Listed $72,000 CBRMLS
- 2013-06-19 Listing Removed — CBRMLS
- 2012-04-14 Listed $77,800 CBRMLS
- 2009-12-28 Listing Removed — CBRMLS
- 2009-04-01 Listed $99,000 CBRMLS
Property tax history
+3.3%/yrLatest (2024): $2,918 · -9.7% YoY. Source: county tax records.
Cash-flow waterfall
monthlySold comps — $/sqft
last 12 mo · ≤1 miLoading sold comps…