 Duplex
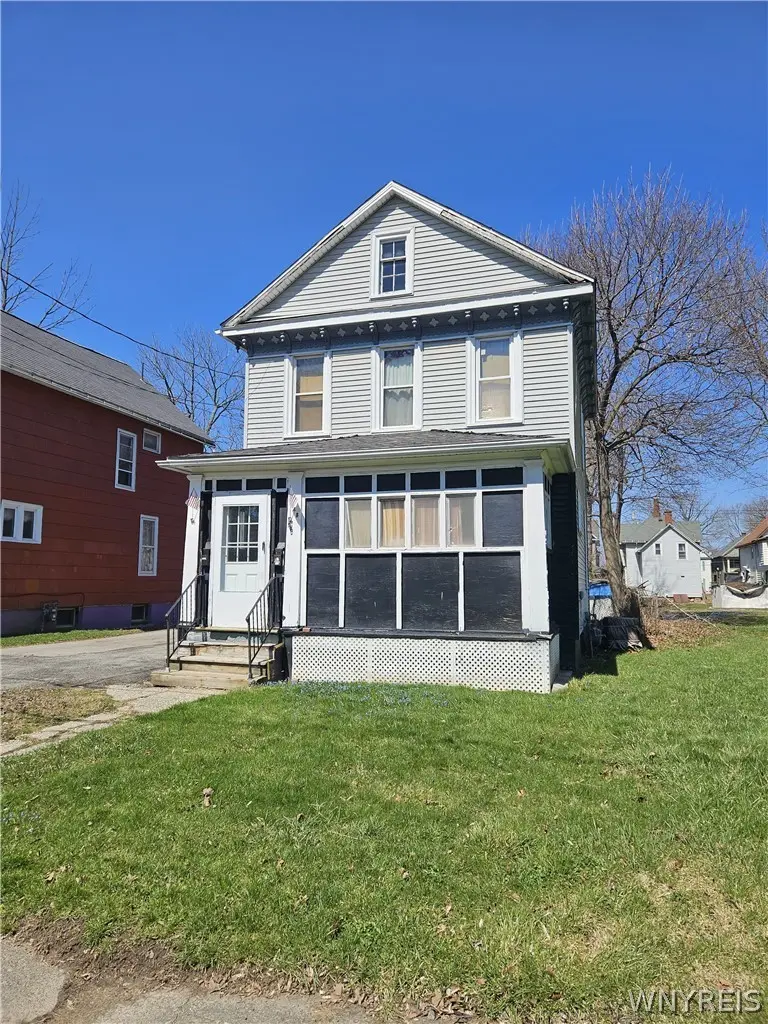
1648 Cleveland Ave · Niagara Falls, NY
Flood risk 1/10 · Minimal
- FEMA flood zone
- X (unshaded)
- Chance of flooding over 30 yrs
- 0.0%
- Est. flood insurance / yr
- $473 – $860
Fire risk 1/10 · Minimal
- Est. fire insurance / yr
- $691 – $1,283
Heat risk 2/10 · Minimal
- Hot days now (above 94°F)
- 7 days/yr
- Hot days in 30 yrs
- 15 days/yr
Wind risk 1/10 · Minimal
- Chance of severe wind over 30 yrs
- —
Air-quality risk 3/10 · Minor
- Unhealthy air days now
- 2 days/yr
- Unhealthy air days in 30 yrs
- 3 days/yr
Risk factors via First Street. Map © Google.
Why this score? — see what drove the B grade
The composite is a weighted blend of 9 inputs, each scored 0–100. Each bar is that input's sub-score; the figure is the points it added to the 100-point composite (weight × sub-score).
- Cash flow +30.0/30.0
- ARV discount +11.3/15.0
- 1% rule +10.0/10.0
- DSCR +10.0/10.0
- Livability +3.0/5.0
- Rent growth +2.5/5.0
- Schools +2.5/10.0
- Condition / age +2.5/5.0
- Appreciation +0.0/10.0
$118,888
🖨 Deal sheet (PDF) 📄 Offer letter ✓ Due diligence
Multi-family units
County records classify this as Multi-Family (2-4 Unit). Listing-text estimate: 2 units. confirmed
Listing remarks MLS
Welcome to 1648 Cleveland Avenue, a classic two-story, two-family home perfectly positioned for both comfortable living and smart investing. This home offers an excellent opportunity for owner occupants or investors alike. Live in the spacious 2-bedroom lower unit while generating rental income from the separate 2-bedroom upper unit. The home features a convenient layout with private entrances for each level, making it ideal for multi-generational living or supplemental income. Step outside to enjoy the perks of this prime location as you're just a short walk to public transportation, Hyde Park, and a variety of shopping and dining options. The expansive backyard provides plenty of space for a gardener's canvas or outdoor enjoyment. No need to worry about parking as the private driveway comfortably fits two cars for off-street parking. Please note, property is being sold "as is" and tax records indicate a garage but there is no garage. This property is currently owner occupied and therefore there is no income to show.
Key facts
- Off street parking
- Private entrances
- Two family home
Tags
Neighborhood map
What this means for you Summary
Snapshot
- This is a 2 × 2-bed/1.0-bath units multifamily listed at $119k.
Deal economics
- At list price, monthly cash flow is $1k ($14k/yr) — positive. Per door: $588/mo.
- The deal already cash-flows at list — no discount required.
- Meets the 1% rule at list price ($3k rent vs $119k).
- Recommended offer: $112k (6.0% below list) — sets the bar for market timing.
- Cap rate 18.2% vs local median 7.5% in Niagara Falls — top-decile yield for the area; either an underpriced asset or a hidden risk that comps aren't pricing in. Stress-test before assuming the spread holds.
Location & tenants
- Location reads 60/100 on livability (#956 in NY) — a middle-class / working-renter tenant base. Strengths: cost of living A+, housing A+; Watch: crime F, amenities F, commute F.
- Niagara Falls City School District (urban): math 26% / reading 34% proficiency, ranked #578 of 590 in NY (top 98%) — families likely to look elsewhere, expect single-tenant / working-renter base with shorter leases; 66% free/reduced lunch — lower-income household profile, screen leases tightly.
- Zoned schools: Harry F Abate Elementary School (math 16% / reading 32%, grade F, #1,909 of 2,108 statewide, top 91%, 695 students, 82% FRL); Gaskill Preparatory School (math 10% / reading 22%, grade F, #702 of 729 statewide, top 96%, 500 students, 78% FRL); Niagara Falls High School (math 75% / reading 92%, grade A, #409 of 1,100 statewide, top 39%, 2,139 students, 71% FRL).
- Market conditions: 142 active listings in the ZIP; 10 comparable units currently listed for rent nearby; rentals at typical pace (median 25d on market — plan ~3-4 weeks tenant-placement turnaround); 40% of comp listings sitting > 30 days — soft ceiling on asking rent; 167 units permitted in Niagara County in 2024 (0 in 5+ unit buildings).
- At $2,540/mo this rent would consume 60% of the median local household income ($51k/yr) (locally 1095% of renters already pay >50% of income on rent) — very limited rent-growth headroom before tenants either downsize or default.
Forward outlook
- Local home prices are declining (-3.0%/yr); year-one equity from $822 of loan paydown is wiped out by about $4k of value loss. Plan a longer hold.
- Niagara County population projected at -19% by 2050 — secular population decline; favor cash flow + early exit over multi-decade hold.
- At projected returns (-3.0% appreciation + 3.0% rent growth), your $33k cash investment doubles in ~3 years — after that, you're playing with house money.
Negotiation context
- It's been on market 72 days — a 6% lower offer ($112k) is reasonable based on typical stale-listing flexibility.
- 2 sale attempts since 10y ago with the ask held roughly flat each time — persistent listings suggest the price (not the market) is what's stuck; bring a comps-based counter.
- Current owner paid $35k; list at $119k implies a 241% gain — meaningful room to come down on a strong offer.
Risks & watch-outs
- Watch-outs: built in 1910 — expect roof / HVAC / electrical / plumbing capex.
Questions for the listing agent
- It's been on market 72 days. Have you received any prior offers? Is the seller open to a 6% concession, seller financing, or rate buy-down credit?
- Can we see the unit-by-unit rent roll, current vacancy, and any below-market leases? What's the average tenancy length?
- What capital expenditures (roof, boiler, parking lot, exteriors) have been made in the last 5 years, and what's planned in the next 2?
- Built in 1910 — when were the roof, HVAC, electrical panel, plumbing, and water heater last replaced?
- Why hasn't it sold? Are there any deal-killer items the seller is aware of (foundation, flood, title, zoning, code violations)?
- Is there a deadline driving the sale (1031 exchange, divorce, estate, relocation)? That informs how much negotiation room exists.
- Schools are F-rated, which usually means shorter tenancies and higher turnover. Who's the typical renter profile here, and what's been the actual vacancy rate?
- Crime grade is F in this area — have there been break-ins, vandalism, or insurance claims at this property in the last 3 years? What carrier currently insures it and at what premium?
- What's the average days-on-market for RENTAL listings here right now (not sales)? A rising rental-DOM trend means longer vacancies and softer asking-rent achievability than the comps imply.
- What's the recent tenant-quality profile in this submarket — average credit score on applications, eviction rate, late-payment / NSF rate, and stable-employment percentage? A property-management company in the area should have these aggregated.
- How much new apartment / multifamily construction is in the pipeline within 1–3 miles? Heavy new supply (>2% of stock underway) typically softens rents 12–24 months out; light construction supports rent growth.
Investment metrics
- 1% rule
- 2.14% ✓
- Cap rate
- 18.16%
- Cash-on-cash
- 42.37%
- DSCR
- 2.89
- GRM
- 3.9
CMA / ARV
- ARV (median comp)
- $129,901
- List price
- $118,888
- Delta
- -8.48%
- Verdict
- FAIR
- Comps
- 20 within 1.0 mi
Show comp detail 12 sales within ~0.75 mi
| Address | Dist | Beds/Ba | Sqft | Sold | Price | $/sf | Match |
|---|---|---|---|---|---|---|---|
| 1888 Weston Ave | 0.25mi | 4/2.0 | 1,512 (+12%) | 4mo | $30,000 | $20 | 66 |
| 2630 North Ave | 0.60mi | 4/2.0 | 1,362 (+0%) | 9mo | $150,000 | $110 | 64 |
| 2234 Willow Ave | 0.41mi | 3/2.0 (-1) | 1,386 (+2%) | 11mo | $105,000 | $76 | 63 |
| 1208 17th St | 0.47mi | 3/2.0 (-1) | 1,378 (+2%) | 12mo | $92,500 | $67 | 60 |
| 1840 Jerauld Ave | 0.29mi | 4/2.0 | 1,518 (+12%) | 10mo | $80,500 | $53 | 58 |
| 1519 Whitney Ave | 0.46mi | 3/2.0 (-1) | 1,408 (+4%) | 12mo | $110,000 | $78 | 57 |
| 1816 Willow Ave | 0.30mi | 4/2.0 | 1,496 (+10%) | 15mo | $110,000 | $74 | 56 |
| 2260 Weston Ave | 0.37mi | 3/2.0 (-1) | 1,540 (+14%) | 3mo | $135,000 | $88 | 52 |
| 746 17th St | 0.73mi | 4/2.0 | 1,475 (+9%) | 1mo | $72,000 | $49 | 51 |
| 2236 Linwood Ave | 0.38mi | 3/2.0 (-1) | 1,544 (+14%) | 8mo | $163,000 | $106 | 48 |
| 1119 15th St | 0.52mi | 4/2.0 | 1,496 (+10%) | 15mo | $128,000 | $86 | 46 |
| 2906 Michigan Ave | 0.72mi | 3/2.0 (-1) | 1,320 (-3%) | 23mo | $80,000 | $61 | 38 |
Match score weights: distance 35% · size 25% · config 20% · recency 20%. Top-matched comps best support the ARV.
Projected returns pro-forma
-3.0% appreciation · 3.0% rent growth · sell at horizon
- IRR
- 39.1%
- Equity multiple
- 2.67×
- Total profit
- $55,631
- Equity at exit
- $17,727
- IRR
- 45.5%
- Equity multiple
- 5.36×
- Total profit
- $145,006
- Equity at exit
- $10,279
Cash invested: $33,289 (down + closing). Projections, not guarantees.
Landlord ↔ Tenant lean methodology
- Overall (STATE)
- 15 Strongly Tenant-Friendly
- State New York
- 15 Strongly Tenant-Friendly · D+10
- County
- — inherits STATE
- City
- — inherits STATE
ZIP-level market 14305
- Home prices YoY
- -10.9%
- Active inventory
- 142
- Price-to-rent
- 7.8×
Monthly cashflow live
- Estimated rent
- $2,540 high interval (Pro) →
- Mortgage (P&I)
- −$623
- Tax from tax record
- −$158 /mo · $1,900/yr
- Insurance
- −$50
- HOA
- −$0
- Vacancy / Maint / Mgmt
- −$533
- Net cashflow
- $1,175
Break-even live
Sensitivity live
| Price | -10% $1,243 | -5% $1,209 | +0% $1,175 | +5% $1,142 | +10% $1,108 |
|---|---|---|---|---|---|
| Rent | -10% $975 | -5% $1,075 | +0% $1,175 | +5% $1,276 | +10% $1,376 |
| Rate | -1.0pp $1,235 | -0.5pp $1,205 | base $1,175 | +0.5pp $1,144 | +1.0pp $1,113 |
2-unit breakdown (identical units grouped — click to expand)
| Units | Beds | Baths | Est. rent |
|---|---|---|---|
| 2× units | 2 | 1 | $2,540 |
| #1 | 2 | 1 | $1,270 |
| #2 | 2 | 1 | $1,270 |
| Total (2 units) | $2,540 | ||
UW: 25.0% down · 7.5% · 30yr · 1.5% tax · 5.0% vac · 8.0% maint · 8.0% mgmt
Financing live
Cash to close
- Down payment
- $29,722
- Closing costs
- $3,567
- Reserves months
- —
- Total cash needed
- —
Loan-product check · same deal, 3 products live
Conventional
25% down · 7.5% · 30yr
- Down + closing
- —
- Monthly P&I
- —
- Monthly cashflow
- —
- DSCR
- —
- Eligible?
- —
Personal DTI + credit; lowest rate.
DSCR
20% down · 8.5% · 30yr
- Down + closing
- —
- Monthly P&I
- —
- Monthly cashflow
- —
- DSCR
- —
- Eligible?
- —
No personal income docs; deal must DSCR.
Hard money
10% down · 12.0% · 12mo
- Down + closing
- —
- Monthly P&I
- —
- Monthly cashflow
- —
- DSCR
- —
- Eligible?
- —
Short-term bridge; refi at stabilization.
Rent comps 10 comps
| Address | Beds | Baths | Sqft | Rent | $/sqft | DOM | Units | Dist |
|---|---|---|---|---|---|---|---|---|
| 1001 17th St Niagara Falls, NY | 3.0 | 1.0 | 1152 | $1,800 | $1.56 | 25d | 1 | 0.59mi |
| 2020 Forest Ave Niagara Falls, NY | 4.0 | 2.0 | 1600 | $1,500 | $0.94 | 18d | 1 | 0.64mi |
| 784 15th St Niagara Falls, NY | 3.0 | 1.5 | 1380 | $1,350 | $0.98 | 5d | 1 | 0.66mi |
| 754 15th St Niagara Falls, NY | 3.0 | 1.0 | 990 | $1,100 | $1.11 | 25d | 1 | 0.73mi |
| 642 Ashland Ave Niagara Falls, NY | 3.0 | 1.0 | 1238 | $1,100 | $0.89 | 5d | 1 | 0.96mi |
| 3025 Macklem Ave Niagara Falls, NY | 4.0 | 1.5 | 1750 | $2,200 | $1.26 | 45d | 1 | 1.00mi |
| 724 Augustus Pl Niagara Falls, NY | 4.0 | 1.0 | 1200 | $1,500 | $1.25 | 45d | 1 | 1.09mi |
| 1427 Fort Ave Unit 2 Niagara Falls, NY | 3.0 | 1.0 | 1058 | $950 | $0.90 | 45d | 1 | 1.20mi |
| 420 25th St Niagara Falls, NY | 3.0 | 1.0 | 1101 | $1,500 | $1.36 | 45d | 1 | 1.32mi |
| 2727 Monroe Ave Niagara Falls, NY | 3.0 | 1.0 | 960 | $1,500 | $1.56 | 12d | 1 | 1.40mi |
Listing history 19 events
-
2026-06-21days on market $118,888 Active 72 DOM
-
2026-06-18days on market $118,888 Active 69 DOM
-
2026-06-17days on market $118,888 Active 68 DOM
-
2026-06-16days on market $118,888 Active 67 DOM
-
2026-06-15days on market $118,888 Active 66 DOM
-
2026-06-13days on market $118,888 Active 64 DOM
-
2026-06-13days on market $118,888 Active 63 DOM
-
2026-06-10days on market $118,888 Active 61 DOM
-
2026-06-09days on market $118,888 Active 60 DOM
-
2026-06-08days on market $118,888 Active 59 DOM
-
2026-06-07days on market $118,888 Active 58 DOM
-
2026-06-03days on market $118,888 Active 54 DOM
-
2026-06-02days on market $118,888 Active 53 DOM
-
2026-06-01days on market $118,888 Active 52 DOM
-
2026-05-31days on market $118,888 Active 51 DOM
-
2026-04-10$118,888 Active 1043-char remark
Show marketing remark (1043 chars)
Welcome to 1648 Cleveland Avenue, a classic two-story, two-family home perfectly positioned for both comfortable living and smart investing. This home offers an excellent opportunity for owner occupants or investors alike. Live in the spacious 2-bedroom lower unit while generating rental income from the separate 2-bedroom upper unit. The home features a convenient layout with private entrances for each level, making it ideal for multi-generational living or supplemental income. Step outside to enjoy the perks of this prime location as you're just a short walk to public transportation, Hyde Park, and a variety of shopping and dining options. The expansive backyard provides plenty of space for a gardener's canvas or outdoor enjoyment. No need to worry about parking as the private driveway comfortably fits two cars for off-street parking. Please note, property is being sold "as is" and tax records indicate a garage but there is no garage. This property is currently owner occupied and therefore there is no income to show.
-
2017-06-30soldstatus $34,900 Closed Sale or Rented 63-char remark
Show marketing remark (63 chars)
Vinyl sided 2 family with separate utilities is priced to sell!
-
2017-04-13status Pending Sale 63-char remark
Show marketing remark (63 chars)
Vinyl sided 2 family with separate utilities is priced to sell!
-
2016-11-04$34,900 Active 63-char remark
Show marketing remark (63 chars)
Vinyl sided 2 family with separate utilities is priced to sell!
ⓘ Source: listings_history table (triggers on properties + properties_extension) + one-shot
backfill from property_details.listing_events for pre-trigger history.
Tax reassessment forecast NY · Partial reset (capped growth)
- Current annual tax
- $1,900 · $158/mo
- Projected year-2 tax
- $1,955 · $163/mo
- Expected delta
- +$54/yr (+$5/mo · 2.9%)
ⓘ Screening estimate from a state-policy table — verify with the county assessor before closing.
Climate risk First Street
- Flood 1/10 Low FEMA zone X (unshaded) · 0% chance over 30 yrs
- Wildfire 1/10 Low
- Heat 2/10 Low 7 d/yr ≥94°F today · 15 d/yr by 30 yrs out
- Wind 1/10 Low
- Air quality 3/10 Moderate 2 unhealthy d/yr today · 3 by 30 yrs out
Nearby sold comps map
Loading sold comps map…
Walkable amenities ~0.75 mi
Loading nearby amenities…
Taxation est. · year 1
- Rental income
- $30,480
- − Mortgage interest
- −$6,660
- − Property taxes
- −$1,900
- − Insurance
- −$594
- − Repairs & maintenance
- −$2,438
- − Management
- −$2,438
- − Depreciation
- −$3,459
- Taxable income
- $12,990
- Est. tax owed @ 24.0%
- −$3,118
- After-tax cash flow
- $10,985/yr
For passive investors: Depreciation is non-cash, so a rental often shows a tax loss while cash-flowing — sheltering income. Rental losses are passive: they offset passive income freely, and up to $25,000/yr can offset ordinary (W-2) income if you actively participate and your MAGI is under $100k (phasing out to $0 by $150k); unused losses carry forward. On sale, claimed depreciation is recaptured at up to 25%, and gains may owe capital-gains tax (a 1031 exchange can defer both). Figures are a year-1 estimate at your 24.0% rate — not tax advice; consult a CPA.
Schools (NCES district)
- District
- Niagara Falls City School District
- NCES district ID
- 3620820
- Math proficiency
- 26% ▼ -10.00%
- Reading proficiency
- 34% ▲ 3.00%
- Median HH income
- $32,488
- Composite
- 24.5/100
- National rank
- #7655
- State rank
- #578 of 590 in NY
Livability — Niagara Falls
- Score
- 60/100
- State rank
- #956
- US rank
- #18749
Category grades
Schools grade is shown separately in the Schools card above.
Census & demographics
- Census place
- Niagara Falls, NY
- County
- Niagara County · 157,377 people
- City population
- 62,983
- Metro
- Buffalo-Cheektowaga, NY
- Population (ZIP)
- 16,696
- Household income
- $51,004
- Rent vs Own
- Severe rent burden
- 1095.0
Population outlook (Niagara County) Hauer SSP2
- Today (2025)
- 204,149 people
- By 2030
- 197,900 · -3.1%
- By 2040
- 182,239 · -10.7%
- By 2050
- 165,198 · -19.1%
- By 2075
- 129,416 · -36.6%
- By 2100
- 96,222 · -52.9%
Race, ethnicity, and origin ACS 2023
- Neighborhood character
- Diverse neighborhood (Simpson 0.63)
- Race & ethnicity
- White 55% Black 24% Two or more races 13% Hispanic / Latino 8% Asian 1% Native American 1%
- Hispanic origin (detail)
- Puerto Rican 4%
- Common ancestry
- Romanian 6% Slovak 2% Lithuanian 2%
- Foreign-born
- 6% · Canada, Jamaica
- Languages at home
- 93% English-only · Spanish 4% Other Indo-European 1%
Political lean MEDSL · Niagara
- 2024 margin
- R (+14.9) · D 42.5% · R 57.5%
- 2008→2024 swing
- -15.9pp toward R · 2008: 1.0pp · 2024: -14.9pp
- All cycles
- 2024: R+14.9 2020: R+9.7 2016: R+19.0 2012: D+0.6 2008: D+1.0
Not yet ingested
- Civics
- —
Market trends
- HPI YoY
- ▼ -43.08%
- Current HPI
- 350.8741
- Rent YoY
- —
- Metro
- Buffalo-Cheektowaga, NY
- State GDP YoY
- ▲ 2.60%
- F500 in state
- 92
Industry mix (Fortune 500 HQ in NY)
| Industry | F500 HQs | Revenue |
|---|---|---|
| Financial Services | 10 | $950B |
|
||
| Consumer Goods | 9 | $162B |
|
||
| Insurance | 4 | $225B |
|
||
| Telecommunications | 2 | $144B |
|
||
| Pharmaceuticals | 2 | $112B |
|
||
| Media / Entertainment | 2 | $69B |
|
||
Price history
+240.7% since first listed4 events — show timeline
- 2026-04-10 Listed $118,888 WNYREIS
- 2017-06-30 Sold (MLS) $34,900 WNYREIS
- 2017-04-13 Pending — WNYREIS
- 2016-11-04 Listed $34,900 WNYREIS
Property tax history
+22.9%/yrLatest (2025): $1,900 · +15.0% YoY. Source: county tax records.
Cash-flow waterfall
monthlySold comps — $/sqft
last 12 mo · ≤1 miLoading sold comps…