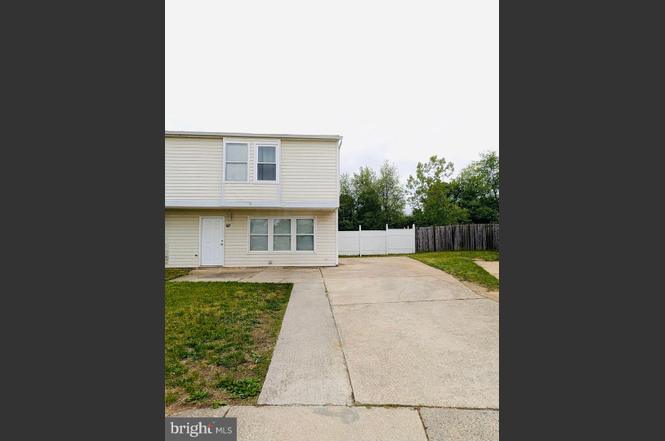
60 Farmhouse Rd · Sicklerville, NJ
Flood risk 1/10 · Minimal
- FEMA flood zone
- X (unshaded)
- Chance of flooding over 30 yrs
- 0.0%
- Est. flood insurance / yr
- $507 – $1,088
Fire risk 2/10 · Minimal
- Est. fire insurance / yr
- $526 – $976
Heat risk 7/10 · Major
- Hot days now (above 103°F)
- 7 days/yr
- Hot days in 30 yrs
- 16 days/yr
Wind risk 6/10 · Moderate
- Chance of severe wind over 30 yrs
- 61.0%
Air-quality risk 3/10 · Minor
- Unhealthy air days now
- 2 days/yr
- Unhealthy air days in 30 yrs
- 4 days/yr
Risk factors via First Street. Map © Google.
Why this score? — see what drove the C+ grade
The composite is a weighted blend of 9 inputs, each scored 0–100. Each bar is that input's sub-score; the figure is the points it added to the 100-point composite (weight × sub-score).
- Cash flow +21.9/30.0
- ARV discount +15.0/15.0
- DSCR +7.0/10.0
- 1% rule +6.4/10.0
- Rent growth +3.4/5.0
- Schools +2.6/10.0
- Livability +2.5/5.0
- Condition / age +2.5/5.0
- Appreciation +0.0/10.0
$240,000
🖨 Deal sheet 📄 Offer letter ✓ Due diligence
Listing remarks MLS
Located in The Fields is this semi-attached twin home. Living room is open to the dining area. Kitchen and large family room complete the first floor. Upstairs are the three bedrooms and full bath. This is a Fannie Mae HomePath property.
Key facts
- 4 parking spots
- Built 1979
- Listed 42 days
Property features AI
Exterior
- Parking: Driveway parking (4 spaces); Total of 4 garage/parking spaces
- Utilities: Public water; Public sewer; Electric cooling; Natural gas for heating and hot water
- Home design: Semi-detached property; Finished above-grade living area (per assessor)
- Construction: Vinyl siding; Block foundation; Other structures noted above and below grade; Pets allowed (cats and dogs permitted)
- Exterior features: Wood fencing; Lot dimensions approximately 31.00 x 166.00; Not in a federal flood zone
Interior
- Kitchen: Kitchen (appliances not specified)
- Bedrooms: 3 bedrooms on the first upper level; Rooms include: Bedroom 1, Bedroom 2, Bedroom 3, Bonus Room
- Bathrooms: One full bathroom on upper level; One half bathroom on main level
- Heating & cooling: Forced air heating (natural gas); Central air conditioning (electric); Natural gas hot water
- Interior features: 8 total rooms; No basement; 32"+ wide doors (accessible features)
- Laundry & utility: Laundry present (type not specified)
Neighborhood map
What this means for you Summary
Snapshot
- This is a 3-bed/1.5-bath townhouse listed at $240k.
Deal economics
- At list price, monthly cash flow is $379 ($5k/yr) — positive.
- The deal already cash-flows at list — no discount required.
- Meets the 1% rule at list price ($3k rent vs $240k).
- Recommended offer: $233k (3.0% below list) — sets the bar for market timing.
- Cap rate 8.2% vs local median 4.7% in Sicklerville — top-decile yield for the area; either an underpriced asset or a hidden risk that comps aren't pricing in. Stress-test before assuming the spread holds.
Location & tenants
- Location reads: area grade C — affects rentability + tenant quality, not the cash-flow math above.
- Gloucester Township Public Schools (suburban): math 14% / reading 41% proficiency, ranked #351 of 472 in NJ (top 74%) — low school quality limits family demand, transient renter base, plan for 1-2y turnover.
- Market conditions: Rents rising (+3.4%/yr); 329 active listings in the ZIP; 8 comparable units currently listed for rent nearby; rentals leasing fast (median 6d on market — plan ~1-2 weeks tenant-placement turnaround); solid renter incomes; 1,018 units permitted in Camden County in 2024 (509 in 5+ unit buildings).
- This rent runs 31% of the median local income ($106k/yr) — at the standard rent-burdened threshold; future hikes will face affordability resistance.
Forward outlook
- Local home prices are declining (-3.0%/yr); year-one equity from $2k of loan paydown is wiped out by about $7k of value loss. Plan a longer hold.
- Camden County population projected to shrink 8% by 2050 — rents likely to lag national; underwrite the cash flow, not the appreciation.
Negotiation context
- It's been on market 42 days — a 3% lower offer ($233k) is reasonable based on typical stale-listing flexibility.
- 7 sale attempts since 18y ago with the ask held roughly flat each time — persistent listings suggest the price (not the market) is what's stuck; bring a comps-based counter.
- Current owner paid $34k; list at $240k implies a 604% gain — meaningful room to come down on a strong offer.
Risks & watch-outs
- Climate carrying-cost: major wind risk, 61% chance of damaging wind over 30y; extreme-heat days projected 7→16/yr by 2055 (HVAC capex compounding) — expect insurance premiums to compound above CPI over the hold.
Questions for the listing agent
- It's been on market 42 days. Have you received any prior offers? Is the seller open to a 3% concession, seller financing, or rate buy-down credit?
- Built in 1979 — when were the roof, HVAC, electrical panel, plumbing, and water heater last replaced?
- Is there a deadline driving the sale (1031 exchange, divorce, estate, relocation)? That informs how much negotiation room exists.
- What's the average days-on-market for RENTAL listings here right now (not sales)? A rising rental-DOM trend means longer vacancies and softer asking-rent achievability than the comps imply.
- What's the recent tenant-quality profile in this submarket — average credit score on applications, eviction rate, late-payment / NSF rate, and stable-employment percentage? A property-management company in the area should have these aggregated.
- How much new for-sale + rental construction is in the pipeline within 1–3 miles? Heavy new supply typically softens prices + rents 12–24 months out; constrained supply supports both.
Investment metrics
- 1% rule
- 1.14% ✓
- Cap rate
- 8.19%
- Cash-on-cash
- 6.77%
- DSCR
- 1.30
- GRM
- 7.3
CMA / ARV
- ARV (on-the-fly)
- $323,422
- Comps found
- 4
Show comp detail 4 sales within ~0.75 mi
| Address | Dist | Beds/Ba | Sqft | Sold | Price | $/sf | Match |
|---|---|---|---|---|---|---|---|
| 3 Farmhouse Ct | 0.03mi | 3/1.5 | 1,342 (0%) | 12mo | $250,000 | $186 | 89 |
| 11 Farmhouse Ct | 0.04mi | 3/1.5 | 1,342 (0%) | 13mo | $250,000 | $186 | 87 |
| 22 Farm Field Ln | 0.18mi | 3/2.5 | 1,432 (+7%) | 12mo | $345,000 | $241 | 67 |
| 76 Village Green Ln | 0.30mi | 3/2.5 | 1,400 (+4%) | 22mo | $350,000 | $250 | 56 |
Match score weights: distance 35% · size 25% · config 20% · recency 20%. Top-matched comps best support the ARV.
Projected returns pro-forma
-3.0% appreciation · 3.41% rent growth · sell at horizon
- IRR
- -5.4%
- Equity multiple
- 0.80×
- Total profit
- $-13,486
- Equity at exit
- $35,785
- IRR
- 4.9%
- Equity multiple
- 1.36×
- Total profit
- $24,504
- Equity at exit
- $20,751
Cash invested: $67,200 (down + closing). Projections, not guarantees.
Landlord ↔ Tenant lean methodology
- Overall (STATE)
- 21 Tenant-Leaning
- State New Jersey
- 21 Tenant-Leaning · D+6
- County
- — inherits STATE
- City
- — inherits STATE
ZIP-level market 08081
- Rents YoY
- 3.4%
- Active inventory
- 329
- Price-to-rent
- 7.3×
Monthly cashflow live
- Estimated rent
- $2,728 high interval (Pro) →
- Mortgage (P&I)
- −$1,259
- Tax from tax record
- −$417 /mo · $5,005/yr
- Insurance
- −$100
- HOA
- −$0
- Vacancy / Maint / Mgmt
- −$573
- Net cashflow
- $379
Break-even live
UW: 25.0% down · 7.5% · 30yr · 1.5% tax · 5.0% vac · 8.0% maint · 8.0% mgmt
Financing live
Cash to close
- Down payment
- $60,000
- Closing costs
- $7,200
- Reserves months
- —
- Total cash needed
- —
Loan-product check · same deal, 3 products live
Conventional
25% down · 7.5% · 30yr
- Down + closing
- —
- Monthly P&I
- —
- Monthly cashflow
- —
- DSCR
- —
- Eligible?
- —
Personal DTI + credit; lowest rate.
DSCR
20% down · 8.5% · 30yr
- Down + closing
- —
- Monthly P&I
- —
- Monthly cashflow
- —
- DSCR
- —
- Eligible?
- —
No personal income docs; deal must DSCR.
Hard money
10% down · 12.0% · 12mo
- Down + closing
- —
- Monthly P&I
- —
- Monthly cashflow
- —
- DSCR
- —
- Eligible?
- —
Short-term bridge; refi at stabilization.
Rent comps 8 comps
| Address | Beds | Baths | Sqft | Rent | $/sqft | DOM | Units | Dist |
|---|---|---|---|---|---|---|---|---|
| 862 Johnson Rd Sicklerville, NJ | 4.0 | 2.0 | 1527 | $3,500 | $2.29 | 1d | 1 | 0.66mi |
| 540 Kali Rd Sicklerville, NJ | 2.0–3.0 | 2.5 | 1575 | $3,075 | $1.95 | 1d | 1 | 0.91mi |
| 6 Parktown Pl Sicklerville, NJ | 3.0 | 2.5 | 1824 | $2,500 | $1.37 | 5d | 1 | 0.98mi |
| 1000 Fawn Dr Williamstown, NJ | 1.0–2.0 | 1.0–2.0 | 1209 | $5,983 | $4.95 | 1d | 1 | 1.13mi |
| 190 Kenwood Dr Sicklerville, NJ | 2.0 | 1.0 | 912 | $1,800 | $1.97 | 44d | 1 | 1.20mi |
| 79 Edinshire Rd Sicklerville, NJ | 3.0 | 1.0 | 1050 | $2,500 | $2.38 | 15d | 1 | 1.41mi |
| 37 Berkshire Rd Sicklerville, NJ | 2.0 | 1.0 | 1050 | $1,900 | $1.81 | 1d | 1 | 1.43mi |
| 126 Presidential Dr Unit 1 Sicklerville, NJ | 2.0 | 1.0 | 1056 | $1,500 | $1.42 | 17d | 1 | 1.46mi |
Listing history 20 events
-
2026-05-14status Pending
-
2026-04-27status Active
-
2026-04-01historical
-
2026-04-01price $240,000
-
2026-03-11price $230,000
-
2026-03-09$240,000 Active
-
2026-03-07price $240,000
-
2016-11-30soldstatus $34,073 237-char remark
Show marketing remark (237 chars)
Located in The Fields is this semi-attached twin home. Living room is open to the dining area. Kitchen and large family room complete the first floor. Upstairs are the three bedrooms and full bath. This is a Fannie Mae HomePath property.
-
2016-11-30soldstatus $34,073 Sold 237-char remark
Show marketing remark (237 chars)
Located in The Fields is this semi-attached twin home. Living room is open to the dining area. Kitchen and large family room complete the first floor. Upstairs are the three bedrooms and full bath. This is a Fannie Mae HomePath property.
-
2016-10-28status Under Contract 237-char remark
Show marketing remark (237 chars)
Located in The Fields is this semi-attached twin home. Living room is open to the dining area. Kitchen and large family room complete the first floor. Upstairs are the three bedrooms and full bath. This is a Fannie Mae HomePath property.
-
2016-10-28historical 237-char remark
Show marketing remark (237 chars)
Located in The Fields is this semi-attached twin home. Living room is open to the dining area. Kitchen and large family room complete the first floor. Upstairs are the three bedrooms and full bath. This is a Fannie Mae HomePath property.
-
2016-10-17$30,900 Active 237-char remark
Show marketing remark (237 chars)
Located in The Fields is this semi-attached twin home. Living room is open to the dining area. Kitchen and large family room complete the first floor. Upstairs are the three bedrooms and full bath. This is a Fannie Mae HomePath property.
-
2016-10-14$30,900 237-char remark
Show marketing remark (237 chars)
Located in The Fields is this semi-attached twin home. Living room is open to the dining area. Kitchen and large family room complete the first floor. Upstairs are the three bedrooms and full bath. This is a Fannie Mae HomePath property.
-
2010-08-31historical
-
2010-02-02historical
-
2010-01-19$128,500
-
2009-08-17$100,000
-
2009-08-03historical
-
2008-07-28$145,000
-
1986-07-17soldstatus $49,900
ⓘ Source: listings_history table (triggers on properties + properties_extension) + one-shot
backfill from property_details.listing_events for pre-trigger history.
Tax reassessment forecast NJ · Partial reset (capped growth)
- Current annual tax
- $5,005 · $417/mo
- Projected year-2 tax
- $5,491 · $458/mo
- Expected delta
- +$485/yr (+$40/mo · 9.7%)
ⓘ Screening estimate from a state-policy table — verify with the county assessor before closing.
Climate risk First Street
- Flood 1/10 Low FEMA zone X (unshaded) · 0% chance over 30 yrs
- Wildfire 2/10 Low
- Heat 7/10 Severe 7 d/yr ≥103°F today · 16 d/yr by 30 yrs out
- Wind 6/10 Major 61% chance of damaging wind over 30 yrs
- Air quality 3/10 Moderate 2 unhealthy d/yr today · 4 by 30 yrs out
Nearby sold comps map
Loading sold comps map…
Walkable amenities ~0.75 mi
Loading nearby amenities…
Taxation est. · year 1
- Rental income
- $32,735
- − Mortgage interest
- −$13,444
- − Property taxes
- −$5,005
- − Insurance
- −$1,200
- − Repairs & maintenance
- −$2,619
- − Management
- −$2,619
- − Depreciation
- −$6,982
- Taxable income
- $867
- Est. tax owed @ 24.0%
- −$208
- After-tax cash flow
- $4,344/yr
For passive investors: Depreciation is non-cash, so a rental often shows a tax loss while cash-flowing — sheltering income. Rental losses are passive: they offset passive income freely, and up to $25,000/yr can offset ordinary (W-2) income if you actively participate and your MAGI is under $100k (phasing out to $0 by $150k); unused losses carry forward. On sale, claimed depreciation is recaptured at up to 25%, and gains may owe capital-gains tax (a 1031 exchange can defer both). Figures are a year-1 estimate at your 24.0% rate — not tax advice; consult a CPA.
Schools (NCES district)
- District
- Gloucester Township Public Schools
- NCES district ID
- 3406030
- Math proficiency
- 14% ▼ -28.00%
- Reading proficiency
- 41% ▼ -13.00%
- Median HH income
- $72,539
- Composite
- 26.18/100
- National rank
- #7269
- State rank
- #351 of 472 in NJ
Livability — Sicklerville
No livability data for this city. (Only ~50 U.S. cities are tracked.)
Census & demographics
- Census place
- Sicklerville, NJ
- County
- Camden County · 407,624 people
- City population
- 50,264
- Metro
- Philadelphia-Camden-Wilmington, PA-NJ-DE-MD
- Population (ZIP)
- 50,264
- Household income
- $105,800
- Rent vs Own
- Severe rent burden
- 979.0
Population outlook (Camden County) Hauer SSP2
- Today (2025)
- 507,964 people
- By 2030
- 502,182 · -1.1%
- By 2040
- 485,602 · -4.4%
- By 2050
- 465,630 · -8.3%
- By 2075
- 419,986 · -17.3%
- By 2100
- 369,492 · -27.3%
Race, ethnicity, and origin ACS 2023
- Neighborhood character
- Diverse neighborhood (Simpson 0.65)
- Race & ethnicity
- White 47% Black 34% Two or more races 9% Hispanic / Latino 9% Asian 4%
- Hispanic origin (detail)
- Puerto Rican 5%
- Common ancestry
- Romanian 6% Slovak 2% Iranian 1%
- Foreign-born
- 8% · Canada, China, South Korea
- Languages at home
- 90% English-only · Spanish 4% Other Indo-European 1% Tagalog/Filipino 1%
Political lean MEDSL · Camden
- 2024 margin
- Strong D (+27.4) · D 63.0% · R 35.5% · Other 1.5%
- 2008→2024 swing
- -8.8pp toward R · 2008: 36.2pp · 2024: 27.4pp
- All cycles
- 2024: D+27.4 2020: D+33.5 2016: D+32.4 2012: D+36.6 2008: D+36.2
Not yet ingested
- Civics
- —
Market trends
- HPI YoY
- ▼ -176.48%
- Current HPI
- 303.1017
- Rent YoY
- ▲ 3.41%
- Metro
- Philadelphia-Camden-Wilmington, PA-NJ-DE-MD
- State GDP YoY
- ▲ 2.05%
- F500 in state
- 34
Industry mix (Fortune 500 HQ in NJ)
| Industry | F500 HQs | Revenue |
|---|---|---|
| Consumer Goods | 3 | $31B |
|
||
| Pharmaceuticals | 2 | $153B |
|
||
| Technology | 2 | $21B |
|
||
| Insurance | 2 | $20B |
|
||
| Healthcare | 2 | $19B |
|
||
| Financial Services | 1 | $70B |
|
||
Price history
+381.0% since first listed20 events — show timeline
- 2026-05-14 Pending — BRIGHT MLS
- 2026-04-27 Relisted — BRIGHT MLS
- 2026-04-01 Price Changed $240,000 BRIGHT MLS
- 2026-04-01 Listing Removed — BRIGHT MLS
- 2026-03-11 Price Changed $230,000 BRIGHT MLS
- 2026-03-09 Listed $240,000 BRIGHT MLS
- 2026-03-07 Price Changed $240,000 BRIGHT MLS
- 2016-11-30 Sold (MLS) $34,073 TREND
- 2016-11-30 Sold (MLS) $34,073 BRIGHT MLS
- 2016-10-28 Pending — TREND
- 2016-10-28 Listing Removed — BRIGHT MLS
- 2016-10-17 Listed $30,900 TREND
- 2016-10-14 Listed $30,900 BRIGHT MLS
- 2010-08-31 Listing Removed — BRIGHT MLS
- 2010-02-02 Listing Removed — BRIGHT MLS
- 2010-01-19 Listed $128,500 BRIGHT MLS
- 2009-08-17 Listed $100,000 BRIGHT MLS
- 2009-08-03 Listing Removed — BRIGHT MLS
- 2008-07-28 Listed $145,000 BRIGHT MLS
- 1986-07-17 Sold (Public Records) $49,900 Public Records
Property tax history
+2.0%/yrLatest (2025): $5,005 · +2.5% YoY. Source: county tax records.
Cash-flow waterfall
monthlySold comps — $/sqft
last 12 mo · ≤1 miLoading sold comps…