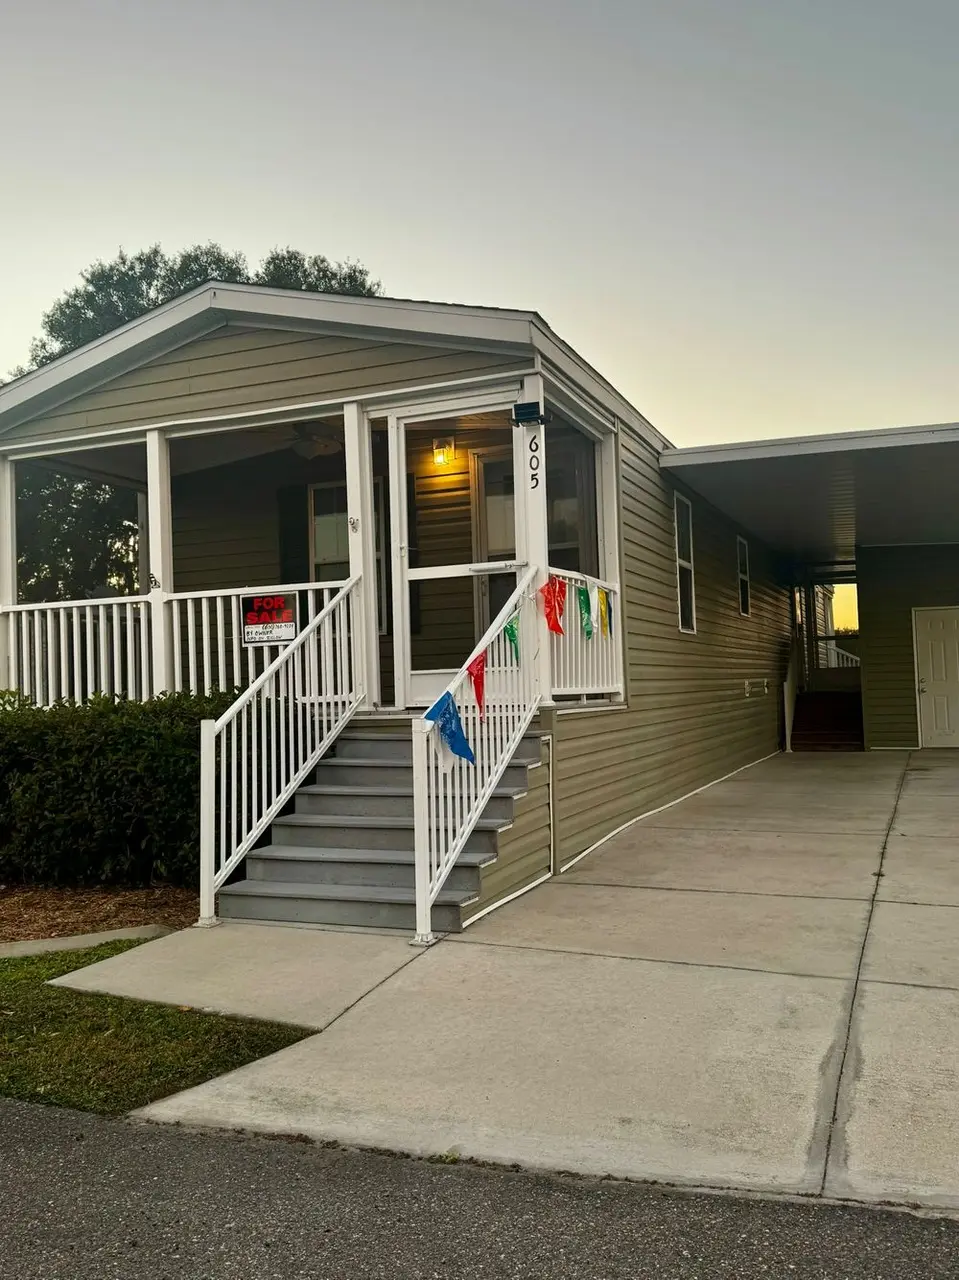
605 Falcon Crst · Plant City, FL
Flood risk 4/10 · Minor
- FEMA flood zone
- A
- Chance of flooding over 30 yrs
- 0.22%
- Est. flood insurance / yr
- $1,009 – $1,996
Fire risk 5/10 · Moderate
- Est. fire insurance / yr
- $947 – $1,759
Heat risk 9/10 · Severe
- Hot days now (above 108°F)
- 7 days/yr
- Hot days in 30 yrs
- 24 days/yr
Wind risk 9/10 · Severe
- Chance of severe wind over 30 yrs
- 99.0%
Air-quality risk 2/10 · Minimal
- Unhealthy air days now
- 1 days/yr
- Unhealthy air days in 30 yrs
- 2 days/yr
Risk factors via First Street. Map © Google.
Why this score? — see what drove the B grade
The composite is a weighted blend of 9 inputs, each scored 0–100. Each bar is that input's sub-score; the figure is the points it added to the 100-point composite (weight × sub-score).
- Cash flow +30.0/30.0
- 1% rule +10.0/10.0
- DSCR +10.0/10.0
- ARV discount +7.5/15.0
- Schools +4.2/10.0
- Condition / age +4.0/5.0
- Livability +3.8/5.0
- Rent growth +2.5/5.0
- Appreciation +0.0/10.0
$59,900
🖨 Deal sheet 📄 Offer letter ✓ Due diligence
Listing remarks MLS
Gated, 55+ golf community in charming Plant City, Florida. Affordable active senior living! Built in 2016 this nearly new, 2 comfortably sized bedrooms, 2 full baths (including one en-suite) mobile home is on a lake lot with amazing sunset views from the screen porch off the owners suite. A relaxing place to enjoy coffee, a book, or an afternoon nap. Recently Painted drywall (not your typical mobile home panels) gives a fresh bright and neutral interior. As you enter from the front door you'll see only vinyl and laminate flooring, no dated carpeting in this home. All appliances included. Ceiling fans in living room, master bedroom and front screened porch. Central air and heat. Washer and dryer inside the home. Large attached carport with room enough for 2+ vehicles. Storage shed under the homes roof allows for clean, dry and secure storage. This fantastic home has 3 screen rooms; one to the rear with peaceful lake view and stunning evening sunsets, one to the side on concrete slab offering potential for future enclosure/build out and one at the front entrance. This home is fresh, clean and move in ready offering a leased lot with low monthly lot rent (currently $886 a month) which covers water, trash and all park amenities (pool, spa, pickle ball/tennis, clubhouse for bingo, card clubs, karaoke, social gatherings, library, pool tables, etc). The Lakes of Countrywood park is close to I-4 for easy access to Tampa and Orlando. Call now to set up a showing.
Key facts
- Gated golf community
- Lake lot
- Sunset views
Tags
Neighborhood map
What this means for you Summary
Snapshot
- This is a 2-bed/2.0-bath single-family listed at $60k. Condition is rated good.
Deal economics
- At list price, monthly cash flow is $910 ($11k/yr) — positive.
- The deal already cash-flows at list — no discount required.
- Meets the 1% rule at list price ($2k rent vs $60k).
- Recommended offer: $53k (12.0% below list) — sets the bar for market timing.
Location & tenants
- Location reads 76/100 on livability (#227 in FL, #3,587 nationally) — a middle-class / working-renter tenant base. Strengths: amenities A+, cost of living A+, housing A+; Watch: employment C-, schools D+, commute F.
- Hillsborough (suburban): math 47% / reading 50% proficiency, ranked #41 of 73 in FL (top 56%) — families likely to look elsewhere, expect single-tenant / working-renter base with shorter leases.
- Market conditions: 307 active listings in the ZIP; 9,053 units permitted in Hillsborough County in 2024 (4,555 in 5+ unit buildings).
Forward outlook
- Local home prices are declining (-3.0%/yr); year-one equity from $414 of loan paydown is wiped out by about $2k of value loss. Plan a longer hold.
- Hillsborough County population projected at +37% by 2050 — long-run rental-demand tailwind backs the buy-and-hold thesis.
- At projected returns (-3.0% appreciation + 3.0% rent growth), your $17k cash investment doubles in ~2 years — after that, you're playing with house money.
Negotiation context
- It's been on market 145 days — a 12% lower offer ($53k) is reasonable based on typical stale-listing flexibility.
Risks & watch-outs
- Watch-outs: flood insurance adds $125/mo.
- Climate carrying-cost: in FEMA flood zone A (mandatory federal flood insurance); severe wind risk, 99% chance of damaging wind over 30y; moderate wildfire risk; extreme-heat days projected 7→24/yr by 2055 (HVAC capex compounding) — expect insurance premiums to compound above CPI over the hold.
Questions for the listing agent
- It's been on market 145 days. Have you received any prior offers? Is the seller open to a 12% concession, seller financing, or rate buy-down credit?
- What's the actual annual flood-insurance premium (NFIP or private), and is the property in a SFHA with mandatory coverage?
- Why hasn't it sold? Are there any deal-killer items the seller is aware of (foundation, flood, title, zoning, code violations)?
- Is there a deadline driving the sale (1031 exchange, divorce, estate, relocation)? That informs how much negotiation room exists.
- Schools are D-rated, which usually means shorter tenancies and higher turnover. Who's the typical renter profile here, and what's been the actual vacancy rate?
- What's the average days-on-market for RENTAL listings here right now (not sales)? A rising rental-DOM trend means longer vacancies and softer asking-rent achievability than the comps imply.
- What's the recent tenant-quality profile in this submarket — average credit score on applications, eviction rate, late-payment / NSF rate, and stable-employment percentage? A property-management company in the area should have these aggregated.
- How much new for-sale + rental construction is in the pipeline within 1–3 miles? Heavy new supply typically softens prices + rents 12–24 months out; constrained supply supports both.
Investment metrics
- 1% rule
- 3.06% ✓
- Cap rate
- 27.04%
- Cash-on-cash
- 74.08%
- DSCR
- 4.30
- GRM
- 2.7
CMA / ARV
No comps found within radius.
Projected returns pro-forma
-3.0% appreciation · 3.0% rent growth · sell at horizon
- IRR
- 64.4%
- Equity multiple
- 3.88×
- Total profit
- $48,373
- Equity at exit
- $8,931
- IRR
- 68.8%
- Equity multiple
- 7.99×
- Total profit
- $117,198
- Equity at exit
- $5,179
Cash invested: $16,772 (down + closing). Projections, not guarantees.
Landlord ↔ Tenant lean methodology
- Overall (STATE)
- 87 Strongly Landlord-Friendly
- State Florida
- 87 Strongly Landlord-Friendly · R+3
- County
- — inherits STATE
- City
- — inherits STATE
ZIP-level market 33565
- Home prices YoY
- -24.7%
- Active inventory
- 307
- Price-to-rent
- 2.7×
Monthly cashflow live
- Estimated rent
- $1,835 medium interval (Pro) →
- Mortgage (P&I)
- −$314
- Tax est. 1.5%
- −$75 /mo · $898/yr
- Insurance
- −$25
- Flood insurance flood zone
- −$125 /mo · $1,502/yr
- HOA
- −$0
- Vacancy / Maint / Mgmt
- −$385
- Net cashflow
- $910
Break-even live
UW: 25.0% down · 7.5% · 30yr · 1.5% tax · 5.0% vac · 8.0% maint · 8.0% mgmt
Financing live
Cash to close
- Down payment
- $14,975
- Closing costs
- $1,797
- Reserves months
- —
- Total cash needed
- —
Loan-product check · same deal, 3 products live
Conventional
25% down · 7.5% · 30yr
- Down + closing
- —
- Monthly P&I
- —
- Monthly cashflow
- —
- DSCR
- —
- Eligible?
- —
Personal DTI + credit; lowest rate.
DSCR
20% down · 8.5% · 30yr
- Down + closing
- —
- Monthly P&I
- —
- Monthly cashflow
- —
- DSCR
- —
- Eligible?
- —
No personal income docs; deal must DSCR.
Hard money
10% down · 12.0% · 12mo
- Down + closing
- —
- Monthly P&I
- —
- Monthly cashflow
- —
- DSCR
- —
- Eligible?
- —
Short-term bridge; refi at stabilization.
Listing history 15 events
-
2026-06-18days on market $59,900 Active 145 DOM
-
2026-06-17days on market $59,900 Active 144 DOM
-
2026-06-16days on market $59,900 Active 143 DOM
-
2026-06-15days on market $59,900 Active 142 DOM
-
2026-06-13days on market $59,900 Active 140 DOM
-
2026-06-13days on market $59,900 Active 139 DOM
-
2026-06-09days on market $59,900 Active 136 DOM
-
2026-06-08days on market $59,900 Active 135 DOM
-
2026-06-07days on market $59,900 Active 134 DOM
-
2026-06-04days on market $59,900 Active 131 DOM
-
2026-06-03days on market $59,900 Active 130 DOM
-
2026-06-02days on market $59,900 Active 129 DOM
-
2026-06-01days on market $59,900 Active 128 DOM
-
2026-05-31days on market $59,900 Active 127 DOM
-
2026-01-24$59,900 Active 1478-char remark
Show marketing remark (1478 chars)
Gated, 55+ golf community in charming Plant City, Florida. Affordable active senior living! Built in 2016 this nearly new, 2 comfortably sized bedrooms, 2 full baths (including one en-suite) mobile home is on a lake lot with amazing sunset views from the screen porch off the owners suite. A relaxing place to enjoy coffee, a book, or an afternoon nap. Recently Painted drywall (not your typical mobile home panels) gives a fresh bright and neutral interior. As you enter from the front door you'll see only vinyl and laminate flooring, no dated carpeting in this home. All appliances included. Ceiling fans in living room, master bedroom and front screened porch. Central air and heat. Washer and dryer inside the home. Large attached carport with room enough for 2+ vehicles. Storage shed under the homes roof allows for clean, dry and secure storage. This fantastic home has 3 screen rooms; one to the rear with peaceful lake view and stunning evening sunsets, one to the side on concrete slab offering potential for future enclosure/build out and one at the front entrance. This home is fresh, clean and move in ready offering a leased lot with low monthly lot rent (currently $886 a month) which covers water, trash and all park amenities (pool, spa, pickle ball/tennis, clubhouse for bingo, card clubs, karaoke, social gatherings, library, pool tables, etc). The Lakes of Countrywood park is close to I-4 for easy access to Tampa and Orlando. Call now to set up a showing.
ⓘ Source: listings_history table (triggers on properties + properties_extension) + one-shot
backfill from property_details.listing_events for pre-trigger history.
Climate risk First Street
- Flood 4/10 Moderate FEMA zone A · 22% chance over 30 yrs
- Wildfire 5/10 Major
- Heat 9/10 Extreme 7 d/yr ≥108°F today · 24 d/yr by 30 yrs out
- Wind 9/10 Extreme 99% chance of damaging wind over 30 yrs
- Air quality 2/10 Low 1 unhealthy d/yr today · 2 by 30 yrs out
Nearby sold comps map
Loading sold comps map…
Walkable amenities ~0.75 mi
Loading nearby amenities…
Taxation est. · year 1
- Rental income
- $22,016
- − Mortgage interest
- −$3,355
- − Property taxes
- −$898
- − Insurance
- −$1,802
- − Repairs & maintenance
- −$1,761
- − Management
- −$1,761
- − Depreciation
- −$1,743
- Taxable income
- $10,695
- Est. tax owed @ 24.0%
- −$2,567
- After-tax cash flow
- $8,356/yr
For passive investors: Depreciation is non-cash, so a rental often shows a tax loss while cash-flowing — sheltering income. Rental losses are passive: they offset passive income freely, and up to $25,000/yr can offset ordinary (W-2) income if you actively participate and your MAGI is under $100k (phasing out to $0 by $150k); unused losses carry forward. On sale, claimed depreciation is recaptured at up to 25%, and gains may owe capital-gains tax (a 1031 exchange can defer both). Figures are a year-1 estimate at your 24.0% rate — not tax advice; consult a CPA.
Condition & rehab AI · 12 photos
This nearly new mobile home in a gated 55+ golf community offers a relaxing living space with modern updates and a lake view. It is move-in ready with minimal maintenance required.
Value-add opportunities
- Both Painting the exterior siding — Enhances curb appeal and can increase both resale and rental value
- Both Upgrading the ceiling fans to energy-efficient models — Improves energy efficiency and adds a modern touch
- Both Adding a smart thermostat — Enhances energy efficiency and adds a modern touch
Renovation cost estimate screening
Value-add ROI direction
- Both Painting the exterior siding — Enhances curb appeal and can increase both resale and rental value ↑
- Both Upgrading the ceiling fans to energy-efficient models — Improves energy efficiency and adds a modern touch ↑
- Both Adding a smart thermostat — Enhances energy efficiency and adds a modern touch ↑
ⓘ Cost ranges are severity-bucket heuristics (US national rule-of-thumb). Get contractor quotes + a written scope before underwriting a rehab budget.
Schools (NCES district)
- District
- Hillsborough
- NCES district ID
- 1200870
- Math proficiency
- 47% ▼ -8.00%
- Reading proficiency
- 50% ▼ -4.00%
- Median HH income
- $50,622
- Composite
- 41.6/100
- National rank
- #3435
- State rank
- #41 of 73 in FL
Livability — Plant City
- Score
- 76/100
- State rank
- #227
- US rank
- #3587
Category grades
Schools grade is shown separately in the Schools card above.
Census & demographics
- County
- Hillsborough County · 1,540,968 people
- City population
- 68,525
- Metro
- Tampa-St. Petersburg-Clearwater, FL
- Population (ZIP)
- 18,108
- Household income
- $73,414
- Rent vs Own
- Severe rent burden
- 152.0
Population outlook (Hillsborough County) Hauer SSP2
- Today (2025)
- 1,607,022 people
- By 2030
- 1,733,968 · +7.9%
- By 2040
- 1,979,565 · +23.2%
- By 2050
- 2,203,427 · +37.1%
- By 2075
- 2,667,893 · +66.0%
- By 2100
- 2,891,558 · +79.9%
Race, ethnicity, and origin ACS 2023
- Neighborhood character
- Predominantly White (71%)
- Race & ethnicity
- White 71% Hispanic / Latino 23% Two or more races 14% Black 2% Native American 1%
- Hispanic origin (detail)
- Mexican 16% Puerto Rican 2% Cuban 1%
- Common ancestry
- Romanian 2% Slovak 1% Iranian 1%
- Foreign-born
- 10% · Canada, Jamaica
- Languages at home
- 80% English-only · Spanish 19%
Political lean MEDSL · Hillsborough
- 2024 margin
- Toss-up / Even · D 47.8% · R 50.9% · Other 1.3%
- 2008→2024 swing
- -10.2pp toward R · 2008: 7.1pp · 2024: -3.1pp
- All cycles
- 2024: R+3.1 2020: D+6.9 2016: D+6.8 2012: D+6.7 2008: D+7.1
Not yet ingested
- Civics
- —
Market trends
- HPI YoY
- ▼ -114.17%
- Current HPI
- 347.2475
- Rent YoY
- —
- Metro
- Tampa-St. Petersburg-Clearwater, FL
- State GDP YoY
- ▲ 3.28%
- F500 in state
- 36
Industry mix (Fortune 500 HQ in FL)
| Industry | F500 HQs | Revenue |
|---|---|---|
| Industrial Technology | 2 | $29B |
|
||
| Insurance | 2 | $17B |
|
||
| Retail | 1 | $60B |
|
||
| Technology Distribution | 1 | $58B |
|
||
| Homebuilding | 1 | $35B |
|
||
| Technology Manufacturing | 1 | $35B |
|
||
Price history
1 event — show timeline
- 2026-01-24 Listed $59,900 ForSaleByOwner.com
Cash-flow waterfall
monthlySold comps — $/sqft
last 12 mo · ≤1 miLoading sold comps…