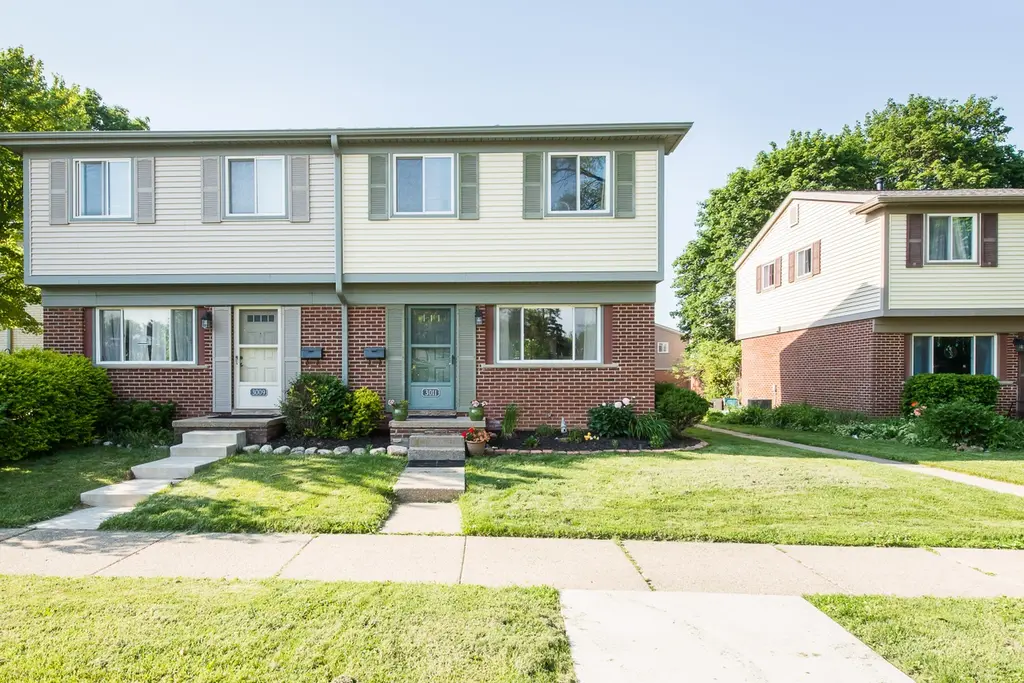
3011 Williamsburg Rd · Ann Arbor, MI
Flood risk No data
- FEMA flood zone
- —
- Chance of flooding over 30 yrs
- —
- Est. flood insurance / yr
- —
Fire risk No data
- Est. fire insurance / yr
- —
Heat risk No data
- Hot days now (above threshold)
- —
- Hot days in 30 yrs
- —
Wind risk No data
- Chance of severe wind over 30 yrs
- —
Air-quality risk No data
- Unhealthy air days now
- —
- Unhealthy air days in 30 yrs
- —
Risk factors via First Street. Map © Google.
Why this score? — see what drove the C- grade
The composite is a weighted blend of 9 inputs, each scored 0–100. Each bar is that input's sub-score; the figure is the points it added to the 100-point composite (weight × sub-score).
- Cash flow +15.4/30.0
- 1% rule +7.9/10.0
- ARV discount +7.5/15.0
- Schools +6.5/10.0
- DSCR +4.7/10.0
- Livability +4.4/5.0
- Rent growth +3.9/5.0
- Condition / age +2.5/5.0
- Appreciation +0.0/10.0
$180,000
🖨 Deal sheet (PDF) 📄 Offer letter ✓ Due diligence
Listing remarks MLS
This beautifully updated END-UNIT townhome blends modern upgrades with extra space and light you won't find in interior units. The fully renovated (2021) kitchen features contemporary finishes, including granite countertops, and opens to a sunny living area with hardwood flooring. A newly finished lower-level bonus room offers the perfect playroom, office, or media retreat. Three spacious bedrooms upstairs and well-maintained bath complete a truly move-in ready home. And don't miss the huge, newly sealed deck overlooking the charming common green space and walking paths. Come see this Colonial Square gem!
Key facts
- $528 HOA
- Built 1964
- Listed 6 days
Property features AI
Finance
- HOA & community: Monthly association fee of $528; Association covers water, trash, snow removal, and lawn/yard care; Association allows pets; Playground on site
Exterior
- Utilities: Natural gas available and connected; Electricity available; Cable connected; High-speed internet; Natural gas water heater
- Home design: Residential stock cooperative
- Construction: Built in 1964; Brick and vinyl siding; Shingle roof; Full basement
- Exterior features: Paved road access; Public water
Interior
- Kitchen: Dishwasher; Oven; Range
- Bathrooms: 1 full bathroom
- Heating & cooling: Forced air heating; Has central cooling
- Interior features: Total of 7 rooms; Screens on windows
- Laundry & utility: Washer; Dryer; Disposal
Neighborhood map
What this means for you Summary
Snapshot
- This is a 3-bed/1.0-bath condo listed at $180k.
Deal economics
- At list price, monthly cash flow is $69 ($834/yr) — positive.
- The deal already cash-flows at list — no discount required.
- Meets the 1% rule at list price ($2k rent vs $180k).
- Cap rate 6.8% vs local median 2.5% in Ann Arbor — top-decile yield for the area; either an underpriced asset or a hidden risk that comps aren't pricing in. Stress-test before assuming the spread holds.
Location & tenants
- Location reads 88/100 on livability (#10 in MI, #155 nationally) — a professional / high-income tenant draw. Strengths: schools A+, amenities A+, commute A+; Watch: cost of living D.
- Ann Arbor Public Schools (urban): math 71% / reading 81% proficiency, ranked #6 of 540 in MI (top 1%) — strong family-tenant draw, lease renewals of 3-5y typical.
- Market conditions: Rents rising fast (+5.7%/yr); 151 active listings in the ZIP; 17 comparable units currently listed for rent nearby; rentals lingering (median 44d on market — plan ~5-8 weeks vacancy on turnover, expect pricing pressure); 59% of comp listings sitting > 30 days — soft ceiling on asking rent; solid renter incomes; 996 units permitted in Washtenaw County in 2024 (492 in 5+ unit buildings).
- This rent runs 31% of the median local income ($89k/yr) — at the standard rent-burdened threshold; future hikes will face affordability resistance.
Forward outlook
- Local home prices are declining (-3.0%/yr); year-one equity from $1k of loan paydown is wiped out by about $5k of value loss. Plan a longer hold.
- Washtenaw County population projected at +25% by 2050 — long-run rental-demand tailwind backs the buy-and-hold thesis.
Negotiation context
- Only 6 days on market — expect competitive offers; lowballing is unlikely to land.
- 13 sale attempts since 18y ago with the ask held roughly flat each time — persistent listings suggest the price (not the market) is what's stuck; bring a comps-based counter.
- Current owner paid $70k; list at $180k implies a 157% gain — meaningful room to come down on a strong offer.
Risks & watch-outs
- Watch-outs: HOA is 23% of rent.
Questions for the listing agent
- Built in 1964 — when were the roof, HVAC, electrical panel, plumbing, and water heater last replaced?
- What does the HOA fee cover, when was the last increase, and are there any pending special assessments or reserve-fund shortfalls?
- Any open or pending special assessments — roof, HVAC, plumbing, elevator, façade? What's the per-unit balance and payoff schedule, and is the seller paying it off at close or rolling it to the buyer?
- Is there a deadline driving the sale (1031 exchange, divorce, estate, relocation)? That informs how much negotiation room exists.
- Schools are A-rated — typically a magnet for longer-tenancy family renters. What's the average tenant stay here, and is there a school-zone premium baked into asking?
- What's the average days-on-market for RENTAL listings here right now (not sales)? A rising rental-DOM trend means longer vacancies and softer asking-rent achievability than the comps imply.
- What's the recent tenant-quality profile in this submarket — average credit score on applications, eviction rate, late-payment / NSF rate, and stable-employment percentage? A property-management company in the area should have these aggregated.
- How much new apartment / multifamily construction is in the pipeline within 1–3 miles? Heavy new supply (>2% of stock underway) typically softens rents 12–24 months out; light construction supports rent growth.
Investment metrics
- 1% rule
- 1.29% ✓
- Cap rate
- 6.76%
- Cash-on-cash
- 1.65%
- DSCR
- 1.07
- GRM
- 6.4
CMA / ARV
No comps found within radius.
Projected returns pro-forma
-3.0% appreciation · 5.72% rent growth · sell at horizon
- IRR
- -9.3%
- Equity multiple
- 0.65×
- Total profit
- $-17,831
- Equity at exit
- $26,839
- IRR
- 4.6%
- Equity multiple
- 1.40×
- Total profit
- $20,063
- Equity at exit
- $15,563
Cash invested: $50,400 (down + closing). Projections, not guarantees.
Landlord ↔ Tenant lean methodology
- Overall (STATE)
- 62 Landlord-Friendly
- State Michigan
- 62 Landlord-Friendly · EVEN
- County
- — inherits STATE
- City
- — inherits STATE
ZIP-level market 48108
- Rents YoY
- 5.7%
- Active inventory
- 151
- Price-to-rent
- 6.4×
Monthly cashflow live
- Estimated rent
- $2,331 high interval (Pro) →
- Mortgage (P&I)
- −$944
- Tax est. 1.5%
- −$225 /mo · $2,700/yr
- Insurance
- −$75
- HOA
- −$528
- Vacancy / Maint / Mgmt
- −$489
- Net cashflow
- $69
Break-even live
Sensitivity live
| Price | -10% $194 | -5% $132 | +0% $69 | +5% $7 | +10% $-55 |
|---|---|---|---|---|---|
| Rent | -10% $-115 | -5% $-23 | +0% $69 | +5% $162 | +10% $254 |
| Rate | -1.0pp $160 | -0.5pp $115 | base $69 | +0.5pp $23 | +1.0pp $-25 |
UW: 25.0% down · 7.5% · 30yr · 1.5% tax · 5.0% vac · 8.0% maint · 8.0% mgmt
Financing live
Cash to close
- Down payment
- $45,000
- Closing costs
- $5,400
- Reserves months
- —
- Total cash needed
- —
Loan-product check · same deal, 3 products live
Conventional
25% down · 7.5% · 30yr
- Down + closing
- —
- Monthly P&I
- —
- Monthly cashflow
- —
- DSCR
- —
- Eligible?
- —
Personal DTI + credit; lowest rate.
DSCR
20% down · 8.5% · 30yr
- Down + closing
- —
- Monthly P&I
- —
- Monthly cashflow
- —
- DSCR
- —
- Eligible?
- —
No personal income docs; deal must DSCR.
Hard money
10% down · 12.0% · 12mo
- Down + closing
- —
- Monthly P&I
- —
- Monthly cashflow
- —
- DSCR
- —
- Eligible?
- —
Short-term bridge; refi at stabilization.
Rent comps 17 comps
| Address | Beds | Baths | Sqft | Rent | $/sqft | DOM | Units | Dist |
|---|---|---|---|---|---|---|---|---|
| 3238 Platt Rd Ann Arbor, MI | 3.0 | 1.5 | 1488 | $2,500 | $1.68 | 44d | 1 | 0.39mi |
| 3029 Charing Cross Rd Unit 3029 Ann Arbor, MI | 3.0 | 2.5 | 1400 | $2,400 | $1.71 | 44d | 1 | 0.79mi |
| 2716 Packard St Ann Arbor, MI | 1.0–2.0 | 1.0 | 862 | $1,350 | $1.57 | 44d | 1 | 0.89mi |
| 3423 Carpenter Rd Ypsilanti, MI | 2.0 | 1.0–2.0 | 840 | $1,464 | $1.74 | 14d | 1 | 1.03mi |
| 3032 Forest Creek Ct Ann Arbor, MI | 2.0 | 2.0 | 966 | $1,750 | $1.81 | 44d | 1 | 1.04mi |
| 2040 Cloverly Ln Ann Arbor, MI | 2.0 | 2.5 | 1555 | $2,292 | $1.47 | 14d | 2 | 1.07mi |
| 2645 Burton Rd Unit Bld 4 Ann Arbor, MI | 3.0 | 3.0 | 1480 | $3,347 | $2.26 | 44d | 1 | 1.09mi |
| 2805 Burton Rd Unit 104 Ann Arbor, MI | 2.0 | 2.0 | 1228 | $2,797 | $2.28 | 44d | 1 | 1.14mi |
| 2805 Burton Rd Unit 309 Ann Arbor, MI | 3.0 | 3.0 | 1480 | $3,347 | $2.26 | 44d | 1 | 1.14mi |
| 2805 Burton Rd Unit 306 Ann Arbor, MI | 3.0 | 2.0 | 1323 | $3,197 | $2.42 | 44d | 1 | 1.14mi |
| 3510 Pheasant Run Cir Ann Arbor, MI | 1.0–2.0 | 1.0 | 825 | $1,405 | $1.70 | 14d | 10 | 1.14mi |
| 3510 Pheasant Run Cir Ann Arbor, MI | 1.0–2.0 | 1.0 | 825 | $1,445 | $1.75 | 44d | 13 | 1.14mi |
| 2960 Birch Hollow Dr Ann Arbor, MI | 1.0–2.0 | 1.0 | 718 | $1,299 | $1.81 | 14d | 3 | 1.20mi |
| 2225 S Huron Pkwy #2 Ann Arbor, MI | 2.0 | 2.0 | 1053 | $2,100 | $1.99 | 44d | 1 | 1.26mi |
| 2221 S Huron Pkwy #4 Ann Arbor, MI | 2.0 | 2.0 | 1053 | $2,000 | $1.90 | 14d | 1 | 1.28mi |
| 2572 Carpenter Rd Ann Arbor, MI | 1.0–2.0 | 1.0 | 786 | $1,799 | $2.29 | 21d | 9 | 1.29mi |
| 2511 Packard St Ann Arbor, MI | 2.0–3.0 | 2.0 | 1200 | $2,539 | $2.12 | 14d | 7 | 1.48mi |
HOA detail condo
- Monthly dues
- $528 · $6,336/yr
- Assessments
- None detected in remarks — confirm with the listing agent.
Listing history 7 events
-
2026-06-14statusdays on market $180,000 Pending 6 DOM
-
2026-06-10remarks 640-char remark
-
2026-06-10days on market $180,000 Active 4 DOM
-
2026-06-09days on market $180,000 Active 3 DOM
-
2026-06-08days on market $180,000 Active 2 DOM
-
2026-06-07remarks 612-char remark
-
2026-06-07$180,000 Active 1 DOM
ⓘ Source: listings_history table (triggers on properties + properties_extension) + one-shot
backfill from property_details.listing_events for pre-trigger history.
Nearby sold comps map
Loading sold comps map…
Walkable amenities ~0.75 mi
Loading nearby amenities…
Taxation est. · year 1
- Rental income
- $27,971
- − Mortgage interest
- −$10,083
- − Property taxes
- −$2,700
- − Insurance
- −$900
- − Repairs & maintenance
- −$2,238
- − Management
- −$2,238
- − HOA
- −$6,336
- − Depreciation
- −$5,236
- Taxable loss
- −$1,760
- Est. tax savings @ 24.0%
- +$422
- After-tax cash flow
- $1,256/yr
For passive investors: Depreciation is non-cash, so a rental often shows a tax loss while cash-flowing — sheltering income. Rental losses are passive: they offset passive income freely, and up to $25,000/yr can offset ordinary (W-2) income if you actively participate and your MAGI is under $100k (phasing out to $0 by $150k); unused losses carry forward. On sale, claimed depreciation is recaptured at up to 25%, and gains may owe capital-gains tax (a 1031 exchange can defer both). Figures are a year-1 estimate at your 24.0% rate — not tax advice; consult a CPA.
Schools (NCES district)
- District
- Ann Arbor Public Schools
- NCES district ID
- 2602820
- Math proficiency
- 71% ▲ 5.00%
- Reading proficiency
- 81% ▲ 11.00%
- Median HH income
- $60,768
- Composite
- 65.34/100
- National rank
- #487
- State rank
- #6 of 540 in MI
Livability — Ann Arbor
- Score
- 88/100
- State rank
- #10
- US rank
- #155
Category grades
Schools grade is shown separately in the Schools card above.
Census & demographics
- Census place
- Ann Arbor, MI
- County
- Washtenaw County · 306,860 people
- City population
- 163,747
- Metro
- Ann Arbor, MI
- Population (ZIP)
- 27,666
- Household income
- $89,355
- Rent vs Own
- Severe rent burden
- 1390.0
Population outlook (Washtenaw County) Hauer SSP2
- Today (2025)
- 402,878 people
- By 2030
- 424,104 · +5.3%
- By 2040
- 464,633 · +15.3%
- By 2050
- 504,728 · +25.3%
- By 2075
- 614,463 · +52.5%
- By 2100
- 676,181 · +67.8%
Race, ethnicity, and origin ACS 2023
- Neighborhood character
- Diverse neighborhood (Simpson 0.62)
- Race & ethnicity
- White 58% Black 16% Asian 14% Two or more races 8% Hispanic / Latino 6%
- Hispanic origin (detail)
- Mexican 4%
- Common ancestry
- Romanian 5% Italian 2% Slovak 2%
- Foreign-born
- 23% · China, Canada, South Korea
- Languages at home
- 72% English-only · Arabic 5% Other Indo-European 5% Chinese 5%
Political lean MEDSL · Washtenaw
- 2024 margin
- Solid D (+44.4) · D 71.0% · R 26.6% · Other 2.4%
- 2008→2024 swing
- +3.5pp toward D · 2008: 41.0pp · 2024: 44.4pp
- All cycles
- 2024: D+44.4 2020: D+46.6 2016: D+41.5 2012: D+36.0 2008: D+41.0
Not yet ingested
- Civics
- —
Market trends
- HPI YoY
- ▼ -221.96%
- Current HPI
- 216.8067
- Rent YoY
- ▲ 5.72%
- Metro
- Ann Arbor, MI
- State GDP YoY
- ▲ 1.37%
- F500 in state
- 28
Industry mix (Fortune 500 HQ in MI)
| Industry | F500 HQs | Revenue |
|---|---|---|
| Automotive Parts | 3 | $48B |
|
||
| Automotive | 2 | $372B |
|
||
| Chemicals | 1 | $45B |
|
||
| Automotive Retail | 1 | $29B |
|
||
| Healthcare / Medical Devices | 1 | $23B |
|
||
| Automotive Technology | 1 | $20B |
|
||
Price history
+304.5% since first listed37 events — show timeline
- 2026-06-06 Listed $180,000 REALCOMP
- 2026-06-06 Listed $180,000 SW Michigan MLS
- 2026-06-06 Listed $180,000 MiRealSource-MiMLS
- 2026-06-03 Coming Soon $180,000 MiRealSource-MiMLS
- 2026-06-03 Coming Soon $180,000 SW Michigan MLS
- 2015-05-14 Listing Removed — REALCOMP
- 2015-05-13 Contingent — REALCOMP
- 2015-05-13 Relisted — AAMLS
- 2015-05-12 Sold (MLS) $70,050 SW Michigan MLS
- 2015-05-12 Sold (MLS) $70,050 MiRealSource-MiMLS
- 2015-05-12 Sold (MLS) $70,050 AAMLS
- 2015-05-12 Sold (MLS) $70,050 REALCOMP
- 2015-05-08 Listing Removed — MiRealSource-MiMLS
- 2015-05-01 Listing Removed — REALCOMP
- 2015-04-30 Delisted — AAMLS
- 2015-04-26 Contingent — REALCOMP
- 2015-03-20 Listing Removed — REALCOMP
- 2015-03-06 Contingent — REALCOMP
- 2015-03-06 Contingent — AAMLS
- 2015-02-02 Price Changed $70,000 REALCOMP
- 2015-02-02 Price Changed $70,000 AAMLS
- 2015-01-08 Listed $74,900 REALCOMP
- 2015-01-08 Listed $74,900 AAMLS
- 2015-01-08 Listed $70,000 SW Michigan MLS
- 2015-01-08 Listed $70,000 MiRealSource-MiMLS
- 2014-12-22 Delisted — AAMLS
- 2014-12-22 Listing Removed — MiRealSource-MiMLS
- 2014-12-11 Listed — AAMLS
- 2014-09-19 Listed $78,000 MiRealSource-MiMLS
- 2008-03-26 Sold (MLS) $40,000 AAMLS
- 2008-03-26 Sold (MLS) $40,000 SW Michigan MLS
- 2008-03-26 Sold (MLS) $40,000 MiRealSource-MiMLS
- 2008-03-03 Delisted — AAMLS
- 2008-03-03 Listing Removed — MiRealSource-MiMLS
- 2008-02-20 Listed $44,500 AAMLS
- 2008-02-20 Listed $44,500 SW Michigan MLS
- 2008-02-20 Listed $44,500 MiRealSource-MiMLS
Cash-flow waterfall
monthlySold comps — $/sqft
last 12 mo · ≤1 miLoading sold comps…