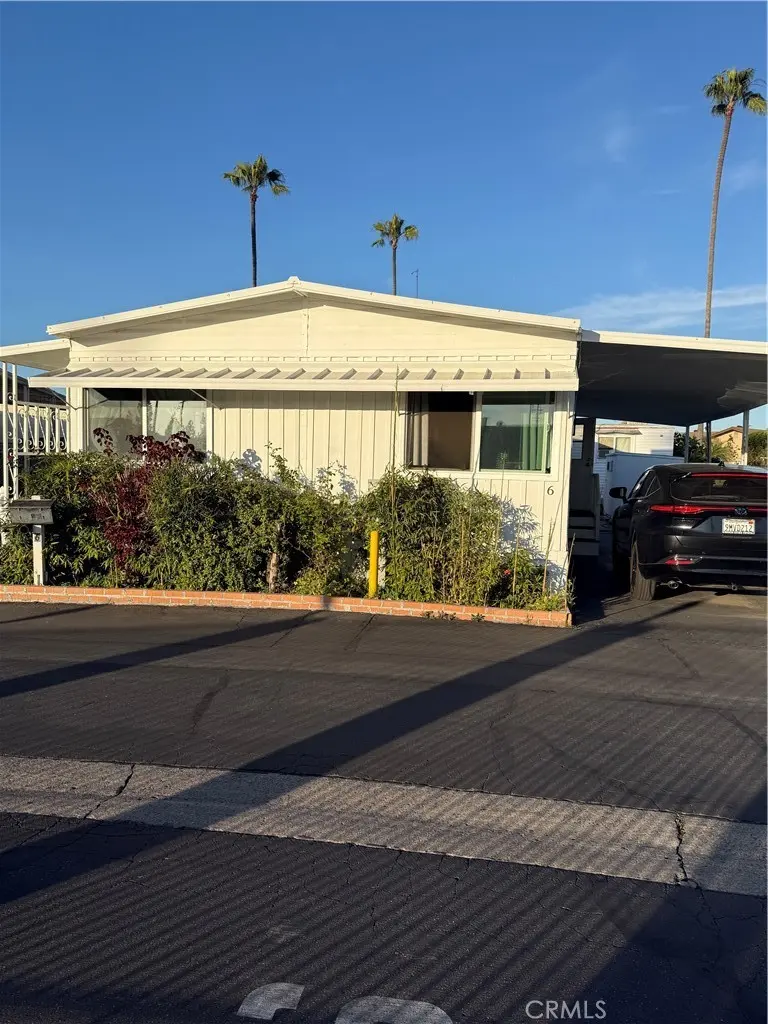
4117 McFadden #6 · Santa Ana, CA
Flood risk 1/10 · Minimal
- FEMA flood zone
- X
- Chance of flooding over 30 yrs
- 0.0%
- Est. flood insurance / yr
- $507 – $1,088
Fire risk 1/10 · Minimal
- Est. fire insurance / yr
- $659 – $1,223
Heat risk 5/10 · Moderate
- Hot days now (above 89°F)
- 7 days/yr
- Hot days in 30 yrs
- 23 days/yr
Wind risk 1/10 · Minimal
- Chance of severe wind over 30 yrs
- —
Air-quality risk 4/10 · Minor
- Unhealthy air days now
- 5 days/yr
- Unhealthy air days in 30 yrs
- 5 days/yr
Risk factors via First Street. Map © Google.
Why this score? — see what drove the C+ grade
The composite is a weighted blend of 9 inputs, each scored 0–100. Each bar is that input's sub-score; the figure is the points it added to the 100-point composite (weight × sub-score).
- Cash flow +30.0/30.0
- 1% rule +10.0/10.0
- DSCR +10.0/10.0
- Schools +4.5/10.0
- Rent growth +3.0/5.0
- Livability +2.8/5.0
- Condition / age +2.5/5.0
- ARV discount +0.0/15.0
- Appreciation +0.0/10.0
$175,000
🖨 Deal sheet 📄 Offer letter ✓ Due diligence
Listing remarks MLS
This is a mobile home for the people 55+. The mobile home has 3 bedrooms and 2 bathroom with the patio It 's very bright and clean . Swimming pool in the park for people want relaxing . Buyer must have income $ 3,600/ month. The mobile home park approval , close to shopping , restaurants . ..
Key facts
- Built 1963
- Listed 103 days
Neighborhood map
What this means for you Summary
Snapshot
- This is a 3-bed/2.0-bath manufactured listed at $175k.
Deal economics
- At list price, monthly cash flow is $1k ($15k/yr) — positive.
- The deal already cash-flows at list — no discount required.
- Meets the 1% rule at list price ($3k rent vs $175k).
- Recommended offer: $159k (9.0% below list) — sets the bar for market timing.
- Cap rate 14.6% vs local median 2.5% in Santa Ana — top-decile yield for the area; either an underpriced asset or a hidden risk that comps aren't pricing in. Stress-test before assuming the spread holds.
Location & tenants
- Location reads 55/100 on livability (#871 in CA) — a working-class tenant base; expect higher turnover. Strengths: employment A; Watch: schools D, crime D-, amenities F.
- Garden Grove Unified (suburban): math 38% / reading 65% proficiency, ranked #132 of 517 in CA (top 26%) — acceptable for families but not a draw, mixed tenant base, ~2y average lease; 60% free/reduced lunch — lower-income household profile, screen leases tightly.
- Market conditions: Rents rising (+2.2%/yr); 80 active listings in the ZIP; 17 comparable units currently listed for rent nearby; rentals at typical pace (median 22d on market — plan ~3-4 weeks tenant-placement turnaround); 47% of comp listings sitting > 30 days — soft ceiling on asking rent; solid renter incomes; 6,974 units permitted in Orange County in 2024 (3,839 in 5+ unit buildings).
- This rent runs 37% of the median local income ($100k/yr) — at the standard rent-burdened threshold; future hikes will face affordability resistance.
Forward outlook
- Local home prices are declining (-3.0%/yr); year-one equity from $1k of loan paydown is wiped out by about $5k of value loss. Plan a longer hold.
- Orange County population projected at +14% by 2050 — modest demand growth; plan on rents tracking national, not racing it.
- At projected returns (-3.0% appreciation + 2.2% rent growth), your $49k cash investment doubles in ~5 years — after that, you're playing with house money.
Negotiation context
- It's been on market 103 days — a 9% lower offer ($159k) is reasonable based on typical stale-listing flexibility.
Risks & watch-outs
- Climate carrying-cost: extreme-heat days projected 7→23/yr by 2055 (HVAC capex compounding) — expect insurance premiums to compound above CPI over the hold.
Questions for the listing agent
- It's been on market 103 days. Have you received any prior offers? Is the seller open to a 9% concession, seller financing, or rate buy-down credit?
- Built in 1963 — when were the roof, HVAC, electrical panel, plumbing, and water heater last replaced?
- Why hasn't it sold? Are there any deal-killer items the seller is aware of (foundation, flood, title, zoning, code violations)?
- Is there a deadline driving the sale (1031 exchange, divorce, estate, relocation)? That informs how much negotiation room exists.
- Schools are D-rated, which usually means shorter tenancies and higher turnover. Who's the typical renter profile here, and what's been the actual vacancy rate?
- Crime grade is D in this area — have there been break-ins, vandalism, or insurance claims at this property in the last 3 years? What carrier currently insures it and at what premium?
- What's the average days-on-market for RENTAL listings here right now (not sales)? A rising rental-DOM trend means longer vacancies and softer asking-rent achievability than the comps imply.
- What's the recent tenant-quality profile in this submarket — average credit score on applications, eviction rate, late-payment / NSF rate, and stable-employment percentage? A property-management company in the area should have these aggregated.
- How much new for-sale + rental construction is in the pipeline within 1–3 miles? Heavy new supply typically softens prices + rents 12–24 months out; constrained supply supports both.
Investment metrics
- 1% rule
- 1.75% ✓
- Cap rate
- 14.63%
- Cash-on-cash
- 29.79%
- DSCR
- 2.33
- GRM
- 4.7
CMA / ARV
- ARV (median comp)
- $138,229
- List price
- $175,000
- Delta
- 26.60%
- Verdict
- OVERPRICED
- Comps
- 20 within 1.0 mi
Show comp detail 12 sales within ~0.75 mi
| Address | Dist | Beds/Ba | Sqft | Sold | Price | $/sf | Match |
|---|---|---|---|---|---|---|---|
| 4117 W Mcfadden Ave #9 | 0.06mi | 3/2.0 | 1,200 (0%) | 0mo | $166,000 | $138 | 97 |
| 432 S Harbor Blvd #20 | 0.16mi | 3/2.0 | 1,248 (+4%) | 17mo | $144,500 | $116 | 72 |
| 4080 W 1st St #174 | 0.23mi | 3/2.0 | 1,152 (-4%) | 18mo | $191,500 | $166 | 68 |
| 4080 W 1st St #114 | 0.23mi | 2/2.0 (-1) | 1,152 (-4%) | 16mo | $140,000 | $122 | 64 |
| 4080 W First #175 | 0.23mi | 3/2.0 | 1,100 (-8%) | 15mo | $165,000 | $150 | 63 |
| 4117 W Mcfadden Ave #612 | 0.00mi | 2/2.0 (-1) | 1,045 (-13%) | 17mo | $165,500 | $158 | 60 |
| 323 N Euclid #63 | 0.73mi | 3/2.0 | 1,200 (0%) | 8mo | $200,000 | $167 | 59 |
| 4117 W McFadden #116 | 0.12mi | 2/2.0 (-1) | 1,040 (-13%) | 15mo | $160,000 | $154 | 55 |
| 432 S Harbor Blvd #34 | 0.16mi | 2/2.0 (-1) | 1,040 (-13%) | 14mo | $109,000 | $105 | 54 |
| 323 N Euclid st, sp 65 #65 | 0.73mi | 4/2.0 (+1) | 1,281 (+7%) | 1mo | $250,000 | $195 | 49 |
| 4801 W First St #78 | 0.55mi | 4/2.0 (+1) | 1,344 (+12%) | 12mo | $203,000 | $151 | 39 |
| 3929 W 5th St #49 | 0.72mi | 2/2.0 (-1) | 1,040 (-13%) | 7mo | $152,000 | $146 | 33 |
Match score weights: distance 35% · size 25% · config 20% · recency 20%. Top-matched comps best support the ARV.
Projected returns pro-forma
-3.0% appreciation · 2.16% rent growth · sell at horizon
- IRR
- 23.4%
- Equity multiple
- 1.95×
- Total profit
- $46,583
- Equity at exit
- $26,093
- IRR
- 30.8%
- Equity multiple
- 3.66×
- Total profit
- $130,120
- Equity at exit
- $15,131
Cash invested: $49,000 (down + closing). Projections, not guarantees.
Landlord ↔ Tenant lean methodology
- Overall (STATE)
- 18 Strongly Tenant-Friendly
- State California
- 18 Strongly Tenant-Friendly · D+13
- County
- — inherits STATE
- City
- — inherits STATE
ZIP-level market 92704
- Rents YoY
- 2.2%
- Active inventory
- 80
- Price-to-rent
- 4.7×
Monthly cashflow live
- Estimated rent
- $3,071 high interval (Pro) →
- Mortgage (P&I)
- −$918
- Tax est. 1.5%
- −$219 /mo · $2,625/yr
- Insurance
- −$73
- HOA
- −$0
- Vacancy / Maint / Mgmt
- −$645
- Net cashflow
- $1,216
Break-even live
UW: 25.0% down · 7.5% · 30yr · 1.5% tax · 5.0% vac · 8.0% maint · 8.0% mgmt
Financing live
Cash to close
- Down payment
- $43,750
- Closing costs
- $5,250
- Reserves months
- —
- Total cash needed
- —
Loan-product check · same deal, 3 products live
Conventional
25% down · 7.5% · 30yr
- Down + closing
- —
- Monthly P&I
- —
- Monthly cashflow
- —
- DSCR
- —
- Eligible?
- —
Personal DTI + credit; lowest rate.
DSCR
20% down · 8.5% · 30yr
- Down + closing
- —
- Monthly P&I
- —
- Monthly cashflow
- —
- DSCR
- —
- Eligible?
- —
No personal income docs; deal must DSCR.
Hard money
10% down · 12.0% · 12mo
- Down + closing
- —
- Monthly P&I
- —
- Monthly cashflow
- —
- DSCR
- —
- Eligible?
- —
Short-term bridge; refi at stabilization.
Rent comps 17 comps
| Address | Beds | Baths | Sqft | Rent | $/sqft | DOM | Units | Dist |
|---|---|---|---|---|---|---|---|---|
| 517 S Newhope St Santa Ana, CA | 2.0 | 1.0 | 840 | $2,125 | $2.53 | 44d | 1 | 0.15mi |
| 909 S Elliott Pl Santa Ana, CA | 4.0 | 2.0 | 1351 | $4,700 | $3.48 | 44d | 1 | 0.31mi |
| 4200 W 1st St Santa Ana, CA | 1.0–2.0 | 1.0–2.0 | 714 | $2,997 | $4.19 | 2d | 4 | 0.35mi |
| 4800 W McFadden Ave Santa Ana, CA | 2.0 | 1.0 | 820 | $2,450 | $2.99 | 19d | 1 | 0.52mi |
| 3900 W 5th St Santa Ana, CA | 1.0–2.0 | 1.0–2.0 | 780 | $2,175 | $2.79 | 13d | 1 | 0.57mi |
| 4201 W 5th St Santa Ana, CA | 2.0 | 1.0 | 921 | $2,800 | $3.04 | 7d | 1 | 0.60mi |
| 308 S Laurel St Unit C Santa Ana, CA | 2.0 | 1.0 | 950 | $2,650 | $2.79 | 44d | 1 | 0.61mi |
| 4109 W 5th St Unit C3 Santa Ana, CA | 2.0 | 2.0 | 921 | $2,500 | $2.71 | 22d | 1 | 0.64mi |
| 4109 W 5th St Unit C3 Santa Ana, CA | 2.0 | 2.0 | 921 | $2,900 | $3.15 | 44d | 1 | 0.64mi |
| 3200 W 5th St Santa Ana, CA | 1.0–2.0 | 1.0–2.0 | 769 | $2,795 | $3.63 | 2d | 9 | 0.89mi |
| 10956 Obsidian Ct Fountain Valley, CA | 3.0 | 1.5 | 1388 | $3,500 | $2.52 | 19d | 1 | 0.94mi |
| 16350 S Harbor Blvd Santa Ana, CA | 1.0–2.0 | 1.0 | 800 | $2,870 | $3.59 | 44d | 1 | 1.07mi |
| 16245 Mount Baden Powell St Fountain Valley, CA | 2.0 | 2.0 | 900 | $2,650 | $2.94 | 44d | 1 | 1.11mi |
| 1314 N Harbor Blvd Santa Ana, CA | 2.0 | 2.0 | 884 | $2,742 | $3.10 | 13d | 4 | 1.18mi |
| 15951 Los Reyes St Unit A Fountain Valley, CA | 3.0 | 2.0 | 1000 | $3,100 | $3.10 | 44d | 1 | 1.22mi |
| 1500 N Harbor Blvd Santa Ana, CA | 1.0–2.0 | 1.0–2.0 | 780 | $2,575 | $3.30 | 15d | 1 | 1.25mi |
| 3630 Westminster Ave Santa Ana, CA | 2.0 | 2.0 | 997 | $2,758 | $2.77 | 44d | 1 | 1.35mi |
Listing history 19 events
-
2026-06-18days on market $175,000 Active 103 DOM
-
2026-06-17days on market $175,000 Active 102 DOM
-
2026-06-16days on market $175,000 Active 101 DOM
-
2026-06-15days on market $175,000 Active 100 DOM
-
2026-06-13days on market $175,000 Active 98 DOM
-
2026-06-13days on market $175,000 Active 97 DOM
-
2026-06-09days on market $175,000 Active 94 DOM
-
2026-06-08days on market $175,000 Active 93 DOM
-
2026-06-07days on market $175,000 Active 92 DOM
-
2026-06-04days on market $175,000 Active 89 DOM
-
2026-06-03days on market $175,000 Active 88 DOM
-
2026-06-02days on market $175,000 Active 87 DOM
-
2026-06-01days on market $175,000 Active 86 DOM
-
2026-05-31days on market $175,000 Active 85 DOM
-
2026-03-31price $175,000 293-char remark
Show marketing remark (293 chars)
This is a mobile home for the people 55+. The mobile home has 3 bedrooms and 2 bathroom with the patio It 's very bright and clean . Swimming pool in the park for people want relaxing . Buyer must have income $ 3,600/ month. The mobile home park approval , close to shopping , restaurants . ..
-
2026-03-11price $184,000 293-char remark
Show marketing remark (293 chars)
This is a mobile home for the people 55+. The mobile home has 3 bedrooms and 2 bathroom with the patio It 's very bright and clean . Swimming pool in the park for people want relaxing . Buyer must have income $ 3,600/ month. The mobile home park approval , close to shopping , restaurants . ..
-
2026-03-11price $172,000 293-char remark
Show marketing remark (293 chars)
This is a mobile home for the people 55+. The mobile home has 3 bedrooms and 2 bathroom with the patio It 's very bright and clean . Swimming pool in the park for people want relaxing . Buyer must have income $ 3,600/ month. The mobile home park approval , close to shopping , restaurants . ..
-
2026-03-07$185,000 Active 293-char remark
Show marketing remark (293 chars)
This is a mobile home for the people 55+. The mobile home has 3 bedrooms and 2 bathroom with the patio It 's very bright and clean . Swimming pool in the park for people want relaxing . Buyer must have income $ 3,600/ month. The mobile home park approval , close to shopping , restaurants . ..
-
2026-03-06historical $185,000 293-char remark
Show marketing remark (293 chars)
This is a mobile home for the people 55+. The mobile home has 3 bedrooms and 2 bathroom with the patio It 's very bright and clean . Swimming pool in the park for people want relaxing . Buyer must have income $ 3,600/ month. The mobile home park approval , close to shopping , restaurants . ..
ⓘ Source: listings_history table (triggers on properties + properties_extension) + one-shot
backfill from property_details.listing_events for pre-trigger history.
Climate risk First Street
- Flood 1/10 Low FEMA zone X · 0% chance over 30 yrs
- Wildfire 1/10 Low
- Heat 5/10 Major 7 d/yr ≥89°F today · 23 d/yr by 30 yrs out
- Wind 1/10 Low
- Air quality 4/10 Moderate 5 unhealthy d/yr today · 5 by 30 yrs out
Nearby sold comps map
Loading sold comps map…
Walkable amenities ~0.75 mi
Loading nearby amenities…
Taxation est. · year 1
- Rental income
- $36,846
- − Mortgage interest
- −$9,803
- − Property taxes
- −$2,625
- − Insurance
- −$875
- − Repairs & maintenance
- −$2,948
- − Management
- −$2,948
- − Depreciation
- −$5,091
- Taxable income
- $12,557
- Est. tax owed @ 24.0%
- −$3,014
- After-tax cash flow
- $11,582/yr
For passive investors: Depreciation is non-cash, so a rental often shows a tax loss while cash-flowing — sheltering income. Rental losses are passive: they offset passive income freely, and up to $25,000/yr can offset ordinary (W-2) income if you actively participate and your MAGI is under $100k (phasing out to $0 by $150k); unused losses carry forward. On sale, claimed depreciation is recaptured at up to 25%, and gains may owe capital-gains tax (a 1031 exchange can defer both). Figures are a year-1 estimate at your 24.0% rate — not tax advice; consult a CPA.
Schools (NCES district)
- District
- Garden Grove Unified
- NCES district ID
- 0614880
- Math proficiency
- 38% ▼ -14.00%
- Reading proficiency
- 65% ▲ 4.00%
- Median HH income
- $60,089
- Composite
- 44.89/100
- National rank
- #2715
- State rank
- #132 of 517 in CA
Livability — Santa Ana
- Score
- 55/100
- State rank
- #871
- US rank
- #23502
Category grades
Schools grade is shown separately in the Schools card above.
Census & demographics
- Census place
- Santa Ana, CA
- County
- Orange County · 3,096,323 people
- City population
- 288,255
- Metro
- Los Angeles-Long Beach-Anaheim, CA
- Population (ZIP)
- 82,120
- Household income
- $99,777
- Rent vs Own
- Severe rent burden
- 2188.0
Population outlook (Orange County) Hauer SSP2
- Today (2025)
- 3,477,456 people
- By 2030
- 3,613,117 · +3.9%
- By 2040
- 3,835,945 · +10.3%
- By 2050
- 3,968,736 · +14.1%
- By 2075
- 4,097,053 · +17.8%
- By 2100
- 3,903,633 · +12.3%
Race, ethnicity, and origin ACS 2023
- Neighborhood character
- Predominantly Hispanic (71%)
- Race & ethnicity
- Hispanic / Latino 71% Asian 18% Two or more races 17% White 9% Native American 2%
- Hispanic origin (detail)
- Mexican 65%
- Common ancestry
- Italian 1%
- Foreign-born
- 44% · Canada, Vietnam, China
- Languages at home
- 22% English-only · Spanish 61% Vietnamese 13% Other Asian/Pacific 2%
Political lean MEDSL · Orange
- 2024 margin
- Toss-up / Even · D 49.7% · R 47.1% · Other 3.2%
- 2008→2024 swing
- +5.2pp toward D · 2008: -2.6pp · 2024: 2.6pp
- All cycles
- 2024: D+2.6 2020: D+9.0 2016: D+7.7 2012: R+8.3 2008: R+2.6
Not yet ingested
- Civics
- —
Market trends
- HPI YoY
- ▼ -991.35%
- Current HPI
- 449.8874
- Rent YoY
- ▲ 2.16%
- Metro
- Los Angeles-Long Beach-Anaheim, CA
- State GDP YoY
- ▲ 3.21%
- F500 in state
- 116
Industry mix (Fortune 500 HQ in CA)
| Industry | F500 HQs | Revenue |
|---|---|---|
| Technology | 27 | $1,492B |
|
||
| Financial Services | 3 | $174B |
|
||
| Retail | 3 | $44B |
|
||
| Insurance | 3 | $26B |
|
||
| Media / Entertainment | 2 | $115B |
|
||
| Pharmaceuticals / Biotech | 2 | $62B |
|
||
Price history
-5.4% since first listed5 events — show timeline
- 2026-03-31 Price Changed $175,000 CRMLS
- 2026-03-11 Price Changed $184,000 CRMLS
- 2026-03-11 Price Changed $172,000 CRMLS
- 2026-03-07 Listed $185,000 CRMLS
- 2026-03-06 Coming Soon $185,000 CRMLS
Property tax history
+0.5%/yrLatest (2025): $47 · +0.5% YoY. Source: county tax records.
Cash-flow waterfall
monthlySold comps — $/sqft
last 12 mo · ≤1 miLoading sold comps…