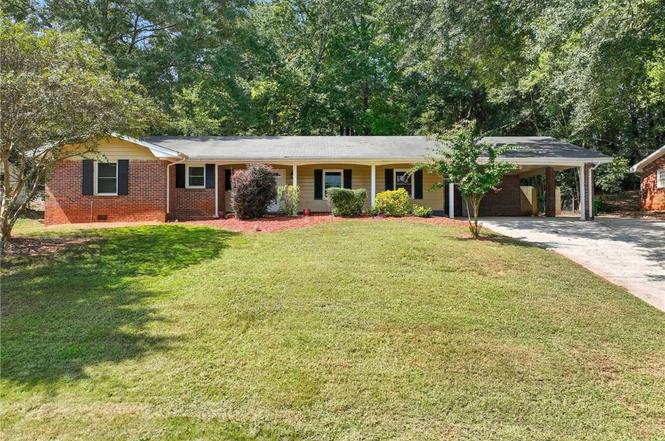
2393 Winshire Dr · Stonecrest, GA
Flood risk 1/10 · Minimal
- FEMA flood zone
- X (unshaded)
- Chance of flooding over 30 yrs
- 0.0%
- Est. flood insurance / yr
- $507 – $1,088
Fire risk 1/10 · Minimal
- Est. fire insurance / yr
- $963 – $1,789
Heat risk 6/10 · Moderate
- Hot days now (above 105°F)
- 7 days/yr
- Hot days in 30 yrs
- 18 days/yr
Wind risk 5/10 · Moderate
- Chance of severe wind over 30 yrs
- 26.0%
Air-quality risk 5/10 · Moderate
- Unhealthy air days now
- 7 days/yr
- Unhealthy air days in 30 yrs
- 10 days/yr
Risk factors via First Street. Map © Google.
Why this score? — see what drove the D+ grade
The composite is a weighted blend of 9 inputs, each scored 0–100. Each bar is that input's sub-score; the figure is the points it added to the 100-point composite (weight × sub-score).
- Cash flow +14.6/30.0
- ARV discount +14.0/15.0
- 1% rule +4.7/10.0
- DSCR +4.4/10.0
- Rent growth +2.7/5.0
- Livability +2.5/5.0
- Condition / age +2.5/5.0
- Schools +2.1/10.0
- Appreciation +0.0/10.0
$230,000
🖨 Deal sheet 📄 Offer letter ✓ Due diligence
Listing remarks MLS
Four sided brick with side entry car port. Home boasts some upgrades! New front windows, Newer full HVAC system, Roof is only 4 years old. Fenced yard so bring the kids and pets!
Key facts
- 0.35 acre lot
- Garage
- Built 1965
Neighborhood map
What this means for you Summary
Snapshot
- This is a 4-bed/2.0-bath single-family listed at $230k.
Deal economics
- At list price, monthly cash flow is $53 ($640/yr) — positive.
- The deal already cash-flows at list — no discount required.
- To meet the 1% rule (rent ≥ 1% of price), the offer needs to be $223k (3.1% below list).
- Recommended offer: $202k (12.0% below list) — sets the bar for market timing.
- Cap rate 6.6% vs local median 5.1% in Stonecrest — meaningfully above typical; check what's discounted (condition, days-on-market, listing class) to confirm the premium yield is real.
Location & tenants
- Location reads: area grade D — affects rentability + tenant quality, not the cash-flow math above.
- Dekalb County (suburban): math 19% / reading 28% proficiency, ranked #125 of 174 in GA (top 72%) — low school quality limits family demand, transient renter base, plan for 1-2y turnover; 68% free/reduced lunch — lower-income household profile, screen leases tightly.
- Zoned schools: Canby Lane Elementary School (math 8% / reading 17%, grade F, #1,032 of 1,228 statewide, top 85%, 461 students, 100% FRL); Mary Mcleod Bethune Middle School (math 4% / reading 13%, grade F, #439 of 470 statewide, top 94%, 718 students, 100% FRL); Towers High School (math 2% / reading 12%, grade F, #385 of 424 statewide, top 92%, 764 students, 100% FRL) — zoned schools average 100% FRL vs 68% district-wide (32 pts higher); higher-poverty schools than district average — tighter screening recommended.
- Zoned-school proficiency averages 9% at this address vs 24% district-wide (-14 pts) — the specific schools serving this property underperform the Dekalb County average; the district grade overstates school quality for this exact location.
- Market conditions: Rents flat; 180 active listings in the ZIP; 40 comparable units currently listed for rent nearby; rentals lingering (median 44d on market — plan ~5-8 weeks vacancy on turnover, expect pricing pressure); 55% of comp listings sitting > 30 days — soft ceiling on asking rent; 1,240 units permitted in DeKalb County in 2024 (385 in 5+ unit buildings).
- This rent runs 40% of the median local income ($67k/yr) — at the standard rent-burdened threshold; future hikes will face affordability resistance.
Forward outlook
- Local home prices are declining (-3.0%/yr); year-one equity from $2k of loan paydown is wiped out by about $7k of value loss. Plan a longer hold.
- DeKalb County population projected at +28% by 2050 — long-run rental-demand tailwind backs the buy-and-hold thesis.
Negotiation context
- It's been on market 207 days — a 12% lower offer ($202k) is reasonable based on typical stale-listing flexibility.
- 4 sale attempts since 8y ago; this cycle's ask has dropped $35k (13%) from the opening price — seller is motivated, your offer sets the floor, not the list.
- Current owner paid $141k; list at $230k implies a 63% gain — meaningful room to come down on a strong offer.
Risks & watch-outs
- Climate carrying-cost: moderate wind risk, 26% chance of damaging wind over 30y; extreme-heat days projected 7→18/yr by 2055 (HVAC capex compounding) — expect insurance premiums to compound above CPI over the hold.
Questions for the listing agent
- It's been on market 207 days. Have you received any prior offers? Is the seller open to a 12% concession, seller financing, or rate buy-down credit?
- Built in 1965 — when were the roof, HVAC, electrical panel, plumbing, and water heater last replaced?
- Why hasn't it sold? Are there any deal-killer items the seller is aware of (foundation, flood, title, zoning, code violations)?
- Is there a deadline driving the sale (1031 exchange, divorce, estate, relocation)? That informs how much negotiation room exists.
- The area grade is low — what's the realistic commute time and amenity access for the typical tenant pool here? Any planned neighborhood developments (good or bad) we should know about?
- What's the average days-on-market for RENTAL listings here right now (not sales)? A rising rental-DOM trend means longer vacancies and softer asking-rent achievability than the comps imply.
- What's the recent tenant-quality profile in this submarket — average credit score on applications, eviction rate, late-payment / NSF rate, and stable-employment percentage? A property-management company in the area should have these aggregated.
- How much new for-sale + rental construction is in the pipeline within 1–3 miles? Heavy new supply typically softens prices + rents 12–24 months out; constrained supply supports both.
Investment metrics
- 1% rule
- 0.97% ✗
- Cap rate
- 6.57%
- Cash-on-cash
- 0.99%
- DSCR
- 1.04
- GRM
- 8.6
CMA / ARV
- ARV (on-the-fly)
- $268,629
- Comps found
- 12
Show comp detail 12 sales within ~0.75 mi
| Address | Dist | Beds/Ba | Sqft | Sold | Price | $/sf | Match |
|---|---|---|---|---|---|---|---|
| 2393 Winshire Dr | 0.00mi | 4/2.0 | 1,779 (0%) | 1mo | $220,000 | $124 | 100 |
| 2401 Winshire Dr | 0.02mi | 3/2.0 (-1) | 1,632 (-8%) | 5mo | $260,000 | $159 | 76 |
| 2327 Greenway Dr | 0.57mi | 4/2.0 | 1,684 (-5%) | 2mo | $160,000 | $95 | 63 |
| 2380 Greenway Dr | 0.56mi | 4/3.5 | 1,844 (+4%) | 1mo | $279,000 | $151 | 61 |
| 4190 Wingfoot Ct | 0.50mi | 3/3.0 (-1) | 1,716 (-4%) | 3mo | $283,000 | $165 | 60 |
| 2347 Greenway Dr | 0.59mi | 3/3.0 (-1) | 1,771 (-0%) | 6mo | $165,000 | $93 | 58 |
| 2256 Greenway Dr | 0.61mi | 4/3.0 | 1,664 (-6%) | 8mo | $315,000 | $189 | 50 |
| 4312 Pleasant Forest Dr | 0.71mi | 4/2.0 | 1,902 (+7%) | 8mo | $215,000 | $113 | 49 |
| 4379 Cross Ln | 0.58mi | 5/3.0 (+1) | 1,957 (+10%) | 3mo | $294,900 | $151 | 45 |
| 2428 Marsh Rabbit Bnd | 0.58mi | 3/2.5 (-1) | 2,000 (+12%) | 3mo | $306,000 | $153 | 42 |
| 4105 Emerald Lake Dr | 0.68mi | 3/2.0 (-1) | 1,544 (-13%) | 4mo | $240,000 | $155 | 38 |
| 4579 Tudor Castle Dr | 0.70mi | 3/2.0 (-1) | 1,534 (-14%) | 4mo | $155,000 | $101 | 36 |
Match score weights: distance 35% · size 25% · config 20% · recency 20%. Top-matched comps best support the ARV.
Projected returns pro-forma
-3.0% appreciation · 0.87% rent growth · sell at horizon
- IRR
- -17.3%
- Equity multiple
- 0.40×
- Total profit
- $-38,441
- Equity at exit
- $34,294
- IRR
- -14.1%
- Equity multiple
- 0.27×
- Total profit
- $-47,051
- Equity at exit
- $19,886
Cash invested: $64,400 (down + closing). Projections, not guarantees.
Landlord ↔ Tenant lean methodology
- Overall (STATE)
- 90 Strongly Landlord-Friendly
- State Georgia
- 90 Strongly Landlord-Friendly · R+3
- County
- — inherits STATE
- City
- — inherits STATE
ZIP-level market 30035
- Home prices YoY
- -33.8%
- Rents YoY
- 0.9%
- Active inventory
- 180
- Price-to-rent
- 8.6×
Monthly cashflow live
- Estimated rent
- $2,228 high interval (Pro) →
- Mortgage (P&I)
- −$1,206
- Tax from tax record
- −$405 /mo · $4,857/yr
- Insurance
- −$96
- HOA
- −$0
- Vacancy / Maint / Mgmt
- −$468
- Net cashflow
- $53
Break-even live
UW: 25.0% down · 7.5% · 30yr · 1.5% tax · 5.0% vac · 8.0% maint · 8.0% mgmt
Financing live
Cash to close
- Down payment
- $57,500
- Closing costs
- $6,900
- Reserves months
- —
- Total cash needed
- —
Loan-product check · same deal, 3 products live
Conventional
25% down · 7.5% · 30yr
- Down + closing
- —
- Monthly P&I
- —
- Monthly cashflow
- —
- DSCR
- —
- Eligible?
- —
Personal DTI + credit; lowest rate.
DSCR
20% down · 8.5% · 30yr
- Down + closing
- —
- Monthly P&I
- —
- Monthly cashflow
- —
- DSCR
- —
- Eligible?
- —
No personal income docs; deal must DSCR.
Hard money
10% down · 12.0% · 12mo
- Down + closing
- —
- Monthly P&I
- —
- Monthly cashflow
- —
- DSCR
- —
- Eligible?
- —
Short-term bridge; refi at stabilization.
Rent comps 40 comps
| Address | Beds | Baths | Sqft | Rent | $/sqft | DOM | Units | Dist |
|---|---|---|---|---|---|---|---|---|
| 4707 Riverwood Cir Decatur, GA | 3.0 | 2.0 | 1826 | $1,850 | $1.01 | 24d | 1 | 0.30mi |
| 2319 Wingfoot Pl Decatur, GA | 3.0 | 2.5 | 1840 | $1,800 | $0.98 | 44d | 1 | 0.48mi |
| 4433 Golf Vista Cir Decatur, GA | 3.0 | 2.5 | 1495 | $1,350 | $0.90 | 24d | 1 | 0.50mi |
| 4203 Wesley Hall Ln Decatur, GA | 4.0 | 3.0 | 2457 | $2,461 | $1.00 | 5d | 1 | 0.52mi |
| 4292 Callum Ct Decatur, GA | 3.0 | 2.5 | 1611 | $2,200 | $1.37 | 44d | 1 | 0.55mi |
| 4282 Callum Ct Decatur, GA | 3.0 | 2.5 | 1611 | $2,200 | $1.37 | 44d | 1 | 0.56mi |
| 4505 Dover Castle Dr Decatur, GA | 4.0 | 2.0 | 1532 | $1,923 | $1.26 | 44d | 1 | 0.59mi |
| 2692 Paxton PL #14 Decatur, GA | 3.0 | 2.5 | 1611 | $2,299 | $1.43 | 44d | 1 | 0.61mi |
| 4336 Pleasant Point Dr Decatur, GA | 1.0–3.0 | 1.0–2.0 | 1010 | $1,235 | $1.22 | 2d | 4 | 0.64mi |
| 4116 Snapfinger Way Decatur, GA | 4.0 | 2.0 | 1334 | $1,719 | $1.29 | 44d | 1 | 0.66mi |
| 5089 Galleon Xing Decatur, GA | 4.0 | 2.5 | 2488 | $2,460 | $0.99 | 44d | 1 | 0.83mi |
| 4085 Canby Ln Decatur, GA | 4.0 | 2.0 | 1400 | $1,650 | $1.18 | 44d | 1 | 0.86mi |
| 4033 Emerald North Cir Decatur, GA | 4.0 | 2.5 | 2000 | $2,061 | $1.03 | 17d | 1 | 0.96mi |
| 4066 Marble Arch Ct Decatur, GA | 3.0 | 2.0 | 1344 | $1,800 | $1.34 | 44d | 1 | 0.99mi |
| 2248 Emerald Springs Dr Decatur, GA | 3.0 | 2.0 | 1918 | $1,870 | $0.97 | 44d | 1 | 1.01mi |
| 4111 Northstrand Dr Decatur, GA | 3.0 | 3.0 | 2173 | $2,031 | $0.93 | 13d | 1 | 1.02mi |
| 2564 Treadway Dr Decatur, GA | 3.0 | 2.0 | 1927 | $2,950 | $1.53 | 44d | 1 | 1.04mi |
| 2293 Waters Run Decatur, GA | 4.0 | 2.5 | 2500 | $2,195 | $0.88 | 44d | 1 | 1.04mi |
| Ramblewood Cir , GA | 5.0 | 3.0 | 2187 | $4,000 | $1.83 | 44d | 1 | 1.06mi |
| 2481 Terrace Trl Decatur, GA | 3.0 | 3.0 | 1752 | $2,050 | $1.17 | 44d | 1 | 1.11mi |
| 2272 Ramblewood Cir Decatur, GA | 4.0 | 2.5 | 2198 | $2,111 | $0.96 | 5d | 1 | 1.13mi |
| 2525 Terrace Trl Unit 2525 Decatur, GA | 3.0 | 3.0 | 1593 | $1,850 | $1.16 | 13d | 1 | 1.14mi |
| 2351 Emerald Falls Dr Decatur, GA | 3.0 | 2.0 | 2400 | $1,696 | $0.71 | 44d | 1 | 1.16mi |
| 2563 Terrace Trl Decatur, GA | 3.0 | 3.0 | 1752 | $1,950 | $1.11 | 13d | 1 | 1.16mi |
| 2569 Terrace Trl Decatur, GA | 3.0 | 3.0 | 1752 | $1,800 | $1.03 | 44d | 1 | 1.16mi |
| 2553 Terrace Trl Unit 2553 Decatur, GA | 3.0 | 2.0 | 1865 | $1,950 | $1.05 | 13d | 1 | 1.20mi |
| 4909 Truitt Ln Decatur, GA | 3.0 | 2.0 | 1697 | $2,500 | $1.47 | 44d | 1 | 1.23mi |
| 2109 Newgate Dr Decatur, GA | 3.0 | 2.5 | 1701 | $1,850 | $1.09 | 44d | 1 | 1.23mi |
| 1859 Broadway St Decatur, GA | 3.0 | 2.5 | 1620 | $2,200 | $1.36 | 4d | 1 | 1.25mi |
| 2559 Walden Lake Dr Unit 1 Decatur, GA | 3.0 | 2.5 | 1464 | $2,000 | $1.37 | 44d | 1 | 1.25mi |
| 4919 Wilkins Station Dr Decatur, GA | 3.0 | 2.0 | 1770 | $2,161 | $1.22 | 21d | 1 | 1.25mi |
| 2545 Walden Lake Dr Unit 1 Decatur, GA | 3.0 | 2.5 | 1464 | $2,000 | $1.37 | 44d | 1 | 1.26mi |
| 3920 Wedgefield Cir Decatur, GA | 4.0 | 3.0 | 2325 | $2,500 | $1.08 | 24d | 1 | 1.27mi |
| 4908 Longview Walk Decatur, GA | 3.0 | 2.5 | 1480 | $2,000 | $1.35 | 44d | 1 | 1.33mi |
| 2878 Snapfinger Mnr Decatur, GA | 3.0 | 2.5 | 1670 | $1,780 | $1.07 | 3d | 1 | 1.34mi |
| 2937 Thompson Cir Decatur, GA | 3.0 | 2.0 | 1480 | $1,860 | $1.26 | 2d | 1 | 1.34mi |
| 4955 Windsor Downs Ln Decatur, GA | 4.0 | 2.0 | 1888 | $2,050 | $1.09 | 5d | 1 | 1.35mi |
| 4917 Longview Walk Decatur, GA | 3.0 | 2.5 | 1486 | $2,000 | $1.35 | 21d | 1 | 1.35mi |
| 2014 Manhattan Pkwy Decatur, GA | 3.0 | 2.5 | 1620 | $1,956 | $1.21 | 5d | 1 | 1.38mi |
| 2450 Northmill Ln Decatur, GA | 4.0 | 2.5 | 2046 | $2,135 | $1.04 | 44d | 1 | 1.42mi |
Listing history 18 events
-
2026-04-28status Pending
-
2026-04-23historical Active Under Contract
-
2026-02-09price $230,000
-
2025-10-02$265,000 Active
-
2025-09-26historical
-
2025-09-22historical $265,000
-
2025-09-21$265,000 New
-
2019-01-24soldstatus $141,000
-
2018-12-13soldstatus $141,000 Sold 178-char remark
Show marketing remark (178 chars)
Four sided brick with side entry car port. Home boasts some upgrades! New front windows, Newer full HVAC system, Roof is only 4 years old. Fenced yard so bring the kids and pets!
-
2018-12-13soldstatus $141,000 Sold
Show marketing remark (178 chars)
Four sided brick with side entry car port. Home boasts some upgrades! New front windows, Newer full HVAC system, Roof is only 4 years old. Fenced yard so bring the kids and pets!
-
2018-11-13status Under Contract
Show marketing remark (178 chars)
Four sided brick with side entry car port. Home boasts some upgrades! New front windows, Newer full HVAC system, Roof is only 4 years old. Fenced yard so bring the kids and pets!
-
2018-11-13status Pending 178-char remark
Show marketing remark (178 chars)
Four sided brick with side entry car port. Home boasts some upgrades! New front windows, Newer full HVAC system, Roof is only 4 years old. Fenced yard so bring the kids and pets!
-
2018-11-02price $144,900
-
2018-11-01price $144,900 178-char remark
Show marketing remark (178 chars)
Four sided brick with side entry car port. Home boasts some upgrades! New front windows, Newer full HVAC system, Roof is only 4 years old. Fenced yard so bring the kids and pets!
-
2018-10-15$150,000 Active 178-char remark
Show marketing remark (178 chars)
Four sided brick with side entry car port. Home boasts some upgrades! New front windows, Newer full HVAC system, Roof is only 4 years old. Fenced yard so bring the kids and pets!
-
2018-10-15$150,000 New
Show marketing remark (178 chars)
Four sided brick with side entry car port. Home boasts some upgrades! New front windows, Newer full HVAC system, Roof is only 4 years old. Fenced yard so bring the kids and pets!
-
2000-11-08soldstatus $109,000
-
1989-12-28soldstatus $76,500
ⓘ Source: listings_history table (triggers on properties + properties_extension) + one-shot
backfill from property_details.listing_events for pre-trigger history.
Tax reassessment forecast GA · Resets to sale price
- Current annual tax
- $4,857 · $405/mo
- Projected year-2 tax
- $4,857 · $405/mo
- Expected delta
- $0/yr ($0/mo · 0.0%)
ⓘ Screening estimate from a state-policy table — verify with the county assessor before closing.
Climate risk First Street
- Flood 1/10 Low FEMA zone X (unshaded) · 0% chance over 30 yrs
- Wildfire 1/10 Low
- Heat 6/10 Major 7 d/yr ≥105°F today · 18 d/yr by 30 yrs out
- Wind 5/10 Major 26% chance of damaging wind over 30 yrs
- Air quality 5/10 Major 7 unhealthy d/yr today · 10 by 30 yrs out
Nearby sold comps map
Loading sold comps map…
Walkable amenities ~0.75 mi
Loading nearby amenities…
Taxation est. · year 1
- Rental income
- $26,735
- − Mortgage interest
- −$12,884
- − Property taxes
- −$4,857
- − Insurance
- −$1,150
- − Repairs & maintenance
- −$2,139
- − Management
- −$2,139
- − Depreciation
- −$6,691
- Taxable loss
- −$3,124
- Est. tax savings @ 24.0%
- +$750
- After-tax cash flow
- $1,390/yr
For passive investors: Depreciation is non-cash, so a rental often shows a tax loss while cash-flowing — sheltering income. Rental losses are passive: they offset passive income freely, and up to $25,000/yr can offset ordinary (W-2) income if you actively participate and your MAGI is under $100k (phasing out to $0 by $150k); unused losses carry forward. On sale, claimed depreciation is recaptured at up to 25%, and gains may owe capital-gains tax (a 1031 exchange can defer both). Figures are a year-1 estimate at your 24.0% rate — not tax advice; consult a CPA.
Schools (NCES district)
- District
- Dekalb County
- NCES district ID
- 1301740
- Math proficiency
- 19% ▼ -12.00%
- Reading proficiency
- 28% ▼ -7.00%
- Median HH income
- $51,448
- Composite
- 20.92/100
- National rank
- #8482
- State rank
- #125 of 174 in GA
Livability — Stonecrest
No livability data for this city. (Only ~50 U.S. cities are tracked.)
Census & demographics
- County
- Dekalb County · 782,738 people
- City population
- 106,165
- Metro
- Atlanta-Sandy Springs-Alpharetta, GA
- Population (ZIP)
- 21,569
- Household income
- $66,799
- Rent vs Own
- Severe rent burden
- 1304.0
Population outlook (DeKalb County) Hauer SSP2
- Today (2025)
- 839,977 people
- By 2030
- 891,768 · +6.2%
- By 2040
- 988,894 · +17.7%
- By 2050
- 1,074,583 · +27.9%
- By 2075
- 1,245,026 · +48.2%
- By 2100
- 1,303,135 · +55.1%
Race, ethnicity, and origin ACS 2023
- Neighborhood character
- Predominantly Black (91%)
- Race & ethnicity
- Black 91% White 4% Hispanic / Latino 4% Two or more races 3%
- Common ancestry
- Italian 1% Swiss 0%
- Foreign-born
- 12% · Canada, Jamaica
- Languages at home
- 86% English-only · Spanish 4% French/Haitian/Cajun 2%
Political lean MEDSL · DeKalb
- 2024 margin
- Solid D (+64.8) · D 81.9% · R 17.1% · Other 1.0%
- 2008→2024 swing
- +6.1pp toward D · 2008: 58.6pp · 2024: 64.8pp
- All cycles
- 2024: D+64.8 2020: D+67.4 2016: D+64.8 2012: D+56.8 2008: D+58.6
Not yet ingested
- Civics
- —
Market trends
- HPI YoY
- ▼ -111.60%
- Current HPI
- 218.8323
- Rent YoY
- ▲ 0.87%
- Metro
- Atlanta-Sandy Springs-Alpharetta, GA
- State GDP YoY
- ▲ 2.66%
- F500 in state
- 28
Industry mix (Fortune 500 HQ in GA)
| Industry | F500 HQs | Revenue |
|---|---|---|
| Paper / Packaging | 2 | $29B |
|
||
| Retail | 1 | $160B |
|
||
| Transportation / Logistics | 1 | $91B |
|
||
| Airlines | 1 | $62B |
|
||
| Consumer Goods | 1 | $47B |
|
||
| Utilities | 1 | $25B |
|
||
Price history
+200.7% since first listed18 events — show timeline
- 2026-04-28 Pending — FMLS
- 2026-04-23 Contingent — FMLS
- 2026-02-09 Price Changed $230,000 FMLS
- 2025-10-02 Listed $265,000 FMLS
- 2025-09-26 Listing Removed — GAMLS
- 2025-09-22 Coming Soon $265,000 FMLS
- 2025-09-21 Listed $265,000 GAMLS
- 2019-01-24 Sold (Public Records) $141,000 Public Records
- 2018-12-13 Sold (MLS) $141,000 GAMLS
- 2018-12-13 Sold (MLS) $141,000 FMLS
- 2018-11-13 Pending — GAMLS
- 2018-11-13 Pending — FMLS
- 2018-11-02 Price Changed $144,900 GAMLS
- 2018-11-01 Price Changed $144,900 FMLS
- 2018-10-15 Listed $150,000 GAMLS
- 2018-10-15 Listed $150,000 FMLS
- 2000-11-08 Sold (Public Records) $109,000 Public Records
- 1989-12-28 Sold (Public Records) $76,500 Public Records
Property tax history
+17.0%/yrLatest (2025): $4,857 · +2.8% YoY. Source: county tax records.
Cash-flow waterfall
monthlySold comps — $/sqft
last 12 mo · ≤1 miLoading sold comps…