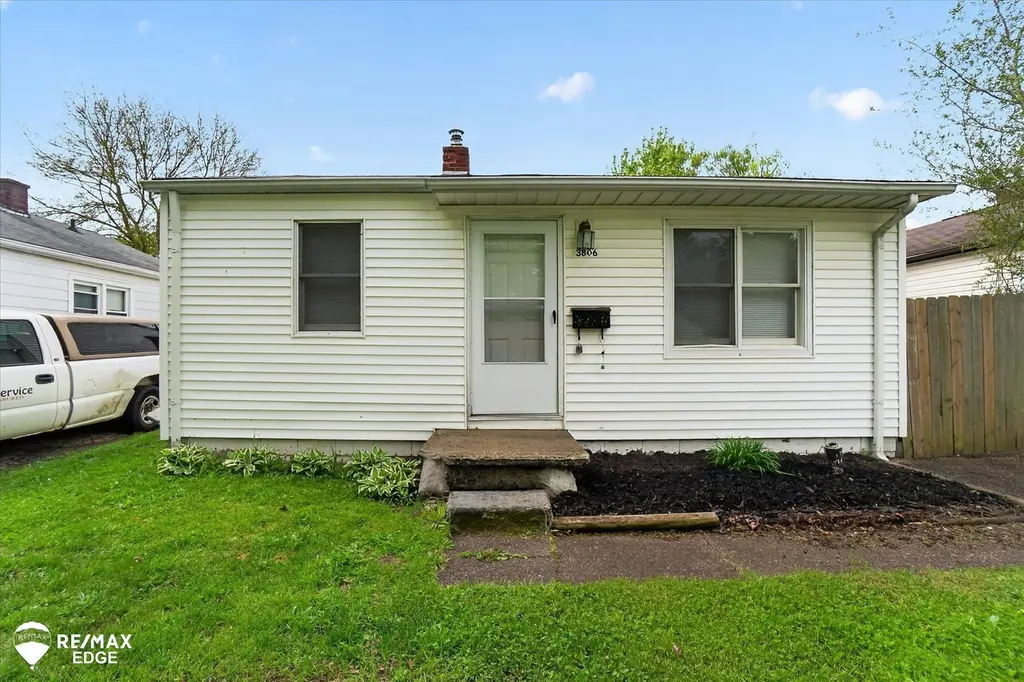
3806 Pitkin Ave · Flint, MI
Flood risk 1/10 · Minimal
- FEMA flood zone
- X (unshaded)
- Chance of flooding over 30 yrs
- 0.0%
- Est. flood insurance / yr
- $507 – $1,088
Fire risk 1/10 · Minimal
- Est. fire insurance / yr
- $784 – $1,456
Heat risk 2/10 · Minimal
- Hot days now (above 96°F)
- 7 days/yr
- Hot days in 30 yrs
- 15 days/yr
Wind risk 2/10 · Minimal
- Chance of severe wind over 30 yrs
- —
Air-quality risk 3/10 · Minor
- Unhealthy air days now
- 2 days/yr
- Unhealthy air days in 30 yrs
- 3 days/yr
Risk factors via First Street. Map © Google.
Why this score? — see what drove the B grade
The composite is a weighted blend of 9 inputs, each scored 0–100. Each bar is that input's sub-score; the figure is the points it added to the 100-point composite (weight × sub-score).
- Cash flow +30.0/30.0
- ARV discount +13.9/15.0
- 1% rule +10.0/10.0
- DSCR +10.0/10.0
- Livability +3.7/5.0
- Rent growth +2.5/5.0
- Condition / age +2.5/5.0
- Schools +1.1/10.0
- Appreciation +0.0/10.0
$48,500
🖨 Deal sheet 📄 Offer letter ✓ Due diligence
Listing remarks MLS
Why rent when you can buy this for cheaper than what you're paying in rent? Check out this amazing investment opportunity. Welcome home to this 2-bedroom 1-bathroom ranch home in Flint's Eastlawn neighborhood. This home features laundry right inside the back door, updated flooring, paint, and furnace (6 yrs), and a fenced yard. The detached 1.5 car garage provides extra storage room. Close to shopping, schools, parks, expressways, and Star-lite Coney Island! Schedule your appointment today!
Key facts
- Fenced yard
- Updated flooring
- Laundry right inside
Tags
Property features AI
Finance
- Other: Residential property in EASTLAWN subdivision; Cross streets: Center & Davison
- HOA & community: Homeowners association present
Exterior
- Parking: Detached garage (1 car); On-street parking; Assigned parking; Lighted parking
- Utilities: Public water; Public sewer
- Home design: Single-family residence; One level
- Construction: Vinyl siding
- Exterior features: Deck; Patio; Porch; Fenced yard; Public maintained paved road; Lot approximately 40 x 100 (0.09 acres)
Interior
- Kitchen: Oven; Range
- Bedrooms: 5 total rooms (includes bedrooms and living spaces)
- Bathrooms: 1 full bathroom
- Heating & cooling: Forced air heating; Natural gas heating; No central cooling
- Interior features: Entrance foyer; Crawl space basement
- Laundry & utility: Washer; Dryer; Gas water heater
Neighborhood map
What this means for you Summary
Snapshot
- This is a 2-bed/1.0-bath single-family listed at $48k.
Deal economics
- At list price, monthly cash flow is $322 ($4k/yr) — positive.
- The deal already cash-flows at list — no discount required.
- Meets the 1% rule at list price ($847 rent vs $48k).
- Recommended offer: $48k (1.5% below list) — sets the bar for market timing.
- Cap rate 14.3% vs local median 11.5% in Flint — meaningfully above typical; check what's discounted (condition, days-on-market, listing class) to confirm the premium yield is real.
Location & tenants
- Location reads 74/100 on livability (#196 in MI, #4,946 nationally) — a middle-class / working-renter tenant base. Strengths: commute A+, cost of living A+, housing A+; Watch: schools F, crime F, employment F.
- Flint School District (urban): math 7% / reading 13% proficiency, ranked #714 of 760 in MI (top 94%) — low school quality limits family demand, transient renter base, plan for 1-2y turnover; 83% free/reduced lunch — lower-income household profile, screen leases tightly.
- Market conditions: 202 active listings in the ZIP; 3 comparable units currently listed for rent nearby; rentals leasing fast (median 14d on market — plan ~1-2 weeks tenant-placement turnaround); 419 units permitted in Genesee County in 2024 (68 in 5+ unit buildings).
Forward outlook
- Local home prices are declining (-3.0%/yr); year-one equity from $335 of loan paydown is wiped out by about $1k of value loss. Plan a longer hold.
- Genesee County population projected at -27% by 2050 — secular population decline; favor cash flow + early exit over multi-decade hold.
- At projected returns (-3.0% appreciation + 3.0% rent growth), your $14k cash investment doubles in ~5 years — after that, you're playing with house money.
Negotiation context
- It's been on market 30 days — a 2% lower offer ($48k) is reasonable based on typical stale-listing flexibility.
- 6 sale attempts since 4y ago with the ask held roughly flat each time — persistent listings suggest the price (not the market) is what's stuck; bring a comps-based counter.
Risks & watch-outs
- Watch-outs: built in 1956 — expect roof / HVAC / electrical / plumbing capex.
Questions for the listing agent
- Built in 1956 — when were the roof, HVAC, electrical panel, plumbing, and water heater last replaced?
- Is there a deadline driving the sale (1031 exchange, divorce, estate, relocation)? That informs how much negotiation room exists.
- Schools are F-rated, which usually means shorter tenancies and higher turnover. Who's the typical renter profile here, and what's been the actual vacancy rate?
- Crime grade is F in this area — have there been break-ins, vandalism, or insurance claims at this property in the last 3 years? What carrier currently insures it and at what premium?
- What's the average days-on-market for RENTAL listings here right now (not sales)? A rising rental-DOM trend means longer vacancies and softer asking-rent achievability than the comps imply.
- What's the recent tenant-quality profile in this submarket — average credit score on applications, eviction rate, late-payment / NSF rate, and stable-employment percentage? A property-management company in the area should have these aggregated.
- How much new for-sale + rental construction is in the pipeline within 1–3 miles? Heavy new supply typically softens prices + rents 12–24 months out; constrained supply supports both.
Investment metrics
- 1% rule
- 1.75% ✓
- Cap rate
- 14.25%
- Cash-on-cash
- 28.43%
- DSCR
- 2.26
- GRM
- 4.8
CMA / ARV
- ARV (on-the-fly)
- $56,604
- Comps found
- 6
Show comp detail 6 sales within ~0.75 mi
| Address | Dist | Beds/Ba | Sqft | Sold | Price | $/sf | Match |
|---|---|---|---|---|---|---|---|
| 2074 N Center Rd | 0.33mi | 2/1.0 | 672 (+6%) | 1mo | $80,000 | $119 | 75 |
| 3739 Marmion Ave | 0.14mi | 2/1.0 | 672 (+6%) | 17mo | $39,000 | $58 | 70 |
| 2002 Branch Rd | 0.61mi | 1/1.0 (-1) | 628 (-1%) | 3mo | $30,000 | $48 | 62 |
| 3505 Pitkin Ave | 0.24mi | 2/1.0 | 672 (+6%) | 24mo | $60,000 | $89 | 60 |
| 3128 Holly Ave | 0.60mi | 2/1.0 | 660 (+4%) | 17mo | $35,900 | $54 | 51 |
| 3201 Holly Ave | 0.59mi | 2/1.0 | 680 (+7%) | 12mo | $65,000 | $96 | 50 |
Match score weights: distance 35% · size 25% · config 20% · recency 20%. Top-matched comps best support the ARV.
Projected returns pro-forma
-3.0% appreciation · 3.0% rent growth · sell at horizon
- IRR
- 22.7%
- Equity multiple
- 1.93×
- Total profit
- $12,652
- Equity at exit
- $7,232
- IRR
- 30.7%
- Equity multiple
- 3.76×
- Total profit
- $37,485
- Equity at exit
- $4,193
Cash invested: $13,580 (down + closing). Projections, not guarantees.
Landlord ↔ Tenant lean methodology
- Overall (STATE)
- 62 Landlord-Friendly
- State Michigan
- 62 Landlord-Friendly · EVEN
- County
- — inherits STATE
- City
- — inherits STATE
ZIP-level market 48506
- Active inventory
- 202
- Price-to-rent
- 4.8×
Monthly cashflow live
- Estimated rent
- $847 medium interval (Pro) →
- Mortgage (P&I)
- −$254
- Tax from tax record
- −$73 /mo · $872/yr
- Insurance
- −$20
- HOA
- −$0
- Vacancy / Maint / Mgmt
- −$178
- Net cashflow
- $322
Break-even live
UW: 25.0% down · 7.5% · 30yr · 1.5% tax · 5.0% vac · 8.0% maint · 8.0% mgmt
Financing live
Cash to close
- Down payment
- $12,125
- Closing costs
- $1,455
- Reserves months
- —
- Total cash needed
- —
Loan-product check · same deal, 3 products live
Conventional
25% down · 7.5% · 30yr
- Down + closing
- —
- Monthly P&I
- —
- Monthly cashflow
- —
- DSCR
- —
- Eligible?
- —
Personal DTI + credit; lowest rate.
DSCR
20% down · 8.5% · 30yr
- Down + closing
- —
- Monthly P&I
- —
- Monthly cashflow
- —
- DSCR
- —
- Eligible?
- —
No personal income docs; deal must DSCR.
Hard money
10% down · 12.0% · 12mo
- Down + closing
- —
- Monthly P&I
- —
- Monthly cashflow
- —
- DSCR
- —
- Eligible?
- —
Short-term bridge; refi at stabilization.
Rent comps 3 comps
| Address | Beds | Baths | Sqft | Rent | $/sqft | DOM | Units | Dist |
|---|---|---|---|---|---|---|---|---|
| 902 Burlington Dr Flint, MI | 1.0–2.0 | 1.0 | 850 | $998 | $1.17 | 13d | 4 | 0.91mi |
| 2621 Churchill Ave Flint, MI | 2.0 | 1.0 | 736 | $795 | $1.08 | 13d | 1 | 1.02mi |
| 3202 Western Rd Flint, MI | 1.0 | 1.0 | 500 | $645 | $1.29 | 13d | 1 | 1.26mi |
Listing history 32 events
-
2026-06-18days on market $48,500 Active 30 DOM
-
2026-06-17days on market $48,500 Active 29 DOM
-
2026-06-16days on market $48,500 Active 28 DOM
-
2026-06-15days on market $48,500 Active 27 DOM
-
2026-06-14days on market $48,500 Active 25 DOM
-
2026-06-13days on market $48,500 Active 24 DOM
-
2026-06-10days on market $48,500 Active 22 DOM
-
2026-06-09days on market $48,500 Active 21 DOM
-
2026-06-08days on market $48,500 Active 20 DOM
-
2026-06-07days on market $48,500 Active 19 DOM
-
2026-06-05days on market $48,500 Active 16 DOM
-
2026-06-03days on market $48,500 Active 15 DOM
-
2026-06-02days on market $48,500 Active 14 DOM
-
2026-06-01days on market $48,500 Active 13 DOM
-
2026-05-31days on market $48,500 Active 12 DOM
-
2026-05-30days on market $48,500 Active 11 DOM
-
2026-05-19$48,500 Active 497-char remark
Show marketing remark (497 chars)
Why rent when you can buy this for cheaper than what you're paying in rent? Check out this amazing investment opportunity. Welcome home to this 2-bedroom 1-bathroom ranch home in Flint's Eastlawn neighborhood. This home features laundry right inside the back door, updated flooring, paint, and furnace (6 yrs), and a fenced yard. The detached 1.5 car garage provides extra storage room. Close to shopping, schools, parks, expressways, and Star-lite Coney Island! Schedule your appointment today!
-
2026-05-19$48,500 Active
Show marketing remark (497 chars)
Why rent when you can buy this for cheaper than what you're paying in rent? Check out this amazing investment opportunity. Welcome home to this 2-bedroom 1-bathroom ranch home in Flint's Eastlawn neighborhood. This home features laundry right inside the back door, updated flooring, paint, and furnace (6 yrs), and a fenced yard. The detached 1.5 car garage provides extra storage room. Close to shopping, schools, parks, expressways, and Star-lite Coney Island! Schedule your appointment today!
-
2026-04-29historical
-
2026-04-29historical
-
2026-03-26price $48,500
-
2026-03-26price $48,500
-
2026-01-15price $49,900
-
2026-01-14price $49,900
-
2025-12-12price $52,900
-
2025-12-11price $52,900
-
2025-10-29$55,000 Active
-
2025-10-29$55,000 Active
-
2022-03-14historical
-
2022-03-14historical
-
2022-02-12$67,900 Active
-
2022-02-12$67,900 Active
ⓘ Source: listings_history table (triggers on properties + properties_extension) + one-shot
backfill from property_details.listing_events for pre-trigger history.
Tax reassessment forecast MI · Partial reset (capped growth)
- Current annual tax
- $872 · $73/mo
- Projected year-2 tax
- $872 · $73/mo
- Expected delta
- $0/yr ($0/mo · 0.0%)
ⓘ Screening estimate from a state-policy table — verify with the county assessor before closing.
Climate risk First Street
- Flood 1/10 Low FEMA zone X (unshaded) · 0% chance over 30 yrs
- Wildfire 1/10 Low
- Heat 2/10 Low 7 d/yr ≥96°F today · 15 d/yr by 30 yrs out
- Wind 2/10 Low
- Air quality 3/10 Moderate 2 unhealthy d/yr today · 3 by 30 yrs out
Nearby sold comps map
Loading sold comps map…
Walkable amenities ~0.75 mi
Loading nearby amenities…
Taxation est. · year 1
- Rental income
- $10,161
- − Mortgage interest
- −$2,717
- − Property taxes
- −$872
- − Insurance
- −$242
- − Repairs & maintenance
- −$813
- − Management
- −$813
- − Depreciation
- −$1,411
- Taxable income
- $3,293
- Est. tax owed @ 24.0%
- −$790
- After-tax cash flow
- $3,070/yr
For passive investors: Depreciation is non-cash, so a rental often shows a tax loss while cash-flowing — sheltering income. Rental losses are passive: they offset passive income freely, and up to $25,000/yr can offset ordinary (W-2) income if you actively participate and your MAGI is under $100k (phasing out to $0 by $150k); unused losses carry forward. On sale, claimed depreciation is recaptured at up to 25%, and gains may owe capital-gains tax (a 1031 exchange can defer both). Figures are a year-1 estimate at your 24.0% rate — not tax advice; consult a CPA.
Schools (NCES district)
- District
- Flint School District
- NCES district ID
- 2614520
- Math proficiency
- 7% ▬ 0.00%
- Reading proficiency
- 13% ▲ 3.00%
- Median HH income
- $25,954
- Composite
- 10.97/100
- National rank
- #14642
- State rank
- #714 of 760 in MI
Livability — Flint
- Score
- 74/100
- State rank
- #196
- US rank
- #4946
Category grades
Schools grade is shown separately in the Schools card above.
Census & demographics
- Census place
- Flint, MI
- County
- Genesee County · 221,329 people
- City population
- 93,814
- Metro
- Flint, MI
- Population (ZIP)
- 24,712
- Household income
- $47,929
- Rent vs Own
- Severe rent burden
- 954.0
Population outlook (Genesee County) Hauer SSP2
- Today (2025)
- 381,312 people
- By 2030
- 362,731 · -4.9%
- By 2040
- 321,550 · -15.7%
- By 2050
- 279,212 · -26.8%
- By 2075
- 193,336 · -49.3%
- By 2100
- 128,118 · -66.4%
Race, ethnicity, and origin ACS 2023
- Neighborhood character
- Predominantly White (76%)
- Race & ethnicity
- White 76% Black 9% Hispanic / Latino 8% Two or more races 7%
- Hispanic origin (detail)
- Mexican 6%
- Common ancestry
- Lithuanian 6% Romanian 4% Slovak 3%
- Foreign-born
- 3% · Canada
- Languages at home
- 96% English-only · Spanish 3%
Political lean MEDSL · Genesee
- 2024 margin
- Toss-up / Even · D 51.4% · R 47.2% · Other 1.4%
- 2008→2024 swing
- -28.3pp toward R · 2008: 32.5pp · 2024: 4.2pp
- All cycles
- 2024: D+4.2 2020: D+9.3 2016: D+9.5 2012: D+28.2 2008: D+32.5
Not yet ingested
- Civics
- —
Market trends
- HPI YoY
- ▼ -173.31%
- Current HPI
- 90.0494
- Rent YoY
- —
- Metro
- Flint, MI
- State GDP YoY
- ▲ 1.37%
- F500 in state
- 28
Industry mix (Fortune 500 HQ in MI)
| Industry | F500 HQs | Revenue |
|---|---|---|
| Automotive Parts | 3 | $48B |
|
||
| Automotive | 2 | $372B |
|
||
| Chemicals | 1 | $45B |
|
||
| Automotive Retail | 1 | $29B |
|
||
| Healthcare / Medical Devices | 1 | $23B |
|
||
| Automotive Technology | 1 | $20B |
|
||
Price history
-28.6% since first listed16 events — show timeline
- 2026-05-19 Listed $48,500 REALCOMP
- 2026-05-19 Listed $48,500 MiRealSource-MiMLS
- 2026-04-29 Listing Removed — REALCOMP
- 2026-04-29 Listing Removed — MiRealSource-MiMLS
- 2026-03-26 Price Changed $48,500 MiRealSource-MiMLS
- 2026-03-26 Price Changed $48,500 REALCOMP
- 2026-01-15 Price Changed $49,900 MiRealSource-MiMLS
- 2026-01-14 Price Changed $49,900 REALCOMP
- 2025-12-12 Price Changed $52,900 MiRealSource-MiMLS
- 2025-12-11 Price Changed $52,900 REALCOMP
- 2025-10-29 Listed $55,000 REALCOMP
- 2025-10-29 Listed $55,000 MiRealSource-MiMLS
- 2022-03-14 Listing Removed — REALCOMP
- 2022-03-14 Listing Removed — MiRealSource-MiMLS
- 2022-02-12 Listed $67,900 MiRealSource-MiMLS
- 2022-02-12 Listed $67,900 REALCOMP
Property tax history
+1.9%/yrLatest (2025): $872 · +1.5% YoY. Source: county tax records.
Cash-flow waterfall
monthlySold comps — $/sqft
last 12 mo · ≤1 miLoading sold comps…