640 Janice Ct · Merritt Island, FL
Flood risk 9/10 · Severe
- FEMA flood zone
- X (unshaded)
- Chance of flooding over 30 yrs
- 0.99%
- Est. flood insurance / yr
- $507 – $1,088
Fire risk 5/10 · Moderate
- Est. fire insurance / yr
- $947 – $1,759
Heat risk 10/10 · Severe
- Hot days now (above 105°F)
- 7 days/yr
- Hot days in 30 yrs
- 23 days/yr
Wind risk 10/10 · Severe
- Chance of severe wind over 30 yrs
- 99.0%
Air-quality risk 1/10 · Minimal
- Unhealthy air days now
- 0 days/yr
- Unhealthy air days in 30 yrs
- 0 days/yr
Risk factors via First Street. Map © Google.
Why this score? — see what drove the D grade
The composite is a weighted blend of 9 inputs, each scored 0–100. Each bar is that input's sub-score; the figure is the points it added to the 100-point composite (weight × sub-score).
- Cash flow +12.8/30.0
- ARV discount +7.5/15.0
- Schools +4.7/10.0
- Rent growth +4.1/5.0
- DSCR +3.8/10.0
- Livability +3.5/5.0
- Condition / age +2.5/5.0
- 1% rule +2.4/10.0
- Appreciation +0.0/10.0
$375,000
🖨 Deal sheet (PDF) 📄 Offer letter ✓ Due diligence
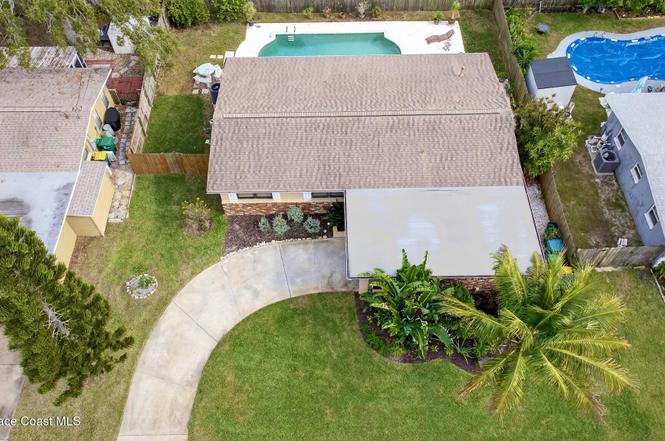
Listing remarks
MOTIVATED SELLER !!!!Enjoy the Florida lifestyle in this beautiful pool home located in a well-established Merritt Island neighborhood. Relax or entertain in style in your private outdoor oasis, featuring a sparkling pool and a fully fenced backyard. This property offers an unbeatable combination of prime location, top-rated schools, close proximity to shopping, and easy access to Florida's stunning beaches. Roof 2018, WH (gas) 2015 , AC 2013. Schedule your showing today!
Key facts
- Prime location
- Top-rated schools
- 7,405 sq ft lot
Tags
Neighborhood map
What this means for you Summary
Snapshot
- This is a 3-bed/2.0-bath single-family listed at $375k.
Deal economics
- At list price, monthly cash flow is $-98 ($-1k/yr) — negative.
- To cash-flow at today's rent, offer at most $358k (4.6% below list).
- To meet the 1% rule (rent ≥ 1% of price), the offer needs to be $277k (26.2% below list).
- Recommended offer: $277k (26.2% below list) — sets the bar for 1% rule.
Location & tenants
- Location reads 70/100 on livability (#441 in FL) — a middle-class / working-renter tenant base. Strengths: crime A+, housing A+, employment A-; Watch: amenities F, commute F, health & safety D-.
- Brevard (suburban): math 53% / reading 57% proficiency, ranked #19 of 73 in FL (top 26%) — acceptable for families but not a draw, mixed tenant base, ~2y average lease.
- Zoned schools: Audubon Elementary School (math 55% / reading 57%, grade C+, #832 of 2,144 statewide, top 40%, 450 students, 58% FRL); Thomas Jefferson Middle School (math 63% / reading 55%, grade B, #144 of 571 statewide, top 26%, 608 students, 43% FRL); Merritt Island High School (math 32% / reading 55%, grade F, #248 of 667 statewide, top 38%, 1,546 students, 35% FRL) — zoned schools at 45% FRL track the district average.
- Market conditions: Rents rising fast (+6.5%/yr); 230 active listings in the ZIP; 3 comparable units currently listed for rent nearby; rentals at typical pace (median 25d on market — plan ~3-4 weeks tenant-placement turnaround); solid renter incomes; 4,602 units permitted in Brevard County in 2024 (702 in 5+ unit buildings).
- This rent runs 32% of the median local income ($103k/yr) — at the standard rent-burdened threshold; future hikes will face affordability resistance.
Forward outlook
- Local home prices are declining (-3.0%/yr); year-one equity from $3k of loan paydown is wiped out by about $11k of value loss. Plan a longer hold.
- Brevard County population projected at +15% by 2050 — modest demand growth; plan on rents tracking national, not racing it.
Negotiation context
- It's been on market 94 days — a 9% lower offer ($341k) is reasonable based on typical stale-listing flexibility.
Risks & watch-outs
- Watch-outs: flood insurance adds $66/mo.
- Climate carrying-cost: severe flood risk; severe wind risk, 99% chance of damaging wind over 30y; moderate wildfire risk; extreme-heat days projected 7→23/yr by 2055 (HVAC capex compounding) — expect insurance premiums to compound above CPI over the hold.
Questions for the listing agent
- What do current leases actually rent for vs. the listed asking? Can we see a recent rent roll and the last 12 months of T-12 income?
- It's been on market 94 days. Have you received any prior offers? Is the seller open to a 26% concession, seller financing, or rate buy-down credit?
- Built in 1962 — when were the roof, HVAC, electrical panel, plumbing, and water heater last replaced?
- What's the actual annual flood-insurance premium (NFIP or private), and is the property in a SFHA with mandatory coverage?
- Why hasn't it sold? Are there any deal-killer items the seller is aware of (foundation, flood, title, zoning, code violations)?
- Is there a deadline driving the sale (1031 exchange, divorce, estate, relocation)? That informs how much negotiation room exists.
- Schools are B-rated — typically a magnet for longer-tenancy family renters. What's the average tenant stay here, and is there a school-zone premium baked into asking?
- The area grade is low — what's the realistic commute time and amenity access for the typical tenant pool here? Any planned neighborhood developments (good or bad) we should know about?
- What's the average days-on-market for RENTAL listings here right now (not sales)? A rising rental-DOM trend means longer vacancies and softer asking-rent achievability than the comps imply.
- What's the recent tenant-quality profile in this submarket — average credit score on applications, eviction rate, late-payment / NSF rate, and stable-employment percentage? A property-management company in the area should have these aggregated.
- How much new for-sale + rental construction is in the pipeline within 1–3 miles? Heavy new supply typically softens prices + rents 12–24 months out; constrained supply supports both.
Investment metrics
- 1% rule
- 0.74% ✗
- Cap rate
- 6.19%
- Cash-on-cash
- -0.36%
- DSCR
- 0.98
- GRM
- 11.3
CMA / ARV
No comps found within radius.
Projected returns pro-forma
-3.0% appreciation · 6.53% rent growth · sell at horizon
- IRR
- -14.8%
- Equity multiple
- 0.46×
- Total profit
- $-56,984
- Equity at exit
- $55,914
- IRR
- -1.6%
- Equity multiple
- 0.87×
- Total profit
- $-13,357
- Equity at exit
- $32,423
Cash invested: $105,000 (down + closing). Projections, not guarantees.
Landlord ↔ Tenant lean methodology
- Overall (STATE)
- 87 Strongly Landlord-Friendly
- State Florida
- 87 Strongly Landlord-Friendly · R+3
- County
- — inherits STATE
- City
- — inherits STATE
ZIP-level market 32952
- Rents YoY
- 6.5%
- Active inventory
- 230
- Price-to-rent
- 11.3×
Monthly cashflow live
- Estimated rent
- $2,767 medium interval (Pro) →
- Mortgage (P&I)
- −$1,967
- Tax from tax record
- −$95 /mo · $1,138/yr
- Insurance
- −$156
- Flood insurance flood zone
- −$66 /mo · $798/yr
- HOA
- −$0
- Vacancy / Maint / Mgmt
- −$581
- Net cashflow
- $-98
Break-even live
Sensitivity live
| Price | -10% $114 | -5% $8 | +0% $-98 | +5% $-204 | +10% $-310 |
|---|---|---|---|---|---|
| Rent | -10% $-317 | -5% $-207 | +0% $-98 | +5% $11 | +10% $121 |
| Rate | -1.0pp $91 | -0.5pp $-3 | base $-98 | +0.5pp $-195 | +1.0pp $-294 |
UW: 25.0% down · 7.5% · 30yr · 1.5% tax · 5.0% vac · 8.0% maint · 8.0% mgmt
Financing live
Cash to close
- Down payment
- $93,750
- Closing costs
- $11,250
- Reserves months
- —
- Total cash needed
- —
Loan-product check · same deal, 3 products live
Conventional
25% down · 7.5% · 30yr
- Down + closing
- —
- Monthly P&I
- —
- Monthly cashflow
- —
- DSCR
- —
- Eligible?
- —
Personal DTI + credit; lowest rate.
DSCR
20% down · 8.5% · 30yr
- Down + closing
- —
- Monthly P&I
- —
- Monthly cashflow
- —
- DSCR
- —
- Eligible?
- —
No personal income docs; deal must DSCR.
Hard money
10% down · 12.0% · 12mo
- Down + closing
- —
- Monthly P&I
- —
- Monthly cashflow
- —
- DSCR
- —
- Eligible?
- —
Short-term bridge; refi at stabilization.
Rent comps 3 comps
| Address | Beds | Baths | Sqft | Rent | $/sqft | DOM | Units | Dist |
|---|---|---|---|---|---|---|---|---|
| 1315 Lester Ct Merritt Island, FL | 3.0 | 2.0 | 1462 | $2,350 | $1.61 | 25d | 1 | 0.37mi |
| 200 S Sykes Creek Pkwy #702 Merritt Island, FL | 2.0 | 2.0 | 1307 | $2,390 | $1.83 | 25d | 1 | 1.17mi |
| 215 Richland Ave Unit 1044313P Merritt Island, FL | 3.0 | 2.0 | 1184 | $4,648 | $3.93 | 16d | 1 | 1.50mi |
Listing history 3 events
-
2026-04-19status Pending
-
2026-03-16price $375,000
-
2026-01-13$399,900 Active
ⓘ Source: listings_history table (triggers on properties + properties_extension) + one-shot
backfill from property_details.listing_events for pre-trigger history.
Tax reassessment forecast FL · Resets to sale price
- Current annual tax
- $1,138 · $95/mo
- Projected year-2 tax
- $3,112 · $259/mo
- Expected delta
- +$1,975/yr (+$165/mo · 173.6%)
ⓘ Screening estimate from a state-policy table — verify with the county assessor before closing.
Climate risk First Street
- Flood 9/10 Extreme FEMA zone X (unshaded) · 99% chance over 30 yrs
- Wildfire 5/10 Major
- Heat 10/10 Extreme 7 d/yr ≥105°F today · 23 d/yr by 30 yrs out
- Wind 10/10 Extreme 99% chance of damaging wind over 30 yrs
- Air quality 1/10 Low 0 unhealthy d/yr today · 0 by 30 yrs out
Nearby sold comps map
Loading sold comps map…
Walkable amenities ~0.75 mi
Loading nearby amenities…
Taxation est. · year 1
- Rental income
- $33,205
- − Mortgage interest
- −$21,006
- − Property taxes
- −$1,138
- − Insurance
- −$2,672
- − Repairs & maintenance
- −$2,656
- − Management
- −$2,656
- − Depreciation
- −$10,909
- Taxable loss
- −$7,833
- Est. tax savings @ 24.0%
- +$1,880
- After-tax cash flow
- $703/yr
For passive investors: Depreciation is non-cash, so a rental often shows a tax loss while cash-flowing — sheltering income. Rental losses are passive: they offset passive income freely, and up to $25,000/yr can offset ordinary (W-2) income if you actively participate and your MAGI is under $100k (phasing out to $0 by $150k); unused losses carry forward. On sale, claimed depreciation is recaptured at up to 25%, and gains may owe capital-gains tax (a 1031 exchange can defer both). Figures are a year-1 estimate at your 24.0% rate — not tax advice; consult a CPA.
Schools (NCES district)
- District
- Brevard
- NCES district ID
- 1200150
- Math proficiency
- 53% ▼ -9.00%
- Reading proficiency
- 57% ▼ -4.00%
- Median HH income
- $49,426
- Composite
- 46.86/100
- National rank
- #2370
- State rank
- #19 of 73 in FL
Livability — Merritt Island
- Score
- 70/100
- State rank
- #441
- US rank
- #7878
Category grades
Schools grade is shown separately in the Schools card above.
Census & demographics
- Census place
- Merritt Island, FL
- County
- Brevard County · 602,871 people
- City population
- 24,834
- Metro
- Palm Bay-Melbourne-Titusville, FL
- Population (ZIP)
- 21,613
- Household income
- $102,726
- Rent vs Own
- Severe rent burden
- 199.0
Population outlook (Brevard County) Hauer SSP2
- Today (2025)
- 623,254 people
- By 2030
- 648,420 · +4.0%
- By 2040
- 690,009 · +10.7%
- By 2050
- 715,669 · +14.8%
- By 2075
- 775,744 · +24.5%
- By 2100
- 776,687 · +24.6%
Race, ethnicity, and origin ACS 2023
- Neighborhood character
- Predominantly White (85%)
- Race & ethnicity
- White 85% Hispanic / Latino 6% Two or more races 6% Asian 2% Black 2%
- Hispanic origin (detail)
- Puerto Rican 4% Cuban 1%
- Common ancestry
- Romanian 3% Slovak 2% Lithuanian 1%
- Foreign-born
- 5% · Canada, China
- Languages at home
- 92% English-only · Spanish 4% Other Indo-European 1%
Political lean MEDSL · Brevard
- 2024 margin
- Strong R (+20.8) · D 39.1% · R 59.9% · Other 1.0%
- 2008→2024 swing
- -10.4pp toward R · 2008: -10.4pp · 2024: -20.8pp
- All cycles
- 2024: R+20.8 2020: R+16.4 2016: R+19.8 2012: R+12.7 2008: R+10.4
Not yet ingested
- Civics
- —
Market trends
- HPI YoY
- ▼ -177.56%
- Current HPI
- 323.6021
- Rent YoY
- ▲ 6.53%
- Metro
- Palm Bay-Melbourne-Titusville, FL
- State GDP YoY
- ▲ 3.28%
- F500 in state
- 36
Industry mix (Fortune 500 HQ in FL)
| Industry | F500 HQs | Revenue |
|---|---|---|
| Industrial Technology | 2 | $29B |
|
||
| Insurance | 2 | $17B |
|
||
| Retail | 1 | $60B |
|
||
| Technology Distribution | 1 | $58B |
|
||
| Homebuilding | 1 | $35B |
|
||
| Technology Manufacturing | 1 | $35B |
|
||
Price history
-6.2% since first listed3 events — show timeline
- 2026-04-19 Pending — SCMLS
- 2026-03-16 Price Changed $375,000 SCMLS
- 2026-01-13 Listed $399,900 SCMLS
Property tax history
+2.4%/yrLatest (2025): $1,138 · +11.1% YoY. Source: county tax records.
Cash-flow waterfall
monthlySold comps — $/sqft
last 12 mo · ≤1 miLoading sold comps…