15300 Palm Dr #14 · Desert Hot Springs, CA
Flood risk 1/10 · Minimal
- FEMA flood zone
- X (shaded)
- Chance of flooding over 30 yrs
- 0.0%
- Est. flood insurance / yr
- $507 – $1,088
Fire risk 6/10 · Moderate
- Est. fire insurance / yr
- $659 – $1,223
Heat risk 9/10 · Severe
- Hot days now (above 111°F)
- 7 days/yr
- Hot days in 30 yrs
- 18 days/yr
Wind risk 1/10 · Minimal
- Chance of severe wind over 30 yrs
- —
Air-quality risk 5/10 · Moderate
- Unhealthy air days now
- 8 days/yr
- Unhealthy air days in 30 yrs
- 11 days/yr
Risk factors via First Street. Map © Google.
Why this score? — see what drove the C+ grade
The composite is a weighted blend of 9 inputs, each scored 0–100. Each bar is that input's sub-score; the figure is the points it added to the 100-point composite (weight × sub-score).
- Cash flow +23.0/30.0
- ARV discount +14.2/15.0
- 1% rule +7.7/10.0
- DSCR +7.4/10.0
- Rent growth +3.4/5.0
- Schools +2.7/10.0
- Livability +2.5/5.0
- Condition / age +2.5/5.0
- Appreciation +0.0/10.0
$185,000
🖨 Deal sheet 📄 Offer letter ✓ Due diligence
Listing remarks MLS
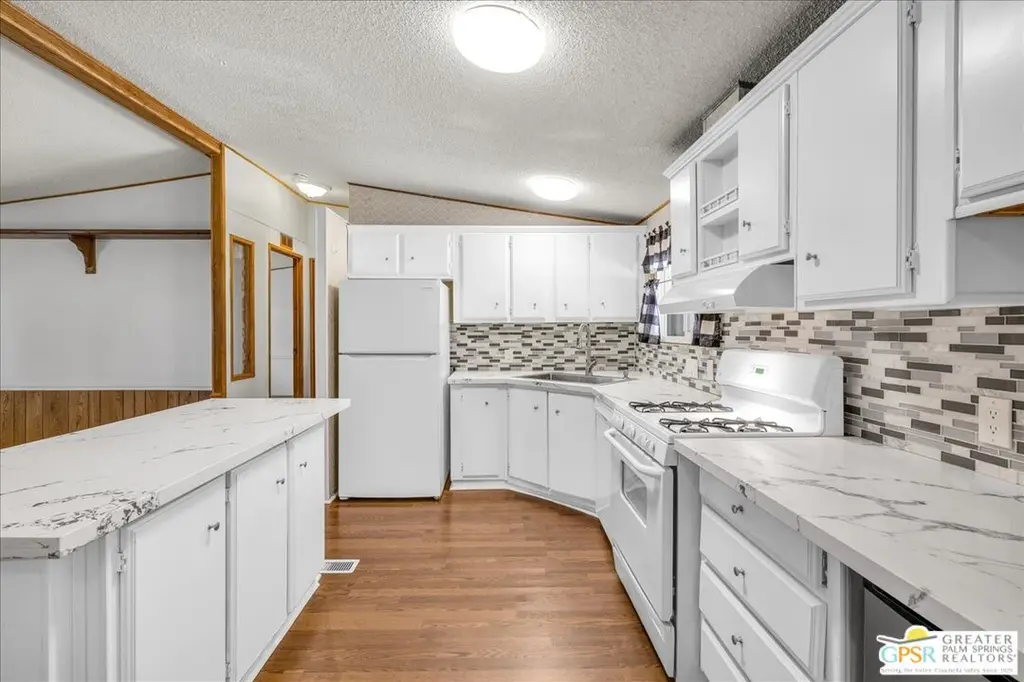
FEE LAND!!! you own the land!! Don't miss this excellent opportunity to live in the 55 plus, Resort Style community of Vista Montana. This home offers 1248 square feet of living area with 2 bedroom/2bathroom. This home boasts two primary bedrooms with ensuites. Access to bathroom from both bedrooms and are situated at opposite sides of the home. The kitchen has been upadated with new stone counter tops, new backsplash, farmers sink and new fixtures. There are newer dual pane windows throughout for added energy efficiency! There is a storage shed off of the extensive covered concrete carport! The Vista Montana community has excellent amenities which include, a large clubhouse with various rooms for different events like billards, card room, community event room, large kitchen for community and private events. The resort style pool and spas were recently resurfaced, the exercise room was recently refurbished. There is a gated dog park, BBQ area, a second smaller pool and wonderful walkways and common areas. This home has no 433A.
Key facts
- Farmers sink
- Updated kitchen
- New fixtures
Tags
Neighborhood map
What this means for you Summary
Snapshot
- This is a 2-bed/2.0-bath manufactured listed at $185k.
Deal economics
- At list price, monthly cash flow is $327 ($4k/yr) — positive.
- The deal already cash-flows at list — no discount required.
- Meets the 1% rule at list price ($2k rent vs $185k).
- Recommended offer: $168k (9.0% below list) — sets the bar for market timing.
- Cap rate 8.4% vs local median 4.0% in Desert Hot Springs — top-decile yield for the area; either an underpriced asset or a hidden risk that comps aren't pricing in. Stress-test before assuming the spread holds.
Location & tenants
- Location reads 49/100 on livability (#1,149 in CA) — a working-class tenant base; expect higher turnover. Strengths: housing B+; Watch: crime D+, schools F, amenities F.
- Palm Springs Unified (suburban): math 21% / reading 42% proficiency, ranked #328 of 517 in CA (top 63%) — families likely to look elsewhere, expect single-tenant / working-renter base with shorter leases; 73% free/reduced lunch — lower-income household profile, screen leases tightly.
- Market conditions: Rents rising (+3.7%/yr); 515 active listings in the ZIP; 14 comparable units currently listed for rent nearby; rentals lingering (median 44d on market — plan ~5-8 weeks vacancy on turnover, expect pricing pressure); 57% of comp listings sitting > 30 days — soft ceiling on asking rent; 9,195 units permitted in Riverside County in 2024 (1,512 in 5+ unit buildings).
- At $2,351/mo this rent would consume 52% of the median local household income ($54k/yr) (locally 2095% of renters already pay >50% of income on rent) — very limited rent-growth headroom before tenants either downsize or default.
Forward outlook
- Local home prices are declining (-3.0%/yr); year-one equity from $1k of loan paydown is wiped out by about $6k of value loss. Plan a longer hold.
- Riverside County population projected at +22% by 2050 — long-run rental-demand tailwind backs the buy-and-hold thesis.
Negotiation context
- It's been on market 114 days — a 9% lower offer ($168k) is reasonable based on typical stale-listing flexibility.
- 3 sale attempts since 7y ago with the ask held roughly flat each time — persistent listings suggest the price (not the market) is what's stuck; bring a comps-based counter.
- Current owner paid $91k; list at $185k implies a 103% gain — meaningful room to come down on a strong offer.
Risks & watch-outs
- Climate carrying-cost: major wildfire risk; extreme-heat days projected 7→18/yr by 2055 (HVAC capex compounding) — expect insurance premiums to compound above CPI over the hold.
Questions for the listing agent
- It's been on market 114 days. Have you received any prior offers? Is the seller open to a 9% concession, seller financing, or rate buy-down credit?
- What does the HOA fee cover, when was the last increase, and are there any pending special assessments or reserve-fund shortfalls?
- Why hasn't it sold? Are there any deal-killer items the seller is aware of (foundation, flood, title, zoning, code violations)?
- Is there a deadline driving the sale (1031 exchange, divorce, estate, relocation)? That informs how much negotiation room exists.
- Schools are F-rated, which usually means shorter tenancies and higher turnover. Who's the typical renter profile here, and what's been the actual vacancy rate?
- Crime grade is D in this area — have there been break-ins, vandalism, or insurance claims at this property in the last 3 years? What carrier currently insures it and at what premium?
- What's the average days-on-market for RENTAL listings here right now (not sales)? A rising rental-DOM trend means longer vacancies and softer asking-rent achievability than the comps imply.
- What's the recent tenant-quality profile in this submarket — average credit score on applications, eviction rate, late-payment / NSF rate, and stable-employment percentage? A property-management company in the area should have these aggregated.
- How much new for-sale + rental construction is in the pipeline within 1–3 miles? Heavy new supply typically softens prices + rents 12–24 months out; constrained supply supports both.
Investment metrics
- 1% rule
- 1.27% ✓
- Cap rate
- 8.41%
- Cash-on-cash
- 7.58%
- DSCR
- 1.34
- GRM
- 6.6
CMA / ARV
- ARV (median comp)
- $217,373
- List price
- $185,000
- Delta
- -14.89%
- Verdict
- UNDERPRICED
- Comps
- 20 within 1.0 mi
Show comp detail 12 sales within ~0.75 mi
| Address | Dist | Beds/Ba | Sqft | Sold | Price | $/sf | Match |
|---|---|---|---|---|---|---|---|
| 15300 Palm Dr #22 | 0.07mi | 2/2.0 | 1,272 (+2%) | 5mo | $219,000 | $172 | 90 |
| 15300 Palm Dr #30 | 0.09mi | 3/2.0 (+1) | 1,248 (0%) | 3mo | $200,000 | $160 | 88 |
| 15300 Palm Dr #45 | 0.18mi | 2/2.0 | 1,254 (+0%) | 6mo | $170,000 | $136 | 86 |
| 15300 Palm Dr #42 | 0.16mi | 2/2.0 | 1,178 (-6%) | 2mo | $230,000 | $195 | 82 |
| 15300 Palm Dr #138 | 0.12mi | 2/2.0 | 1,323 (+6%) | 3mo | $237,000 | $179 | 82 |
| 15300 Palm Dr #161 | 0.14mi | 2/2.0 | 1,333 (+7%) | 1mo | $233,000 | $175 | 81 |
| 15300 Palm Dr #255 | 0.04mi | 3/2.0 (+1) | 1,345 (+8%) | 2mo | $203,500 | $151 | 78 |
| 15300 Palm Dr #119 | 0.04mi | 3/2.0 (+1) | 1,344 (+8%) | 4mo | $220,000 | $164 | 77 |
| 15300 Palm Dr #209 | 0.20mi | 2/2.0 | 1,335 (+7%) | 3mo | $161,000 | $121 | 77 |
| 14777 Palm Dr #15 | 0.46mi | 2/2.0 | 1,260 (+1%) | 3mo | $180,000 | $143 | 75 |
| 15300 Palm Dr #35 | 0.09mi | 2/2.0 | 1,430 (+15%) | 5mo | $105,000 | $73 | 67 |
| 14777 Palm Dr #8 | 0.43mi | 3/2.0 (+1) | 1,404 (+12%) | 6mo | $229,000 | $163 | 49 |
Match score weights: distance 35% · size 25% · config 20% · recency 20%. Top-matched comps best support the ARV.
Projected returns pro-forma
-3.0% appreciation · 3.66% rent growth · sell at horizon
- IRR
- -3.8%
- Equity multiple
- 0.86×
- Total profit
- $-7,388
- Equity at exit
- $27,584
- IRR
- 6.9%
- Equity multiple
- 1.53×
- Total profit
- $27,696
- Equity at exit
- $15,995
Cash invested: $51,800 (down + closing). Projections, not guarantees.
Landlord ↔ Tenant lean methodology
- Overall (STATE)
- 18 Strongly Tenant-Friendly
- State California
- 18 Strongly Tenant-Friendly · D+13
- County
- — inherits STATE
- City
- — inherits STATE
ZIP-level market 92240
- Home prices YoY
- -19.6%
- Rents YoY
- 3.7%
- Active inventory
- 515
- Price-to-rent
- 6.6×
Monthly cashflow live
- Estimated rent
- $2,351 high interval (Pro) →
- Mortgage (P&I)
- −$970
- Tax from tax record
- −$154 /mo · $1,852/yr
- Insurance
- −$77
- HOA
- −$329
- Vacancy / Maint / Mgmt
- −$494
- Net cashflow
- $327
Break-even live
UW: 25.0% down · 7.5% · 30yr · 1.5% tax · 5.0% vac · 8.0% maint · 8.0% mgmt
Financing live
Cash to close
- Down payment
- $46,250
- Closing costs
- $5,550
- Reserves months
- —
- Total cash needed
- —
Loan-product check · same deal, 3 products live
Conventional
25% down · 7.5% · 30yr
- Down + closing
- —
- Monthly P&I
- —
- Monthly cashflow
- —
- DSCR
- —
- Eligible?
- —
Personal DTI + credit; lowest rate.
DSCR
20% down · 8.5% · 30yr
- Down + closing
- —
- Monthly P&I
- —
- Monthly cashflow
- —
- DSCR
- —
- Eligible?
- —
No personal income docs; deal must DSCR.
Hard money
10% down · 12.0% · 12mo
- Down + closing
- —
- Monthly P&I
- —
- Monthly cashflow
- —
- DSCR
- —
- Eligible?
- —
Short-term bridge; refi at stabilization.
Rent comps 14 comps
| Address | Beds | Baths | Sqft | Rent | $/sqft | DOM | Units | Dist |
|---|---|---|---|---|---|---|---|---|
| 15300 Palm Dr Desert Hot Springs, CA | 3.0 | 2.0 | 1458 | $2,800 | $1.92 | 44d | 1 | 0.12mi |
| 13987 El Cajon Dr Desert Hot Springs, CA | 3.0 | 2.0 | 1215 | $2,600 | $2.14 | 8d | 1 | 0.73mi |
| 13895 Luis Dr Desert Hot Springs, CA | 2.0 | 1.0 | 814 | $1,800 | $2.21 | 44d | 1 | 0.82mi |
| 13950 West Dr Unit B Desert Hot Springs, CA | 2.0 | 2.0 | 1008 | $1,600 | $1.59 | 2d | 1 | 0.87mi |
| 66590 Joseph Way Unit B Desert Hot Springs, CA | 2.0 | 1.0 | 785 | $2,295 | $2.92 | 24d | 1 | 0.89mi |
| 15490 Avenue Rambla Unit NA Desert Hot Springs, CA | 3.0 | 2.0 | 1088 | $2,600 | $2.39 | 24d | 1 | 0.92mi |
| 15490 Avenida Rambla Desert Hot Springs, CA | 3.0 | 2.0 | 1088 | $2,600 | $2.39 | 44d | 1 | 0.92mi |
| 13405 Ocotillo Rd Desert Hot Springs, CA | 2.0 | 1.0 | 864 | $1,750 | $2.03 | 2d | 1 | 0.98mi |
| 13715 El Rio Ln Desert Hot Springs, CA | 3.0 | 2.0 | 1318 | $2,600 | $1.97 | 8d | 1 | 1.10mi |
| 13322 El Rio Ln Desert Hot Springs, CA | 3.0 | 2.0 | 1215 | $2,750 | $2.26 | 44d | 1 | 1.23mi |
| 66434 Estrella Ave Desert Hot Springs, CA | 2.0 | 2.0 | 850 | $1,800 | $2.12 | 44d | 1 | 1.39mi |
| 66309 Desert View Ave Unit 1 Desert Hot Springs, CA | 2.0 | 1.0 | 800 | $1,650 | $2.06 | 44d | 1 | 1.43mi |
| 66299 Desert View Ave Desert Hot Springs, CA | 2.0 | 1.0 | 800 | $1,650 | $2.06 | 44d | 1 | 1.43mi |
| 66444 Desert View Ave Unit B Desert Hot Springs, CA | 3.0 | 2.0 | 1294 | $2,275 | $1.76 | 44d | 1 | 1.46mi |
HOA detail
- Monthly dues
- $329 · $3,948/yr
- Likely covers
- poolsecurity
Listing history 22 events
-
2026-06-18days on market $185,000 Active 114 DOM
-
2026-06-17days on market $185,000 Active 113 DOM
-
2026-06-16days on market $185,000 Active 112 DOM
-
2026-06-15days on market $185,000 Active 111 DOM
-
2026-06-13days on market $185,000 Active 109 DOM
-
2026-06-13days on market $185,000 Active 108 DOM
-
2026-06-09days on market $185,000 Active 105 DOM
-
2026-06-08days on market $185,000 Active 104 DOM
-
2026-06-07days on market $185,000 Active 103 DOM
-
2026-06-04days on market $185,000 Active 100 DOM
-
2026-06-03days on market $185,000 Active 99 DOM
-
2026-06-02days on market $185,000 Active 98 DOM
-
2026-06-01days on market $185,000 Active 97 DOM
-
2026-05-31days on market $185,000 Active 96 DOM
-
2026-02-24$185,000 Active 1043-char remark
Show marketing remark (1043 chars)
FEE LAND!!! you own the land!! Don't miss this excellent opportunity to live in the 55 plus, Resort Style community of Vista Montana. This home offers 1248 square feet of living area with 2 bedroom/2bathroom. This home boasts two primary bedrooms with ensuites. Access to bathroom from both bedrooms and are situated at opposite sides of the home. The kitchen has been upadated with new stone counter tops, new backsplash, farmers sink and new fixtures. There are newer dual pane windows throughout for added energy efficiency! There is a storage shed off of the extensive covered concrete carport! The Vista Montana community has excellent amenities which include, a large clubhouse with various rooms for different events like billards, card room, community event room, large kitchen for community and private events. The resort style pool and spas were recently resurfaced, the exercise room was recently refurbished. There is a gated dog park, BBQ area, a second smaller pool and wonderful walkways and common areas. This home has no 433A.
-
2025-08-08Active
-
2019-06-04soldstatus $91,000 Closed
-
2019-06-04soldstatus $91,000 Sold
-
2019-06-02status Pending
-
2019-04-27historical Backup Offers Accepted
-
2019-04-19price $93,900
-
2019-03-03$98,100 Active
ⓘ Source: listings_history table (triggers on properties + properties_extension) + one-shot
backfill from property_details.listing_events for pre-trigger history.
Tax reassessment forecast CA · Resets to sale price
- Current annual tax
- $1,852 · $154/mo
- Projected year-2 tax
- $1,852 · $154/mo
- Expected delta
- $0/yr ($0/mo · -0.0%)
ⓘ Screening estimate from a state-policy table — verify with the county assessor before closing.
Climate risk First Street
- Flood 1/10 Low FEMA zone X (shaded) · 0% chance over 30 yrs
- Wildfire 6/10 Major
- Heat 9/10 Extreme 7 d/yr ≥111°F today · 18 d/yr by 30 yrs out
- Wind 1/10 Low
- Air quality 5/10 Major 8 unhealthy d/yr today · 11 by 30 yrs out
Nearby sold comps map
Loading sold comps map…
Walkable amenities ~0.75 mi
Loading nearby amenities…
Taxation est. · year 1
- Rental income
- $28,216
- − Mortgage interest
- −$10,363
- − Property taxes
- −$1,852
- − Insurance
- −$925
- − Repairs & maintenance
- −$2,257
- − Management
- −$2,257
- − HOA
- −$3,948
- − Depreciation
- −$5,382
- Taxable income
- $1,232
- Est. tax owed @ 24.0%
- −$296
- After-tax cash flow
- $3,628/yr
For passive investors: Depreciation is non-cash, so a rental often shows a tax loss while cash-flowing — sheltering income. Rental losses are passive: they offset passive income freely, and up to $25,000/yr can offset ordinary (W-2) income if you actively participate and your MAGI is under $100k (phasing out to $0 by $150k); unused losses carry forward. On sale, claimed depreciation is recaptured at up to 25%, and gains may owe capital-gains tax (a 1031 exchange can defer both). Figures are a year-1 estimate at your 24.0% rate — not tax advice; consult a CPA.
Schools (NCES district)
- District
- Palm Springs Unified
- NCES district ID
- 0629550
- Math proficiency
- 21% ▼ -7.00%
- Reading proficiency
- 42% ▬ 0.00%
- Median HH income
- $43,638
- Composite
- 26.76/100
- National rank
- #7131
- State rank
- #328 of 517 in CA
Livability — Desert Hot Springs
- Score
- 49/100
- State rank
- #1149
- US rank
- #25774
Category grades
Schools grade is shown separately in the Schools card above.
Census & demographics
- Census place
- Desert Hot Springs, CA
- County
- Riverside County · 2,287,001 people
- City population
- 41,615
- Metro
- Riverside-San Bernardino-Ontario, CA
- Population (ZIP)
- 41,615
- Household income
- $54,023
- Rent vs Own
- Severe rent burden
- 2095.0
Population outlook (Riverside County) Hauer SSP2
- Today (2025)
- 2,664,475 people
- By 2030
- 2,802,692 · +5.2%
- By 2040
- 3,050,904 · +14.5%
- By 2050
- 3,256,783 · +22.2%
- By 2075
- 3,655,058 · +37.2%
- By 2100
- 3,766,594 · +41.4%
Race, ethnicity, and origin ACS 2023
- Neighborhood character
- Majority Hispanic (64%)
- Race & ethnicity
- Hispanic / Latino 64% Two or more races 27% White 23% Black 7% Native American 2% Asian 2%
- Hispanic origin (detail)
- Mexican 53%
- Common ancestry
- Lithuanian 1% Romanian 1% Italian 1%
- Foreign-born
- 27% · Canada, Vietnam
- Languages at home
- 47% English-only · Spanish 50% Russian/Polish/Slavic 1%
Political lean MEDSL · Riverside
- 2024 margin
- Toss-up / Even · D 48.0% · R 49.3% · Other 2.6%
- 2008→2024 swing
- -3.6pp toward R · 2008: 2.3pp · 2024: -1.3pp
- All cycles
- 2024: R+1.3 2020: D+8.0 2016: D+4.3 2012: R+0.4 2008: D+2.3
Not yet ingested
- Civics
- —
Market trends
- HPI YoY
- ▼ -102.10%
- Current HPI
- 418.4691
- Rent YoY
- ▲ 3.66%
- Metro
- Riverside-San Bernardino-Ontario, CA
- State GDP YoY
- ▲ 3.21%
- F500 in state
- 116
Industry mix (Fortune 500 HQ in CA)
| Industry | F500 HQs | Revenue |
|---|---|---|
| Technology | 27 | $1,492B |
|
||
| Financial Services | 3 | $174B |
|
||
| Retail | 3 | $44B |
|
||
| Insurance | 3 | $26B |
|
||
| Media / Entertainment | 2 | $115B |
|
||
| Pharmaceuticals / Biotech | 2 | $62B |
|
||
Price history
+88.6% since first listed8 events — show timeline
- 2026-02-24 Listed $185,000 TheMLS
- 2025-08-08 Listed — TheMLS
- 2019-06-04 Sold (MLS) $91,000 GPSMLS
- 2019-06-04 Sold (MLS) $91,000 GPSMLS
- 2019-06-02 Pending — GPSMLS
- 2019-04-27 Contingent — GPSMLS
- 2019-04-19 Price Changed $93,900 GPSMLS
- 2019-03-03 Listed $98,100 GPSMLS
Property tax history
+1.4%/yrLatest (2025): $1,852 · -1.4% YoY. Source: county tax records.
Cash-flow waterfall
monthlySold comps — $/sqft
last 12 mo · ≤1 miLoading sold comps…