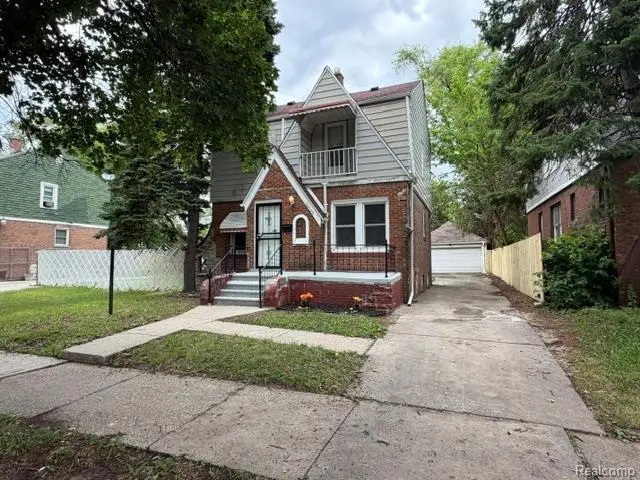
16160 Mark Twain St · Detroit, MI
Flood risk 1/10 · Minimal
- FEMA flood zone
- X (unshaded)
- Chance of flooding over 30 yrs
- 0.0%
- Est. flood insurance / yr
- $473 – $860
Fire risk 1/10 · Minimal
- Est. fire insurance / yr
- $784 – $1,456
Heat risk 3/10 · Minor
- Hot days now (above 98°F)
- 7 days/yr
- Hot days in 30 yrs
- 15 days/yr
Wind risk 2/10 · Minimal
- Chance of severe wind over 30 yrs
- —
Air-quality risk 3/10 · Minor
- Unhealthy air days now
- 2 days/yr
- Unhealthy air days in 30 yrs
- 5 days/yr
Risk factors via First Street. Map © Google.
Why this score? — see what drove the D grade
The composite is a weighted blend of 9 inputs, each scored 0–100. Each bar is that input's sub-score; the figure is the points it added to the 100-point composite (weight × sub-score).
- Cash flow +15.1/30.0
- ARV discount +7.5/15.0
- 1% rule +6.0/10.0
- DSCR +4.6/10.0
- Livability +3.7/5.0
- Rent growth +3.3/5.0
- Condition / age +2.5/5.0
- Schools +1.3/10.0
- Appreciation +0.0/10.0
$125,000
🖨 Deal sheet (PDF) 📄 Offer letter ✓ Due diligence
Listing remarks MLS
Investors, investors, investors. Here is your perfect project house. 3 Bedroom brick Colonial. Needs some work, but is priced to sell. A little elbow grease and imagination and you will have the perfect home for you and your family. Or will make a great rental. Won't last long. Multiple offer situation!! Highest and best due Tuesday 2-21-17 at 5:00 pm
Key facts
- Marble flooring
- Finished basement
- New cabinetry
Tags
Property features AI
Finance
- Other: Pets allowed (cats and dogs)
Exterior
- Utilities: Public water
- Home design: Residential 2-story home; Built in 1929; Basement present and finished
- Construction: Brick construction; Basement foundation
- Exterior features: Brick exterior; Fenced yard; Front porch; Paved street access; Frontage approximately 41 feet
Interior
- Kitchen: Kitchen on entry level (approx. 10 x 6) with marble flooring; Dining room on entry level (approx. 11 x 11)
- Bedrooms: Primary bedroom on second level (12 x 13) with carpet; Second bedroom on second level (13 x 11) with carpet; Third bedroom on second level (approx. 9' wide) with carpet
- Flooring: Carpet in bedrooms; Ceramic flooring in bathrooms and entry-level lavatory; Marble flooring in kitchen
- Bathrooms: Three total bathrooms/lavatories; One full bathroom; Entry-level lavatory with ceramic flooring (approx. 4' x 3'); Second-level bathroom with ceramic flooring (approx. 6' x 6'); Basement lavatory with ceramic flooring (approx. 5' x 5')
- Heating & cooling: Natural gas heating; Forced air heating system
- Interior features: Total of 9 rooms; Finished basement
Neighborhood map
What this means for you Summary
Snapshot
- This is a 3-bed/1.0-bath single-family listed at $125k.
Deal economics
- At list price, monthly cash flow is $41 ($487/yr) — positive.
- The deal already cash-flows at list — no discount required.
- Meets the 1% rule at list price ($1k rent vs $125k).
- Cap rate 6.7% vs local median 10.0% in Detroit — below-typical yield; the buyer is paying a premium for something (appreciation thesis, condition, location) that the cap rate doesn't capture.
Location & tenants
- Location reads 73/100 on livability (#218 in MI) — a middle-class / working-renter tenant base. Strengths: amenities A+, commute A+, cost of living A+; Watch: crime F, employment F.
- Detroit Public Schools Community District (urban): math 10% / reading 24% proficiency, ranked #499 of 540 in MI (top 92%) — low school quality limits family demand, transient renter base, plan for 1-2y turnover; 90% free/reduced lunch — lower-income household profile, screen leases tightly.
- Zoned schools: Coleman A Young Elementary School (math 24% / reading 24%, grade F, #980 of 1,397 statewide, top 74%, 416 students, 93% FRL); Henry Ford High School (math 24% / reading 24%, grade F, #481 of 713 statewide, top 81%, 712 students, 86% FRL) — zoned schools at 90% FRL track the district average.
- Market conditions: Rents rising (+3.2%/yr); 291 active listings in the ZIP; 40 comparable units currently listed for rent nearby; rentals at typical pace (median 20d on market — plan ~3-4 weeks tenant-placement turnaround); lower-income renter base — watch delinquency; 2,639 units permitted in Wayne County in 2024 (1,216 in 5+ unit buildings).
- This rent runs 42% of the median local income ($39k/yr) — at the standard rent-burdened threshold; future hikes will face affordability resistance.
Forward outlook
- Local home prices are declining (-3.0%/yr); year-one equity from $864 of loan paydown is wiped out by about $4k of value loss. Plan a longer hold.
- Wayne County population projected at -17% by 2050 — secular population decline; favor cash flow + early exit over multi-decade hold.
Negotiation context
- Only 7 days on market — expect competitive offers; lowballing is unlikely to land.
- 16 sale attempts since 20y ago with the ask held roughly flat each time — persistent listings suggest the price (not the market) is what's stuck; bring a comps-based counter.
- Current owner paid $14k; list at $125k implies a 793% gain — meaningful room to come down on a strong offer.
Risks & watch-outs
- Watch-outs: property tax is 3.3% of price; built in 1929 — expect roof / HVAC / electrical / plumbing capex.
Questions for the listing agent
- Built in 1929 — when were the roof, HVAC, electrical panel, plumbing, and water heater last replaced?
- Property tax is high relative to price — has the assessment been appealed recently, and will the sale trigger a re-assessment?
- Is there a deadline driving the sale (1031 exchange, divorce, estate, relocation)? That informs how much negotiation room exists.
- Schools are F-rated, which usually means shorter tenancies and higher turnover. Who's the typical renter profile here, and what's been the actual vacancy rate?
- Crime grade is F in this area — have there been break-ins, vandalism, or insurance claims at this property in the last 3 years? What carrier currently insures it and at what premium?
- The area grade is low — what's the realistic commute time and amenity access for the typical tenant pool here? Any planned neighborhood developments (good or bad) we should know about?
- What's the average days-on-market for RENTAL listings here right now (not sales)? A rising rental-DOM trend means longer vacancies and softer asking-rent achievability than the comps imply.
- What's the recent tenant-quality profile in this submarket — average credit score on applications, eviction rate, late-payment / NSF rate, and stable-employment percentage? A property-management company in the area should have these aggregated.
- How much new for-sale + rental construction is in the pipeline within 1–3 miles? Heavy new supply typically softens prices + rents 12–24 months out; constrained supply supports both.
Investment metrics
- 1% rule
- 1.10% ✓
- Cap rate
- 6.68%
- Cash-on-cash
- 1.39%
- DSCR
- 1.06
- GRM
- 7.6
CMA / ARV
- ARV (on-the-fly)
- $63,855
- Comps found
- 12
Show comp detail 12 sales within ~0.75 mi
| Address | Dist | Beds/Ba | Sqft | Sold | Price | $/sf | Match |
|---|---|---|---|---|---|---|---|
| 15770 Stansbury St | 0.31mi | 3/1.0 | 1,100 (-5%) | 1mo | $50,000 | $45 | 76 |
| 16180 Snowden St | 0.49mi | 3/1.0 | 1,137 (-2%) | 0mo | $61,000 | $54 | 73 |
| 15824 Snowden St | 0.52mi | 3/1.0 | 1,127 (-3%) | 1mo | $61,000 | $54 | 70 |
| 15824 Snowden St | 0.52mi | 3/1.0 | 1,127 (-3%) | 1mo | $61,000 | $54 | 70 |
| 16562 Tracey St | 0.36mi | 3/1.0 | 1,244 (+7%) | 2mo | $60,000 | $48 | 69 |
| 16863 Tracey St | 0.47mi | 3/2.0 | 1,200 (+3%) | 2mo | $165,000 | $138 | 67 |
| 16176 Tracey St | 0.33mi | 3/2.0 | 1,270 (+9%) | 1mo | $70,000 | $55 | 65 |
| 15430 Mark Twain St | 0.41mi | 3/1.0 | 1,026 (-12%) | 1mo | $95,000 | $93 | 61 |
| 15366 Sussex St | 0.64mi | 3/1.0 | 1,100 (-5%) | 3mo | $105,000 | $95 | 59 |
| 15868 Whitcomb St | 0.51mi | 3/1.0 | 1,332 (+15%) | 2mo | $95,000 | $71 | 50 |
| 15041 Lesure St | 0.72mi | 3/1.0 | 1,021 (-12%) | 2mo | $50,000 | $49 | 44 |
| 17531 Ardmore St | 0.74mi | 4/2.0 (+1) | 1,304 (+12%) | 2mo | $195,000 | $150 | 34 |
Match score weights: distance 35% · size 25% · config 20% · recency 20%. Top-matched comps best support the ARV.
Projected returns pro-forma
-3.0% appreciation · 3.25% rent growth · sell at horizon
- IRR
- -13.6%
- Equity multiple
- 0.51×
- Total profit
- $-17,187
- Equity at exit
- $18,638
- IRR
- -4.1%
- Equity multiple
- 0.72×
- Total profit
- $-9,660
- Equity at exit
- $10,808
Cash invested: $35,000 (down + closing). Projections, not guarantees.
Landlord ↔ Tenant lean methodology
- Overall (STATE)
- 62 Landlord-Friendly
- State Michigan
- 62 Landlord-Friendly · EVEN
- County
- — inherits STATE
- City
- — inherits STATE
ZIP-level market 48235
- Rents YoY
- 3.2%
- Active inventory
- 291
- Price-to-rent
- 7.6×
Monthly cashflow live
- Estimated rent
- $1,377 high interval (Pro) →
- Mortgage (P&I)
- −$656
- Tax from tax record
- −$340 /mo · $4,078/yr
- Insurance
- −$52
- HOA
- −$0
- Vacancy / Maint / Mgmt
- −$289
- Net cashflow
- $41
Break-even live
Sensitivity live
| Price | -10% $111 | -5% $76 | +0% $41 | +5% $5 | +10% $-30 |
|---|---|---|---|---|---|
| Rent | -10% $-68 | -5% $-14 | +0% $41 | +5% $95 | +10% $149 |
| Rate | -1.0pp $104 | -0.5pp $72 | base $41 | +0.5pp $8 | +1.0pp $-25 |
UW: 25.0% down · 7.5% · 30yr · 1.5% tax · 5.0% vac · 8.0% maint · 8.0% mgmt
Financing live
Cash to close
- Down payment
- $31,250
- Closing costs
- $3,750
- Reserves months
- —
- Total cash needed
- —
Loan-product check · same deal, 3 products live
Conventional
25% down · 7.5% · 30yr
- Down + closing
- —
- Monthly P&I
- —
- Monthly cashflow
- —
- DSCR
- —
- Eligible?
- —
Personal DTI + credit; lowest rate.
DSCR
20% down · 8.5% · 30yr
- Down + closing
- —
- Monthly P&I
- —
- Monthly cashflow
- —
- DSCR
- —
- Eligible?
- —
No personal income docs; deal must DSCR.
Hard money
10% down · 12.0% · 12mo
- Down + closing
- —
- Monthly P&I
- —
- Monthly cashflow
- —
- DSCR
- —
- Eligible?
- —
Short-term bridge; refi at stabilization.
Rent comps 40 comps
| Address | Beds | Baths | Sqft | Rent | $/sqft | DOM | Units | Dist |
|---|---|---|---|---|---|---|---|---|
| 15762 Mark Twain St Detroit, MI | 3.0 | 2.0 | 1430 | $1,250 | $0.87 | 18d | 1 | 0.22mi |
| 16505 Stansbury St Detroit, MI | 3.0 | 1.0 | 1100 | $1,250 | $1.14 | 12d | 1 | 0.24mi |
| 16151 Robson St Detroit, MI | 3.0 | 1.0 | 1300 | $1,525 | $1.17 | 16d | 1 | 0.32mi |
| 15810 Robson St Detroit, MI | 3.0 | 1.0 | 1142 | $1,500 | $1.31 | 26d | 1 | 0.34mi |
| 15517 Lesure St Unit BDRM1A Detroit, MI | 2.0 | 1.0 | 1000 | $850 | $0.85 | 26d | 1 | 0.41mi |
| 15387 Lesure St Detroit, MI | 3.0 | 1.0 | 1064 | $1,350 | $1.27 | 14d | 1 | 0.53mi |
| 15468 Sussex St #2 Detroit, MI | 2.0 | 1.0 | 900 | $1,250 | $1.39 | 45d | 1 | 0.55mi |
| 15341 Lauder St Detroit, MI | 4.0 | 1.5 | 1080 | $1,475 | $1.37 | 18d | 1 | 0.57mi |
| 15328 Coyle St Detroit, MI | 3.0 | 1.0 | 1000 | $1,450 | $1.45 | 19d | 1 | 0.62mi |
| 15330 Coyle St Unit 2 Detroit, MI | 3.0 | 1.0 | 1000 | $1,450 | $1.45 | 26d | 1 | 0.63mi |
| 15330 Coyle St Unit 1 Detroit, MI | 3.0 | 1.0 | 1000 | $1,425 | $1.43 | 14d | 1 | 0.63mi |
| 15330 Coyle St Unit 1 Detroit, MI | 3.0 | 1.0 | 1000 | $1,375 | $1.38 | 26d | 1 | 0.63mi |
| 15073 Strathmoor St Detroit, MI | 2.0 | 1.0 | 860 | $1,350 | $1.57 | 18d | 1 | 0.64mi |
| 16503 Ward Ave Unit 2 Detroit, MI | 2.0 | 1.0 | 700 | $850 | $1.21 | 45d | 1 | 0.66mi |
| 15340 Hartwell St Detroit, MI | 2.0 | 1.0 | 900 | $1,300 | $1.44 | 18d | 1 | 0.69mi |
| 15100 Whitcomb St Detroit, MI | 2.0 | 1.0 | 750 | $925 | $1.23 | 45d | 1 | 0.78mi |
| 15738 Sorrento Ave Detroit, MI | 3.0 | 1.0 | 762 | $1,175 | $1.54 | 45d | 1 | 0.78mi |
| 16204 Steel St Detroit, MI | 3.0 | 1.0 | 969 | $1,150 | $1.19 | 45d | 1 | 0.79mi |
| 15088 Littlefield St Detroit, MI | 2.0 | 1.0 | 1294 | $1,275 | $0.99 | 23d | 1 | 0.84mi |
| 14903 Tracey St Detroit, MI | 3.0 | 1.0 | 1004 | $1,100 | $1.10 | 18d | 1 | 0.85mi |
| 18010 Lesure St Detroit, MI | 3.0 | 1.0 | 1010 | $1,500 | $1.49 | 0d | 1 | 0.88mi |
| 14891 Hartwell St Detroit, MI | 3.0 | 1.0 | 1000 | $1,150 | $1.15 | 45d | 1 | 0.91mi |
| 15752 Rutherford St Detroit, MI | 3.0 | 2.0 | 1174 | $1,386 | $1.18 | 6d | 1 | 0.92mi |
| 15866 Mansfield St Detroit, MI | 3.0 | 1.0 | 1324 | $1,425 | $1.08 | 26d | 1 | 0.94mi |
| 15388 Appoline St #203 Detroit, MI | 2.0 | 1.0 | 900 | $850 | $0.94 | 45d | 1 | 0.96mi |
| 14600 Strathmoor St Detroit, MI | 4.0 | 1.0 | 1300 | $1,450 | $1.12 | 45d | 1 | 0.96mi |
| 15375 Prevost St Detroit, MI | 4.0 | 1.0 | 907 | $1,300 | $1.43 | 18d | 1 | 0.96mi |
| 14814 Sussex St Unit 2 Detroit, MI | 3.0 | 1.0 | 1100 | $1,000 | $0.91 | 45d | 1 | 0.97mi |
| 14590 Ardmore St Detroit, MI | 3.0 | 1.0 | 1200 | $1,195 | $1.00 | 4d | 1 | 0.98mi |
| 17165 Prevost St Detroit, MI | 3.0 | 1.0 | 1060 | $2,400 | $2.26 | 3d | 1 | 0.98mi |
| 14893 Prest St Detroit, MI | 3.0 | 1.0 | 1100 | $1,000 | $0.91 | 16d | 1 | 0.99mi |
| 14559 Strathmoor St Detroit, MI | 2.0 | 1.0 | 1033 | $1,150 | $1.11 | 22d | 1 | 1.00mi |
| 18257 Mark Twain St Detroit, MI | 3.0 | 1.0 | 1185 | $1,507 | $1.27 | 18d | 1 | 1.00mi |
| 15760 Monte Vista St Detroit, MI | 2.0 | 1.0 | 1080 | $1,250 | $1.16 | 45d | 1 | 1.03mi |
| 14847 Cheyenne St Detroit, MI | 3.0 | 2.0 | 849 | $1,150 | $1.35 | 19d | 1 | 1.03mi |
| 17150 Meyers Rd Detroit, MI | 1.0–2.0 | 1.0 | 775 | $975 | $1.26 | 45d | 2 | 1.10mi |
| 15332 Saint Marys St Detroit, MI | 3.0 | 1.0 | 1200 | $1,200 | $1.00 | 18d | 1 | 1.11mi |
| 16535 Asbury Park Detroit, MI | 3.0 | 1.5 | 1152 | $1,450 | $1.26 | 26d | 1 | 1.13mi |
| 17201 Saint Marys St Detroit, MI | 2.0 | 1.0 | 1200 | $1,200 | $1.00 | 4d | 1 | 1.15mi |
| 17201 Saint Marys St Detroit, MI | 2.0 | 1.0 | 1200 | $1,200 | $1.00 | 0d | 1 | 1.15mi |
Listing history 9 events
-
2026-06-21days on market $125,000 Active 7 DOM
-
2026-06-18days on market $125,000 Active 4 DOM
-
2026-06-17days on market $125,000 Active 3 DOM
-
2026-06-16days on market $125,000 Active 2 DOM
-
2026-06-16status $125,000 Active 1 DOM
-
2026-06-15statusdays on market $125,000 Pending 1 DOM
-
2026-06-15days on market $125,000 Active 3 DOM
-
2026-06-13remarks 699-char remark
-
2026-06-13$125,000 Active 1 DOM
ⓘ Source: listings_history table (triggers on properties + properties_extension) + one-shot
backfill from property_details.listing_events for pre-trigger history.
Tax reassessment forecast MI · Partial reset (capped growth)
- Current annual tax
- $4,078 · $340/mo
- Projected year-2 tax
- $4,078 · $340/mo
- Expected delta
- $0/yr ($0/mo · -0.0%)
ⓘ Screening estimate from a state-policy table — verify with the county assessor before closing.
Climate risk First Street
- Flood 1/10 Low FEMA zone X (unshaded) · 0% chance over 30 yrs
- Wildfire 1/10 Low
- Heat 3/10 Moderate 7 d/yr ≥98°F today · 15 d/yr by 30 yrs out
- Wind 2/10 Low
- Air quality 3/10 Moderate 2 unhealthy d/yr today · 5 by 30 yrs out
Nearby sold comps map
Loading sold comps map…
Walkable amenities ~0.75 mi
Loading nearby amenities…
Taxation est. · year 1
- Rental income
- $16,527
- − Mortgage interest
- −$7,002
- − Property taxes
- −$4,078
- − Insurance
- −$625
- − Repairs & maintenance
- −$1,322
- − Management
- −$1,322
- − Depreciation
- −$3,636
- Taxable loss
- −$1,458
- Est. tax savings @ 24.0%
- +$350
- After-tax cash flow
- $837/yr
For passive investors: Depreciation is non-cash, so a rental often shows a tax loss while cash-flowing — sheltering income. Rental losses are passive: they offset passive income freely, and up to $25,000/yr can offset ordinary (W-2) income if you actively participate and your MAGI is under $100k (phasing out to $0 by $150k); unused losses carry forward. On sale, claimed depreciation is recaptured at up to 25%, and gains may owe capital-gains tax (a 1031 exchange can defer both). Figures are a year-1 estimate at your 24.0% rate — not tax advice; consult a CPA.
Schools (NCES district)
- District
- Detroit Public Schools Community District
- NCES district ID
- 2601103
- Math proficiency
- 10% ▼ -2.00%
- Reading proficiency
- 24% ▲ 6.00%
- Median HH income
- $25,815
- Composite
- 13.06/100
- National rank
- #9564
- State rank
- #499 of 540 in MI
Livability — Detroit
- Score
- 73/100
- State rank
- #218
- US rank
- #5427
Category grades
Schools grade is shown separately in the Schools card above.
Census & demographics
- Census place
- Detroit, MI
- County
- Wayne County · 1,562,939 people
- City population
- 572,865
- Metro
- Detroit-Warren-Dearborn, MI
- Population (ZIP)
- 45,600
- Household income
- $39,265
- Rent vs Own
- Severe rent burden
- 3064.0
Population outlook (Wayne County) Hauer SSP2
- Today (2025)
- 1,675,273 people
- By 2030
- 1,620,300 · -3.3%
- By 2040
- 1,502,341 · -10.3%
- By 2050
- 1,384,039 · -17.4%
- By 2075
- 1,124,592 · -32.9%
- By 2100
- 881,193 · -47.4%
Race, ethnicity, and origin ACS 2023
- Neighborhood character
- Predominantly Black (94%)
- Race & ethnicity
- Black 94% White 3% Two or more races 2% Hispanic / Latino 1%
- Foreign-born
- 1% · Canada
- Languages at home
- 98% English-only · Spanish 1%
Political lean MEDSL · Wayne
- 2024 margin
- Strong D (+29.0) · D 62.7% · R 33.7% · Other 3.6%
- 2008→2024 swing
- -20.5pp toward R · 2008: 49.5pp · 2024: 29.0pp
- All cycles
- 2024: D+29.0 2020: D+38.1 2016: D+37.3 2012: D+46.9 2008: D+49.5
Not yet ingested
- Civics
- —
Market trends
- HPI YoY
- ▼ -153.02%
- Current HPI
- 263.6326
- Rent YoY
- ▲ 3.25%
- Metro
- Detroit-Warren-Dearborn, MI
- State GDP YoY
- ▲ 1.37%
- F500 in state
- 28
Industry mix (Fortune 500 HQ in MI)
| Industry | F500 HQs | Revenue |
|---|---|---|
| Automotive Parts | 3 | $48B |
|
||
| Automotive | 2 | $372B |
|
||
| Chemicals | 1 | $45B |
|
||
| Automotive Retail | 1 | $29B |
|
||
| Healthcare / Medical Devices | 1 | $23B |
|
||
| Automotive Technology | 1 | $20B |
|
||
Price history
+39.0% since first listed39 events — show timeline
- 2026-06-12 Listed $125,000 MiRealSource-MiMLS
- 2017-03-17 Sold (MLS) $14,000 MiRealSource-MiMLS
- 2017-03-17 Sold (MLS) $14,000 REALCOMP
- 2017-02-24 Pending — MiRealSource-MiMLS
- 2017-02-23 Pending — REALCOMP
- 2017-02-11 Price Changed $16,000 MiRealSource-MiMLS
- 2017-02-10 Price Changed $16,000 REALCOMP
- 2017-02-10 Relisted — MiRealSource-MiMLS
- 2017-02-10 Relisted — REALCOMP
- 2017-01-20 Pending — MiRealSource-MiMLS
- 2017-01-19 Pending — REALCOMP
- 2016-12-07 Price Changed $16,900 MiRealSource-MiMLS
- 2016-12-06 Price Changed $16,900 REALCOMP
- 2016-11-05 Listed $17,900 MiRealSource-MiMLS
- 2016-11-04 Listed $17,900 REALCOMP
- 2016-08-18 Listing Removed — REALCOMP
- 2016-08-18 Listing Removed — MiRealSource-MiMLS
- 2016-08-01 Relisted — MiRealSource-MiMLS
- 2016-07-31 Listing Removed — MiRealSource-MiMLS
- 2016-05-03 Listed $40,000 MiRealSource-MiMLS
- 2016-05-03 Listed $40,000 REALCOMP
- 2014-03-26 Sold (MLS) $11,850 REALCOMP
- 2014-03-26 Sold (MLS) $11,850 MiRealSource-MiMLS
- 2014-02-04 Listing Removed — MiRealSource-MiMLS
- 2014-01-16 Listing Removed — REALCOMP
- 2014-01-16 Listing Removed — MiRealSource-MiMLS
- 2014-01-16 Listed $11,664 REALCOMP
- 2014-01-16 Listed $11,664 MiRealSource-MiMLS
- 2013-12-18 Listing Removed — MiRealSource-MiMLS
- 2013-12-18 Listing Removed — REALCOMP
- 2013-12-18 Listed $14,580 REALCOMP
- 2013-12-18 Listed $14,580 MiRealSource-MiMLS
- 2013-09-12 Listed $16,200 MiRealSource-MiMLS
- 2013-09-12 Listed $16,200 REALCOMP
- 2009-04-01 Sold (Public Records) $100,000 Public Records
- 2007-11-30 Sold (MLS) $12,000 REALCOMP
- 2007-04-13 Listed $14,500 REALCOMP
- 2007-01-13 Listing Removed — REALCOMP
- 2006-07-13 Listed $89,900 REALCOMP
Property tax history
+7.6%/yrLatest (2025): $4,078 · +0.6% YoY. Source: county tax records.
Cash-flow waterfall
monthlySold comps — $/sqft
last 12 mo · ≤1 miLoading sold comps…