13813 Fremont Ave · Lubbock, TX
Flood risk No data
- FEMA flood zone
- —
- Chance of flooding over 30 yrs
- —
- Est. flood insurance / yr
- —
Fire risk No data
- Est. fire insurance / yr
- —
Heat risk No data
- Hot days now (above threshold)
- —
- Hot days in 30 yrs
- —
Wind risk No data
- Chance of severe wind over 30 yrs
- —
Air-quality risk No data
- Unhealthy air days now
- —
- Unhealthy air days in 30 yrs
- —
Risk factors via First Street. Map © Google.
Why this score? — see what drove the D grade
The composite is a weighted blend of 9 inputs, each scored 0–100. Each bar is that input's sub-score; the figure is the points it added to the 100-point composite (weight × sub-score).
- Cash flow +12.7/30.0
- ARV discount +7.5/15.0
- Schools +4.8/10.0
- Livability +4.0/5.0
- Condition / age +4.0/5.0
- DSCR +3.8/10.0
- 1% rule +3.6/10.0
- Rent growth +3.0/5.0
- Appreciation +0.0/10.0
$193,770
🖨 Deal sheet (PDF) 📄 Offer letter ✓ Due diligence
Listing remarks
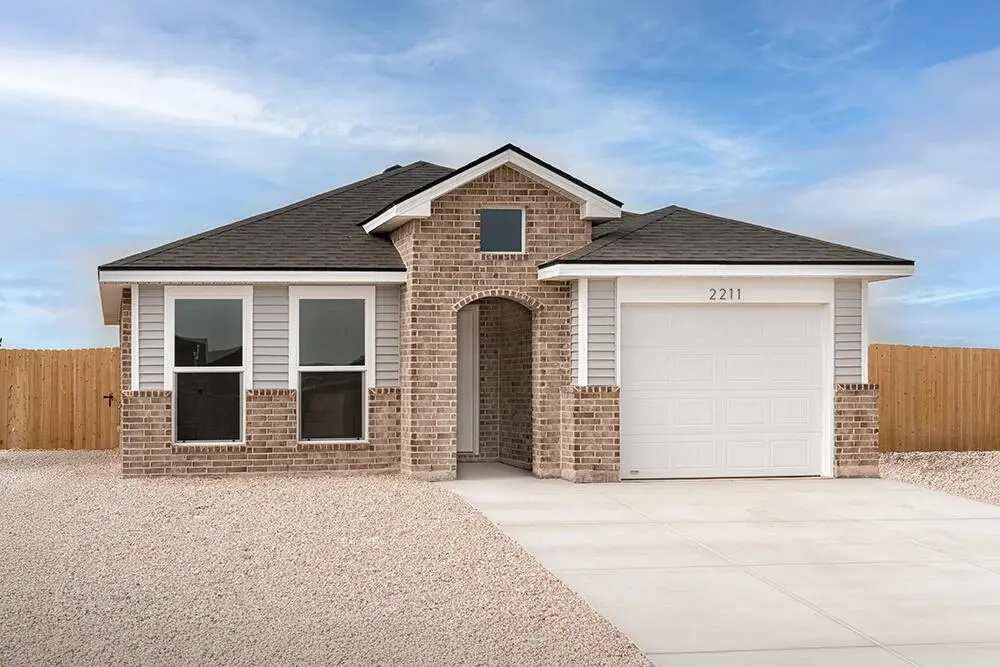
Buy NOW and get up to $7,000 Use-It-Your-Way Cash! Discover the charm and efficiency of our cottage-style homes—perfect for first-time buyers. The Kathleen floor plan features a beautiful brick and vinyl exterior, an inviting covered entry, and a bright open-concept layout with luxury vinyl plank flooring throughout the main areas. Enjoy a modern kitchen with an island, granite or quartz countertops, stainless steel appliances, and upgraded fixtures. This thoughtfully designed home also offers a private master suite with a walk-in closet, plus two additional bedrooms and a second full bath. The Kathleen combines style, comfort, and affordability—everything you need to feel at ho
Key facts
- Covered entry
- Modern kitchen
- Island
Tags
Property features AI
Finance
- Other: Address: 13813 Fremont Ave, Lubbock TX 79423; Status: Active
- Financial info: List price $197,770
Exterior
- Parking: 1 parking space
- Utilities: Has heating; Has cooling
- Home design: Spec-built home (Plan: Kathleen)
- Exterior features: Living area approximately 1100
Interior
- Kitchen: Dishwasher; Disposal; Microwave
- Bedrooms: 3 bedrooms
- Bathrooms: 2 full bathrooms
- Heating & cooling: Forced air heating; Central air conditioning
- Interior features: Dishwasher; Disposal; Microwave; Central ceiling fans
Neighborhood map
What this means for you Summary
Snapshot
- This is a 3-bed/2.0-bath single-family listed at $194k. Condition is rated good.
Deal economics
- At list price, monthly cash flow is $-22 ($-265/yr) — negative.
- To cash-flow at today's rent, offer at most $191k (1.7% below list).
- To meet the 1% rule (rent ≥ 1% of price), the offer needs to be $167k (14.0% below list).
- Recommended offer: $167k (14.0% below list) — sets the bar for 1% rule.
Location & tenants
- Location reads 80/100 on livability (#37 in TX, #1,749 nationally) — a professional / high-income tenant draw. Strengths: commute A+, cost of living A+, housing A+; Watch: employment C-, crime F.
- Lubbock-Cooper ISD (rural): math 54% / reading 52% proficiency, ranked #98 of 826 in TX (top 12%) — acceptable for families but not a draw, mixed tenant base, ~2y average lease.
- Zoned schools: Lubbock-Cooper South El (math 52% / reading 55%, grade C, #686 of 4,322 statewide, top 16%, 739 students, 41% FRL); Lubbock-Cooper Middle (math 46% / reading 45%, grade D+, #470 of 1,662 statewide, top 29%, 914 students, 37% FRL); Lubbock-Cooper H S (math 67% / reading 65%, grade B, #189 of 1,632 statewide, top 12%, 2,117 students, 31% FRL) — zoned schools at 36% FRL track the district average.
- Market conditions: Rents rising (+2.1%/yr); 673 active listings in the ZIP; 20 comparable units currently listed for rent nearby; rentals at typical pace (median 23d on market — plan ~3-4 weeks tenant-placement turnaround); solid renter incomes; 2,219 units permitted in Lubbock County in 2024 (252 in 5+ unit buildings).
Forward outlook
- Local home prices are declining (-3.0%/yr); year-one equity from $1k of loan paydown is wiped out by about $6k of value loss. Plan a longer hold.
- Lubbock County population projected at +39% by 2050 — long-run rental-demand tailwind backs the buy-and-hold thesis.
Negotiation context
- Only 4 days on market — expect competitive offers; lowballing is unlikely to land.
Questions for the listing agent
- What do current leases actually rent for vs. the listed asking? Can we see a recent rent roll and the last 12 months of T-12 income?
- Is there a deadline driving the sale (1031 exchange, divorce, estate, relocation)? That informs how much negotiation room exists.
- Schools are D-rated, which usually means shorter tenancies and higher turnover. Who's the typical renter profile here, and what's been the actual vacancy rate?
- Crime grade is F in this area — have there been break-ins, vandalism, or insurance claims at this property in the last 3 years? What carrier currently insures it and at what premium?
- The area grade is low — what's the realistic commute time and amenity access for the typical tenant pool here? Any planned neighborhood developments (good or bad) we should know about?
- What's the average days-on-market for RENTAL listings here right now (not sales)? A rising rental-DOM trend means longer vacancies and softer asking-rent achievability than the comps imply.
- What's the recent tenant-quality profile in this submarket — average credit score on applications, eviction rate, late-payment / NSF rate, and stable-employment percentage? A property-management company in the area should have these aggregated.
- How much new for-sale + rental construction is in the pipeline within 1–3 miles? Heavy new supply typically softens prices + rents 12–24 months out; constrained supply supports both.
Investment metrics
- 1% rule
- 0.86% ✗
- Cap rate
- 6.16%
- Cash-on-cash
- -0.49%
- DSCR
- 0.98
- GRM
- 9.7
CMA / ARV
No comps found within radius.
Projected returns pro-forma
-3.0% appreciation · 2.13% rent growth · sell at horizon
- IRR
- -18.1%
- Equity multiple
- 0.37×
- Total profit
- $-34,230
- Equity at exit
- $28,892
- IRR
- -12.0%
- Equity multiple
- 0.31×
- Total profit
- $-37,353
- Equity at exit
- $16,754
Cash invested: $54,256 (down + closing). Projections, not guarantees.
Landlord ↔ Tenant lean methodology
- Overall (STATE)
- 87 Strongly Landlord-Friendly
- State Texas
- 87 Strongly Landlord-Friendly · R+5
- County
- — inherits STATE
- City
- — inherits STATE
ZIP-level market 79423
- Rents YoY
- 2.1%
- Active inventory
- 673
- Price-to-rent
- 9.7×
Monthly cashflow live
- Estimated rent
- $1,667 high interval (Pro) →
- Mortgage (P&I)
- −$1,016
- Tax est. 1.5%
- −$242 /mo · $2,907/yr
- Insurance
- −$81
- HOA
- −$0
- Vacancy / Maint / Mgmt
- −$350
- Net cashflow
- $-22
Break-even live
Sensitivity live
| Price | -10% $112 | -5% $45 | +0% $-22 | +5% $-89 | +10% $-156 |
|---|---|---|---|---|---|
| Rent | -10% $-154 | -5% $-88 | +0% $-22 | +5% $44 | +10% $110 |
| Rate | -1.0pp $75 | -0.5pp $27 | base $-22 | +0.5pp $-72 | +1.0pp $-123 |
UW: 25.0% down · 7.5% · 30yr · 1.5% tax · 5.0% vac · 8.0% maint · 8.0% mgmt
Financing live
Cash to close
- Down payment
- $48,442
- Closing costs
- $5,813
- Reserves months
- —
- Total cash needed
- —
Loan-product check · same deal, 3 products live
Conventional
25% down · 7.5% · 30yr
- Down + closing
- —
- Monthly P&I
- —
- Monthly cashflow
- —
- DSCR
- —
- Eligible?
- —
Personal DTI + credit; lowest rate.
DSCR
20% down · 8.5% · 30yr
- Down + closing
- —
- Monthly P&I
- —
- Monthly cashflow
- —
- DSCR
- —
- Eligible?
- —
No personal income docs; deal must DSCR.
Hard money
10% down · 12.0% · 12mo
- Down + closing
- —
- Monthly P&I
- —
- Monthly cashflow
- —
- DSCR
- —
- Eligible?
- —
Short-term bridge; refi at stabilization.
Rent comps 20 comps
| Address | Beds | Baths | Sqft | Rent | $/sqft | DOM | Units | Dist |
|---|---|---|---|---|---|---|---|---|
| 3016 140th St Lubbock, TX | 3.0 | 2.0 | 1350 | $2,000 | $1.48 | 23d | 1 | 0.12mi |
| 2745 137th St Lubbock, TX | 3.0 | 2.0 | 1410 | $1,550 | $1.10 | 23d | 1 | 0.39mi |
| 2739 137th St Lubbock, TX | 3.0 | 2.0 | 1418 | $1,600 | $1.13 | 45d | 1 | 0.41mi |
| 13510 Indiana Ave Lubbock, TX | 1.0–2.0 | 1.5–2.5 | 895 | $1,275 | $1.42 | 15d | 8 | 0.42mi |
| 2540 138th St Lubbock, TX | 2.0 | 2.0 | 1328 | $1,425 | $1.07 | 15d | 1 | 0.57mi |
| 2626 136th St Lubbock, TX | 2.0 | 2.0 | 1238 | $1,400 | $1.13 | 45d | 1 | 0.57mi |
| 2529 138th St Lubbock, TX | 2.0 | 2.5 | 1249 | $1,400 | $1.12 | 23d | 1 | 0.59mi |
| 2613 136th St Lubbock, TX | 3.0 | 2.0 | 1251 | $1,599 | $1.28 | 23d | 1 | 0.59mi |
| 2611 136th St Lubbock, TX | 2.0 | 2.0 | 1251 | $1,599 | $1.28 | 23d | 1 | 0.60mi |
| 2415 144th St Unit 1-2 Lubbock, TX | 3.0 | 2.5 | 1350 | $1,500 | $1.11 | 15d | 1 | 0.78mi |
| 2410 144th St Unit A Lubbock, TX | 3.0 | 2.0 | 1350 | $1,500 | $1.11 | 45d | 1 | 0.81mi |
| 2410 144th St Unit 1-2 Lubbock, TX | 3.0 | 2.0 | 1350 | $1,399 | $1.04 | 45d | 1 | 0.81mi |
| 2309 134th St Lubbock, TX | 3.0 | 2.0 | 1455 | $1,799 | $1.24 | 15d | 1 | 0.82mi |
| 2404 144th St Unit 1-2 Lubbock, TX | 3.0 | 2.0 | 1350 | $1,399 | $1.04 | 45d | 1 | 0.84mi |
| 14408 Avenue X Unit 1-2 Lubbock, TX | 3.0 | 2.5 | 1350 | $1,500 | $1.11 | 15d | 1 | 0.85mi |
| 14413 Avenue X Unit B Lubbock, TX | 3.0 | 2.0 | 1350 | $1,450 | $1.07 | 45d | 1 | 0.89mi |
| 14102 Avenue V Lubbock, TX | 3.0 | 2.0 | 1450 | $1,500 | $1.03 | 23d | 1 | 1.04mi |
| 13808 Sherman Ave Lubbock, TX | 3.0 | 2.0 | 1450 | $1,650 | $1.14 | 45d | 1 | 1.33mi |
| 13212 Avenue S Lubbock, TX | 3.0 | 2.0 | 1450 | $1,699 | $1.17 | 23d | 1 | 1.43mi |
| 13212 Avenue R Lubbock, TX | 3.0 | 2.0 | 1450 | $1,625 | $1.12 | 15d | 1 | 1.49mi |
Listing history 1 events
-
2026-06-21pricestatusdays on market $193,770 Active 4 DOM
ⓘ Source: listings_history table (triggers on properties + properties_extension) + one-shot
backfill from property_details.listing_events for pre-trigger history.
Nearby sold comps map
Loading sold comps map…
Walkable amenities ~0.75 mi
Loading nearby amenities…
Taxation est. · year 1
- Rental income
- $20,005
- − Mortgage interest
- −$10,854
- − Property taxes
- −$2,907
- − Insurance
- −$969
- − Repairs & maintenance
- −$1,600
- − Management
- −$1,600
- − Depreciation
- −$5,637
- Taxable loss
- −$3,563
- Est. tax savings @ 24.0%
- +$855
- After-tax cash flow
- $590/yr
For passive investors: Depreciation is non-cash, so a rental often shows a tax loss while cash-flowing — sheltering income. Rental losses are passive: they offset passive income freely, and up to $25,000/yr can offset ordinary (W-2) income if you actively participate and your MAGI is under $100k (phasing out to $0 by $150k); unused losses carry forward. On sale, claimed depreciation is recaptured at up to 25%, and gains may owe capital-gains tax (a 1031 exchange can defer both). Figures are a year-1 estimate at your 24.0% rate — not tax advice; consult a CPA.
Condition & rehab AI · 1 photo
This home is in excellent condition with a good condition score of 80. It is move-in ready with minor cosmetic improvements that could further enhance its resale and rental value.
Value-add opportunities
- Both Painting exterior and interior — Enhances curb appeal and interior aesthetics
- Both Landscaping improvements — Enhances curb appeal and adds value
- Both New flooring in high-traffic areas — Improves aesthetics and reduces maintenance
- Both Upgraded fixtures in bathrooms and kitchen — Enhances functionality and aesthetics
Renovation cost estimate screening
Value-add ROI direction
- Both Painting exterior and interior — Enhances curb appeal and interior aesthetics ↑
- Both Landscaping improvements — Enhances curb appeal and adds value ↑
- Both New flooring in high-traffic areas — Improves aesthetics and reduces maintenance ↑
- Both Upgraded fixtures in bathrooms and kitchen — Enhances functionality and aesthetics ↑
ⓘ Cost ranges are severity-bucket heuristics (US national rule-of-thumb). Get contractor quotes + a written scope before underwriting a rehab budget.
Schools (NCES district)
- District
- Lubbock-Cooper ISD
- NCES district ID
- 4815180
- Math proficiency
- 54% ▼ -7.00%
- Reading proficiency
- 52% ▼ -3.00%
- Median HH income
- $77,347
- Composite
- 47.9/100
- National rank
- #2214
- State rank
- #98 of 826 in TX
Livability — Lubbock
- Score
- 80/100
- State rank
- #37
- US rank
- #1749
Category grades
Schools grade is shown separately in the Schools card above.
Census & demographics
- Census place
- Lubbock, TX
- County
- Lubbock County · 293,542 people
- City population
- 283,030
- Metro
- Lubbock, TX
- Population (ZIP)
- 46,998
- Household income
- $84,933
- Rent vs Own
- Severe rent burden
- 1385.0
Population outlook (Lubbock County) Hauer SSP2
- Today (2025)
- 345,960 people
- By 2030
- 371,449 · +7.4%
- By 2040
- 424,539 · +22.7%
- By 2050
- 481,150 · +39.1%
- By 2075
- 633,467 · +83.1%
- By 2100
- 746,853 · +115.9%
Race, ethnicity, and origin ACS 2023
- Neighborhood character
- Majority White (61%)
- Race & ethnicity
- White 61% Hispanic / Latino 31% Two or more races 15% Black 4% Asian 2%
- Hispanic origin (detail)
- Mexican 26%
- Common ancestry
- Slovak 1% Italian 1% Serbian 1%
- Foreign-born
- 5% · Canada
- Languages at home
- 84% English-only · Spanish 13% Tagalog/Filipino 1% Other Asian/Pacific 1%
Political lean MEDSL · Lubbock
- 2024 margin
- Solid R (+39.5) · D 29.7% · R 69.2% · Other 1.0%
- 2008→2024 swing
- -2.8pp toward R · 2008: -36.7pp · 2024: -39.5pp
- All cycles
- 2024: R+39.5 2020: R+32.2 2016: R+38.4 2012: R+40.9 2008: R+36.7
Not yet ingested
- Civics
- —
Market trends
- HPI YoY
- ▼ -155.00%
- Current HPI
- 213.6491
- Rent YoY
- ▲ 2.13%
- Metro
- Lubbock, TX
- State GDP YoY
- ▲ 3.95%
- F500 in state
- 110
Industry mix (Fortune 500 HQ in TX)
| Industry | F500 HQs | Revenue |
|---|---|---|
| Energy | 16 | $1,198B |
|
||
| Technology | 5 | $198B |
|
||
| Engineering / Construction | 4 | $72B |
|
||
| Energy Services | 3 | $60B |
|
||
| Utilities | 3 | $41B |
|
||
| Healthcare | 2 | $330B |
|
||
Cash-flow waterfall
monthlySold comps — $/sqft
last 12 mo · ≤1 miLoading sold comps…