 🔨 Auction
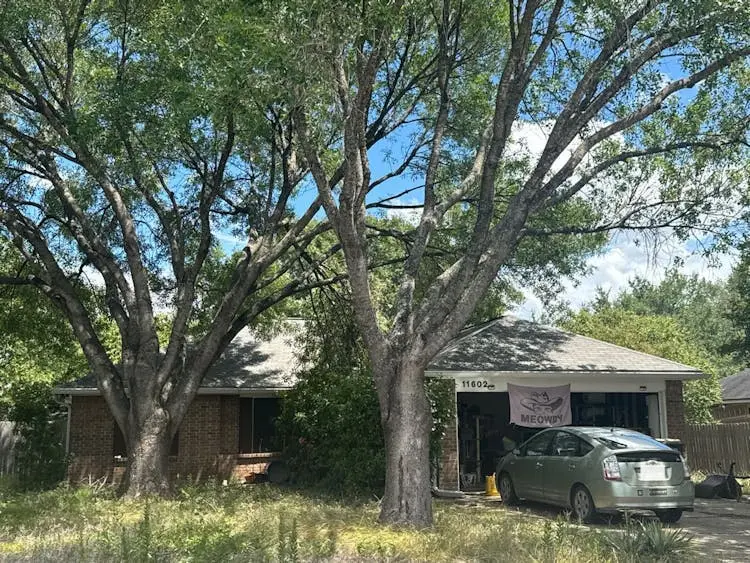
11602 Maybach Dr · Austin, TX
Flood risk 1/10 · Minimal
- FEMA flood zone
- X (unshaded)
- Chance of flooding over 30 yrs
- 0.0%
- Est. flood insurance / yr
- $507 – $1,088
Fire risk 5/10 · Moderate
- Est. fire insurance / yr
- $1,222 – $2,270
Heat risk 8/10 · Major
- Hot days now (above 110°F)
- 7 days/yr
- Hot days in 30 yrs
- 23 days/yr
Wind risk 8/10 · Major
- Chance of severe wind over 30 yrs
- 80.0%
Air-quality risk 1/10 · Minimal
- Unhealthy air days now
- 0 days/yr
- Unhealthy air days in 30 yrs
- 0 days/yr
Risk factors via First Street. Map © Google.
Why this score? — see what drove the F grade
The composite is a weighted blend of 9 inputs, each scored 0–100. Each bar is that input's sub-score; the figure is the points it added to the 100-point composite (weight × sub-score).
- ARV discount +7.5/15.0
- Cash flow +6.2/30.0
- Livability +4.1/5.0
- Appreciation +3.4/10.0
- Condition / age +2.5/5.0
- Rent growth +2.4/5.0
- Schools +1.9/10.0
- 1% rule +1.4/10.0
- DSCR +0.5/10.0
$55,000
🖨 Deal sheet 📄 Offer letter ✓ Due diligence
Listing remarks MLS
The list price is not indicative of seller's final reserve amount. This property is part of an online bidding event; please visit Auction.com to place bids. Inspections of this property and contact with occupants are strictly prohibited. Property is sold "as is" and no for sale sign allowed. List price is minimum starting bid amount. Seller, listing agent and broker have no firsthand knowledge about any features or condition of the property. Available information was gathered from other sources. There is no existing survey and no sellers disclosure. Auction dates 05/03-05/05
Key facts
- 7,840 sq ft lot
- 2 garage spots
- Built 1996
Neighborhood map
What this means for you Summary
Snapshot
- This is a 3-bed/2.0-bath single-family listed at $55k.
Deal economics
- At list price, monthly cash flow is $-551 ($-7k/yr) — negative.
- The deal already cash-flows at list — no discount required.
- Meets the 1% rule at list price ($2k rent vs $55k).
- Recommended offer: $53k (3.0% below list) — sets the bar for market timing.
- Cap rate 4.1% vs local median 1.8% in Austin — top-decile yield for the area; either an underpriced asset or a hidden risk that comps aren't pricing in. Stress-test before assuming the spread holds.
Location & tenants
- Location reads 82/100 on livability (#16 in TX, #1,208 nationally) — a professional / high-income tenant draw. Strengths: amenities A+, commute A+, employment A+; Watch: cost of living D, crime F.
- Del Valle ISD (rural): math 19% / reading 26% proficiency, ranked #749 of 826 in TX (top 91%) — low school quality limits family demand, transient renter base, plan for 1-2y turnover; 77% free/reduced lunch — lower-income household profile, screen leases tightly.
- Market conditions: Rents soft (-0.4%/yr); 246 active listings in the ZIP; 25 comparable units currently listed for rent nearby; rentals at typical pace (median 22d on market — plan ~3-4 weeks tenant-placement turnaround); 17,121 units permitted in Travis County in 2024 (11,963 in 5+ unit buildings).
- This rent runs 32% of the median local income ($72k/yr) — at the standard rent-burdened threshold; future hikes will face affordability resistance.
Forward outlook
- Local home prices are declining (-3.0%/yr); year-one equity from $2k of loan paydown is wiped out by about $9k of value loss. Plan a longer hold.
- Travis County population projected at +60% by 2050 — long-run rental-demand tailwind backs the buy-and-hold thesis.
Negotiation context
- It's been on market 41 days — a 3% lower offer ($53k) is reasonable based on typical stale-listing flexibility.
- 2 sale attempts since 5y ago with the ask held roughly flat each time — persistent listings suggest the price (not the market) is what's stuck; bring a comps-based counter.
Risks & watch-outs
- Watch-outs: property tax is 8.2% of price.
- Climate carrying-cost: severe wind risk, 80% chance of damaging wind over 30y; moderate wildfire risk; extreme-heat days projected 7→23/yr by 2055 (HVAC capex compounding) — expect insurance premiums to compound above CPI over the hold.
Questions for the listing agent
- What do current leases actually rent for vs. the listed asking? Can we see a recent rent roll and the last 12 months of T-12 income?
- It's been on market 41 days. Have you received any prior offers? Is the seller open to a 3% concession, seller financing, or rate buy-down credit?
- Property tax is high relative to price — has the assessment been appealed recently, and will the sale trigger a re-assessment?
- Is there a deadline driving the sale (1031 exchange, divorce, estate, relocation)? That informs how much negotiation room exists.
- Crime grade is F in this area — have there been break-ins, vandalism, or insurance claims at this property in the last 3 years? What carrier currently insures it and at what premium?
- The area grade is low — what's the realistic commute time and amenity access for the typical tenant pool here? Any planned neighborhood developments (good or bad) we should know about?
- What's the average days-on-market for RENTAL listings here right now (not sales)? A rising rental-DOM trend means longer vacancies and softer asking-rent achievability than the comps imply.
- What's the recent tenant-quality profile in this submarket — average credit score on applications, eviction rate, late-payment / NSF rate, and stable-employment percentage? A property-management company in the area should have these aggregated.
- How much new for-sale + rental construction is in the pipeline within 1–3 miles? Heavy new supply typically softens prices + rents 12–24 months out; constrained supply supports both.
Investment metrics
- 1% rule
- 0.64% ✗
- Cap rate
- 4.08%
- Cash-on-cash
- -7.89%
- DSCR
- 0.65
- GRM
- 13.0
CMA / ARV
- ARV (median comp)
- $299,109
- List price
- $55,000
- Delta
- -81.61%
- Verdict
- UNDERPRICED
- Comps
- 20 within 1.0 mi
Show comp detail 11 sales within ~0.75 mi
| Address | Dist | Beds/Ba | Sqft | Sold | Price | $/sf | Match |
|---|---|---|---|---|---|---|---|
| 7204 Kellner Cv | 0.17mi | 3/2.0 | 1,364 (+2%) | 2mo | $237,800 | $174 | 86 |
| 11600 Maybach Dr | 0.01mi | 3/2.0 | 1,325 (-0%) | 23mo | $280,000 | $211 | 80 |
| 7113 Apperson St | 0.11mi | 3/2.0 | 1,325 (-0%) | 22mo | $250,000 | $189 | 76 |
| 7200 Kellner Cv | 0.15mi | 3/2.0 | 1,347 (+1%) | 20mo | $315,000 | $234 | 75 |
| 11804 Savanna Canyon Ct | 0.38mi | 3/2.0 | 1,324 (-0%) | 10mo | $275,000 | $208 | 73 |
| 7200 Wardman Dr | 0.16mi | 3/2.0 | 1,201 (-10%) | 9mo | $230,000 | $192 | 69 |
| 6801 Campina Xing | 0.51mi | 3/2.0 | 1,324 (-0%) | 10mo | $259,900 | $196 | 67 |
| 11702 Maybach Dr | 0.08mi | 3/2.0 | 1,436 (+8%) | 19mo | $315,000 | $219 | 67 |
| 12005 Stoney Meadow Dr | 0.47mi | 3/2.0 | 1,324 (-0%) | 16mo | $269,000 | $203 | 64 |
| 6720 Campina Xing | 0.50mi | 3/2.0 | 1,324 (-0%) | 24mo | $279,900 | $211 | 56 |
| 12208 Stoney Meadow Dr | 0.67mi | 3/2.0 | 1,366 (+3%) | 10mo | $249,000 | $182 | 56 |
Match score weights: distance 35% · size 25% · config 20% · recency 20%. Top-matched comps best support the ARV.
Projected returns pro-forma
-3.0% appreciation · 0.0% rent growth · sell at horizon
- IRR
- -33.5%
- Equity multiple
- -0.06×
- Total profit
- $-89,129
- Equity at exit
- $44,598
- IRR
- -63.3%
- Equity multiple
- -0.72×
- Total profit
- $-144,386
- Equity at exit
- $25,861
Cash invested: $83,750 (down + closing). Projections, not guarantees.
Landlord ↔ Tenant lean methodology
- Overall (STATE)
- 87 Strongly Landlord-Friendly
- State Texas
- 87 Strongly Landlord-Friendly · R+5
- County
- — inherits STATE
- City
- — inherits STATE
ZIP-level market 78617
- Home prices YoY
- -1.7%
- Rents YoY
- -0.4%
- Active inventory
- 246
- Price-to-rent
- 2.4×
Monthly cashflow live
- Estimated rent
- $1,920 high interval (Pro) →
- Mortgage (P&I)
- −$1,569
- Tax est. 1.5%
- −$374 /mo · $4,487/yr
- Insurance
- −$125
- HOA
- −$0
- Vacancy / Maint / Mgmt
- −$403
- Net cashflow
- $-551
Break-even live
UW: 25.0% down · 7.5% · 30yr · 1.5% tax · 5.0% vac · 8.0% maint · 8.0% mgmt
Financing live
Cash to close
- Down payment
- $74,777
- Closing costs
- $8,973
- Reserves months
- —
- Total cash needed
- —
Loan-product check · same deal, 3 products live
Conventional
25% down · 7.5% · 30yr
- Down + closing
- —
- Monthly P&I
- —
- Monthly cashflow
- —
- DSCR
- —
- Eligible?
- —
Personal DTI + credit; lowest rate.
DSCR
20% down · 8.5% · 30yr
- Down + closing
- —
- Monthly P&I
- —
- Monthly cashflow
- —
- DSCR
- —
- Eligible?
- —
No personal income docs; deal must DSCR.
Hard money
10% down · 12.0% · 12mo
- Down + closing
- —
- Monthly P&I
- —
- Monthly cashflow
- —
- DSCR
- —
- Eligible?
- —
Short-term bridge; refi at stabilization.
Rent comps 25 comps
| Address | Beds | Baths | Sqft | Rent | $/sqft | DOM | Units | Dist |
|---|---|---|---|---|---|---|---|---|
| 11604 Railton Dr Del Valle, TX | 3.0 | 2.0 | 1218 | $1,950 | $1.60 | 43d | 1 | 0.03mi |
| 11724 Gemmer St Del Valle, TX | 3.0 | 2.0 | 1032 | $1,750 | $1.70 | 23d | 1 | 0.14mi |
| 7220 Wardman Dr Del Valle, TX | 3.0 | 2.0 | 1662 | $1,895 | $1.14 | 43d | 1 | 0.23mi |
| 11712 Morning View Dr Del Valle, TX | 4.0 | 2.0 | 1593 | $1,895 | $1.19 | 12d | 1 | 0.28mi |
| 7121 Elroy Rd Del Valle, TX | 1.0–3.0 | 1.0–2.0 | 951 | $2,006 | $2.11 | 1d | 26 | 0.46mi |
| 7232 Dancing Wind Ln Del Valle, TX | 3.0 | 2.5 | 1392 | $1,725 | $1.24 | 4d | 1 | 0.51mi |
| 7236 Dancing Wind Ln Del Valle, TX | 4.0 | 2.5 | 1566 | $1,750 | $1.12 | 43d | 1 | 0.52mi |
| 7100 Dancing Wind Ln Del Valle, TX | 3.0 | 2.5 | 1568 | $1,850 | $1.18 | 43d | 1 | 0.54mi |
| 7224 Spotted Leaf Way Del Valle, TX | 3.0 | 2.0 | 1646 | $1,950 | $1.18 | 14d | 1 | 0.56mi |
| 7136 Spotted Leaf Way Del Valle, TX | 3.0 | 2.5 | 1377 | $1,900 | $1.38 | 23d | 1 | 0.57mi |
| 12213 Rising Moon Ln Del Valle, TX | 4.0 | 2.5 | 1578 | $1,950 | $1.24 | 21d | 1 | 0.58mi |
| 6514 Ross Rd Del Valle, TX | 1.0–2.0 | 1.0–2.0 | 877 | $1,614 | $1.84 | 1d | 19 | 0.66mi |
| 12100 1/2 Ferrystone Glen Dr Unit 1240330P Del Valle, TX | 2.0 | 2.0 | 1140 | $3,728 | $3.27 | 20d | 1 | 0.69mi |
| 6420 Carriage Pines Dr Del Valle, TX | 3.0 | 2.5 | 1665 | $1,995 | $1.20 | 43d | 1 | 0.83mi |
| 6400 Wagon Spring St Del Valle, TX | 3.0 | 2.5 | 1665 | $1,975 | $1.19 | 4d | 1 | 0.83mi |
| 6409 Wagon Spring St Del Valle, TX | 4.0 | 2.0 | 1421 | $1,895 | $1.33 | 16d | 1 | 0.83mi |
| 6200 Albany Sleigh Dr Del Valle, TX | 3.0 | 2.0 | 1647 | $2,350 | $1.43 | 43d | 1 | 1.00mi |
| 6101 Ross Rd Del Valle, TX | 1.0–2.0 | 10.0 | 937 | $2,140 | $2.28 | 1d | 43 | 1.06mi |
| 12901 Staywell Way Del Valle, TX | 3.0 | 2.0 | 1860 | $2,200 | $1.18 | 43d | 1 | 1.11mi |
| 12305 Paloma Blanca Way Del Valle, TX | 3.0 | 2.0 | 1208 | $1,749 | $1.45 | 43d | 1 | 1.24mi |
| 5816 Ross Rd Unit 1 Del Valle, TX | 2.0 | 2.0 | 1134 | $1,725 | $1.52 | 23d | 1 | 1.26mi |
| 5820 Angel Dr Del Valle, TX | 3.0 | 2.0 | 1203 | $1,950 | $1.62 | 17d | 1 | 1.33mi |
| 5820 Angel Dr Del Valle, TX | 3.0 | 2.0 | 1203 | $1,850 | $1.54 | 2d | 1 | 1.33mi |
| 12417 Sky Harbor Dr Del Valle, TX | 3.0 | 2.0 | 1586 | $1,975 | $1.25 | 23d | 1 | 1.34mi |
| 12604 Paloma Blanca Way Del Valle, TX | 3.0 | 2.0 | 1423 | $1,700 | $1.19 | 16d | 1 | 1.39mi |
Listing history 7 events
-
2026-05-14status Pending 591-char remark
Show marketing remark (591 chars)
The list price is not indicative of seller's final reserve amount. This property is part of an online bidding event; please visit Auction.com to place bids. Inspections of this property and contact with occupants are strictly prohibited. Property is sold "as is" and no for sale sign allowed. List price is minimum starting bid amount. Seller, listing agent and broker have no firsthand knowledge about any features or condition of the property. Available information was gathered from other sources. There is no existing survey and no sellers disclosure. Auction dates 05/03-05/05
-
2026-04-03$55,000 Active 591-char remark
Show marketing remark (591 chars)
The list price is not indicative of seller's final reserve amount. This property is part of an online bidding event; please visit Auction.com to place bids. Inspections of this property and contact with occupants are strictly prohibited. Property is sold "as is" and no for sale sign allowed. List price is minimum starting bid amount. Seller, listing agent and broker have no firsthand knowledge about any features or condition of the property. Available information was gathered from other sources. There is no existing survey and no sellers disclosure. Auction dates 05/03-05/05
-
2026-03-09soldstatus
-
2021-09-28soldstatus
-
2021-09-27soldstatus Closed 725-char remark
Show marketing remark (725 chars)
Move In Ready! August 2021- Carpet Replaced, Interior Painted, Desirable One Story Home In Popular East Austin Close to Tesla, Circuit of the Americas, Toll 130, & Austin Bergstrom International Airport. Pre-Inspected. Very close to Popham Elementary- About 0.3 mi. Open Floor Plan, Lots of Natural Lighting, 2 Car Garage, Fenced Yard Tax estimate based on 2021 tax assessment value & 2020 tax rate (2021 tax rates are not out yet). Buyer to independently verify all information including but not limited to square footage, lot size, restrictions, taxes, schools, etc. Regarding the ETJ mls question, per the jurisdiction map it says "Austin LTD": https://www. austintexas. gov/GIS/JurisdictionsWebMap/
-
2021-08-31historical Active Under Contract 725-char remark
Show marketing remark (725 chars)
Move In Ready! August 2021- Carpet Replaced, Interior Painted, Desirable One Story Home In Popular East Austin Close to Tesla, Circuit of the Americas, Toll 130, & Austin Bergstrom International Airport. Pre-Inspected. Very close to Popham Elementary- About 0.3 mi. Open Floor Plan, Lots of Natural Lighting, 2 Car Garage, Fenced Yard Tax estimate based on 2021 tax assessment value & 2020 tax rate (2021 tax rates are not out yet). Buyer to independently verify all information including but not limited to square footage, lot size, restrictions, taxes, schools, etc. Regarding the ETJ mls question, per the jurisdiction map it says "Austin LTD": https://www. austintexas. gov/GIS/JurisdictionsWebMap/
-
2021-08-14$299,900 Active 725-char remark
Show marketing remark (725 chars)
Move In Ready! August 2021- Carpet Replaced, Interior Painted, Desirable One Story Home In Popular East Austin Close to Tesla, Circuit of the Americas, Toll 130, & Austin Bergstrom International Airport. Pre-Inspected. Very close to Popham Elementary- About 0.3 mi. Open Floor Plan, Lots of Natural Lighting, 2 Car Garage, Fenced Yard Tax estimate based on 2021 tax assessment value & 2020 tax rate (2021 tax rates are not out yet). Buyer to independently verify all information including but not limited to square footage, lot size, restrictions, taxes, schools, etc. Regarding the ETJ mls question, per the jurisdiction map it says "Austin LTD": https://www. austintexas. gov/GIS/JurisdictionsWebMap/
ⓘ Source: listings_history table (triggers on properties + properties_extension) + one-shot
backfill from property_details.listing_events for pre-trigger history.
Climate risk First Street
- Flood 1/10 Low FEMA zone X (unshaded) · 0% chance over 30 yrs
- Wildfire 5/10 Major
- Heat 8/10 Severe 7 d/yr ≥110°F today · 23 d/yr by 30 yrs out
- Wind 8/10 Severe 80% chance of damaging wind over 30 yrs
- Air quality 1/10 Low 0 unhealthy d/yr today · 0 by 30 yrs out
Nearby sold comps map
Loading sold comps map…
Walkable amenities ~0.75 mi
Loading nearby amenities…
Taxation est. · year 1
- Rental income
- $23,036
- − Mortgage interest
- −$16,755
- − Property taxes
- −$4,487
- − Insurance
- −$1,496
- − Repairs & maintenance
- −$1,843
- − Management
- −$1,843
- − Depreciation
- −$8,701
- Taxable loss
- −$12,088
- Est. tax savings @ 24.0%
- +$2,901
- After-tax cash flow
- $-3,705/yr
For passive investors: Depreciation is non-cash, so a rental often shows a tax loss while cash-flowing — sheltering income. Rental losses are passive: they offset passive income freely, and up to $25,000/yr can offset ordinary (W-2) income if you actively participate and your MAGI is under $100k (phasing out to $0 by $150k); unused losses carry forward. On sale, claimed depreciation is recaptured at up to 25%, and gains may owe capital-gains tax (a 1031 exchange can defer both). Figures are a year-1 estimate at your 24.0% rate — not tax advice; consult a CPA.
Schools (NCES district)
- District
- Del Valle ISD
- NCES district ID
- 4816620
- Math proficiency
- 19% ▼ -13.00%
- Reading proficiency
- 26% ▼ -2.00%
- Median HH income
- $41,322
- Composite
- 19.13/100
- National rank
- #8830
- State rank
- #749 of 826 in TX
Livability — Austin
- Score
- 82/100
- State rank
- #16
- US rank
- #1208
Category grades
Schools grade is shown separately in the Schools card above.
Census & demographics
- Census place
- Austin, TX
- County
- Travis County · 1,299,254 people
- City population
- 1,066,854
- Metro
- Austin-Round Rock-Georgetown, TX
- Population (ZIP)
- 30,756
- Household income
- $71,640
- Rent vs Own
- Severe rent burden
- 681.0
Population outlook (Travis County) Hauer SSP2
- Today (2025)
- 1,545,133 people
- By 2030
- 1,729,269 · +11.9%
- By 2040
- 2,097,596 · +35.8%
- By 2050
- 2,463,890 · +59.5%
- By 2075
- 3,249,374 · +110.3%
- By 2100
- 3,801,868 · +146.1%
Race, ethnicity, and origin ACS 2023
- Neighborhood character
- Predominantly Hispanic (75%)
- Race & ethnicity
- Hispanic / Latino 75% Two or more races 33% White 16% Black 6% Asian 1%
- Hispanic origin (detail)
- Mexican 68% Puerto Rican 1%
- Common ancestry
- Romanian 1%
- Foreign-born
- 26% · Canada
- Languages at home
- 41% English-only · Spanish 57% Other Asian/Pacific 1%
Political lean MEDSL · Travis
- 2024 margin
- Solid D (+39.3) · D 68.8% · R 29.4% · Other 1.8%
- 2008→2024 swing
- +9.9pp toward D · 2008: 29.4pp · 2024: 39.3pp
- All cycles
- 2024: D+39.3 2020: D+45.0 2016: D+38.9 2012: D+23.9 2008: D+29.4
Not yet ingested
- Civics
- —
Market trends
- HPI YoY
- ▼ -3.24%
- Current HPI
- 192.3518
- Rent YoY
- ▼ -0.36%
- Metro
- Austin-Round Rock-Georgetown, TX
- State GDP YoY
- ▲ 3.95%
- F500 in state
- 110
Industry mix (Fortune 500 HQ in TX)
| Industry | F500 HQs | Revenue |
|---|---|---|
| Energy | 16 | $1,198B |
|
||
| Technology | 5 | $198B |
|
||
| Engineering / Construction | 4 | $72B |
|
||
| Energy Services | 3 | $60B |
|
||
| Utilities | 3 | $41B |
|
||
| Healthcare | 2 | $330B |
|
||
Price history
-81.7% since first listed7 events — show timeline
- 2026-05-14 Pending — Unlock MLS
- 2026-04-03 Listed $55,000 Unlock MLS
- 2026-03-09 Sold (Public Records) — Public Records
- 2021-09-28 Sold (Public Records) — Public Records
- 2021-09-27 Sold (MLS) — Unlock MLS
- 2021-08-31 Contingent — Unlock MLS
- 2021-08-14 Listed $299,900 Unlock MLS
Property tax history
+3.1%/yrLatest (2026): $5,646 · +3.7% YoY. Source: county tax records.
Cash-flow waterfall
monthlySold comps — $/sqft
last 12 mo · ≤1 miLoading sold comps…