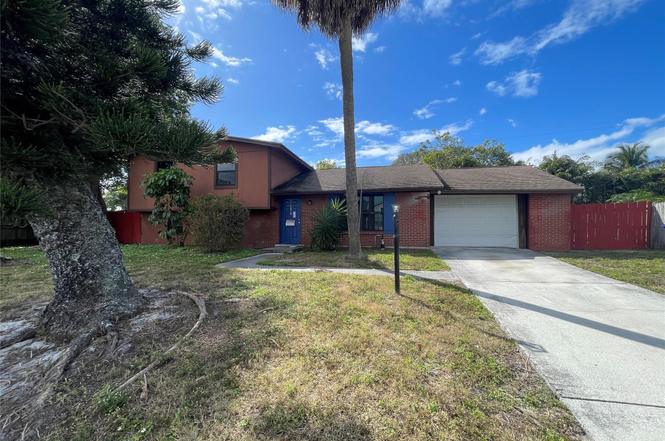
1610 Flagler Blvd · Lake Park, FL
Flood risk 4/10 · Minor
- FEMA flood zone
- X (unshaded)
- Chance of flooding over 30 yrs
- 0.22%
- Est. flood insurance / yr
- $507 – $1,088
Fire risk 1/10 · Minimal
- Est. fire insurance / yr
- $947 – $1,759
Heat risk 10/10 · Severe
- Hot days now (above 106°F)
- 7 days/yr
- Hot days in 30 yrs
- 25 days/yr
Wind risk 10/10 · Severe
- Chance of severe wind over 30 yrs
- 99.0%
Air-quality risk 2/10 · Minimal
- Unhealthy air days now
- 0 days/yr
- Unhealthy air days in 30 yrs
- 1 days/yr
Risk factors via First Street. Map © Google.
Why this score? — see what drove the B grade
The composite is a weighted blend of 9 inputs, each scored 0–100. Each bar is that input's sub-score; the figure is the points it added to the 100-point composite (weight × sub-score).
- Cash flow +25.8/30.0
- ARV discount +15.0/15.0
- DSCR +8.6/10.0
- 1% rule +7.6/10.0
- Schools +4.3/10.0
- Rent growth +4.0/5.0
- Livability +3.4/5.0
- Condition / age +2.5/5.0
- Appreciation +0.0/10.0
$365,000
🖨 Deal sheet (PDF) 📄 Offer letter ✓ Due diligence
Listing remarks
ESTATE SALE | Exceptional Value Opportunity in Coastal Lake Park!Located in a charming waterfront town along the Intracoastal Waterway, this split-level pool home offers outstanding upside for the savvy buyer. Priced to reflect its estate status, The home is in average condition and ready for light value-add improvements such as landscaping, pool refresh, and minor maintenance to unlock its full potential. Interior features include a spacious ceramic-tiled family room on the entry level, an upper level with kitchen, dining area, and bath, and a top floor with two bedrooms showcasing attractive wood floors. Ideal for investors, first-time buyers, or anyone seeking a coastal property with ups
Key facts
- Coastal lake park
- Wood floors
- 0.23 acre lot
Tags
Property features AI
Finance
- HOA & community: No association amenities; Senior community
Exterior
- Parking: 1-car garage; 1 covered space; Driveway
- Utilities: Public water; Public sewer
- Home design: Single family residence; Two-story home; First-floor entry; North-facing
- Construction: Brick and frame construction; Composition roof; Built as resale property
- Exterior features: Patio; Porch; Private in-ground pool; Not waterfront
Interior
- Kitchen: Electric Range; Gas Range; Refrigerator; Water Purifier; Water Softener
- Bedrooms: 2 bedrooms on the main level
- Flooring: Ceramic tile; Wood
- Bathrooms: 2 full bathrooms (1 on the main level)
- Heating & cooling: Central heating; Central air conditioning
- Interior features: Electric and gas ranges; Refrigerator; Water purifier; Water softener; Fireplace
Neighborhood map
What this means for you Summary
Snapshot
- This is a 3-bed/2.0-bath single-family listed at $365k.
Deal economics
- At list price, monthly cash flow is $885 ($11k/yr) — positive.
- The deal already cash-flows at list — no discount required.
- Meets the 1% rule at list price ($5k rent vs $365k).
- Recommended offer: $332k (9.0% below list) — sets the bar for market timing.
Location & tenants
- Location reads 67/100 on livability (#542 in FL) — a middle-class / working-renter tenant base. Strengths: housing A+, health & safety A+, cost of living A-; Watch: crime F, amenities F, commute F.
- Palm Beach (suburban): math 46% / reading 53% proficiency, ranked #34 of 73 in FL (top 47%) — families likely to look elsewhere, expect single-tenant / working-renter base with shorter leases.
- Zoned schools: Howell L. Watkins Middle School (math 18% / reading 33%, grade F, #512 of 571 statewide, top 90%, 794 students, 76% FRL); Palm Beach Gardens High School (math 19% / reading 40%, grade F, #447 of 667 statewide, top 68%, 2,570 students, 61% FRL) — zoned schools average 69% FRL vs 52% district-wide (17 pts higher); higher-poverty schools than district average — tighter screening recommended.
- Zoned-school proficiency averages 28% at this address vs 50% district-wide (-22 pts) — the specific schools serving this property underperform the Palm Beach average; the district grade overstates school quality for this exact location.
- Market conditions: Rents rising fast (+6.0%/yr); 134 active listings in the ZIP; 38 comparable units currently listed for rent nearby; rentals at typical pace (median 26d on market — plan ~3-4 weeks tenant-placement turnaround); 3,974 units permitted in Palm Beach County in 2024 (1,012 in 5+ unit buildings).
- At $4,591/mo this rent would consume 78% of the median local household income ($71k/yr) (locally 903% of renters already pay >50% of income on rent) — very limited rent-growth headroom before tenants either downsize or default.
Forward outlook
- Local home prices are declining (-3.0%/yr); year-one equity from $3k of loan paydown is wiped out by about $11k of value loss. Plan a longer hold.
- Palm Beach County population projected at +30% by 2050 — long-run rental-demand tailwind backs the buy-and-hold thesis.
- At projected returns (-3.0% appreciation + 6.0% rent growth), your $102k cash investment doubles in ~8 years — after that, you're playing with house money.
Negotiation context
- It's been on market 91 days — a 9% lower offer ($332k) is reasonable based on typical stale-listing flexibility.
- Current owner paid $57k; list at $365k implies a 545% gain — meaningful room to come down on a strong offer.
Risks & watch-outs
- Climate carrying-cost: severe wind risk, 99% chance of damaging wind over 30y; extreme-heat days projected 7→25/yr by 2055 (HVAC capex compounding) — expect insurance premiums to compound above CPI over the hold.
Questions for the listing agent
- It's been on market 91 days. Have you received any prior offers? Is the seller open to a 9% concession, seller financing, or rate buy-down credit?
- Built in 1961 — when were the roof, HVAC, electrical panel, plumbing, and water heater last replaced?
- Why hasn't it sold? Are there any deal-killer items the seller is aware of (foundation, flood, title, zoning, code violations)?
- Is there a deadline driving the sale (1031 exchange, divorce, estate, relocation)? That informs how much negotiation room exists.
- Schools are B-rated — typically a magnet for longer-tenancy family renters. What's the average tenant stay here, and is there a school-zone premium baked into asking?
- Crime grade is F in this area — have there been break-ins, vandalism, or insurance claims at this property in the last 3 years? What carrier currently insures it and at what premium?
- What's the average days-on-market for RENTAL listings here right now (not sales)? A rising rental-DOM trend means longer vacancies and softer asking-rent achievability than the comps imply.
- What's the recent tenant-quality profile in this submarket — average credit score on applications, eviction rate, late-payment / NSF rate, and stable-employment percentage? A property-management company in the area should have these aggregated.
- How much new for-sale + rental construction is in the pipeline within 1–3 miles? Heavy new supply typically softens prices + rents 12–24 months out; constrained supply supports both.
Investment metrics
- 1% rule
- 1.26% ✓
- Cap rate
- 9.20%
- Cash-on-cash
- 10.39%
- DSCR
- 1.46
- GRM
- 6.6
CMA / ARV
- ARV (on-the-fly)
- $598,400
- Comps found
- 1
Show comp detail 1 sale within ~0.75 mi
| Address | Dist | Beds/Ba | Sqft | Sold | Price | $/sf | Match |
|---|---|---|---|---|---|---|---|
| 830 Seminole Blvd | 0.57mi | 3/2.5 | 1,700 (0%) | 14mo | $599,000 | $352 | 60 |
Match score weights: distance 35% · size 25% · config 20% · recency 20%. Top-matched comps best support the ARV.
Projected returns pro-forma
-3.0% appreciation · 5.97% rent growth · sell at horizon
- IRR
- 2.8%
- Equity multiple
- 1.11×
- Total profit
- $11,533
- Equity at exit
- $54,423
- IRR
- 15.2%
- Equity multiple
- 2.42×
- Total profit
- $145,042
- Equity at exit
- $31,559
Cash invested: $102,200 (down + closing). Projections, not guarantees.
Landlord ↔ Tenant lean methodology
- Overall (STATE)
- 87 Strongly Landlord-Friendly
- State Florida
- 87 Strongly Landlord-Friendly · R+3
- County
- — inherits STATE
- City
- — inherits STATE
ZIP-level market 33403
- Home prices YoY
- -19.6%
- Rents YoY
- 6.0%
- Active inventory
- 134
- Price-to-rent
- 6.6×
Monthly cashflow live
- Estimated rent
- $4,591 high interval (Pro) →
- Mortgage (P&I)
- −$1,914
- Tax from tax record
- −$676 /mo · $8,109/yr
- Insurance
- −$152
- HOA
- −$0
- Vacancy / Maint / Mgmt
- −$964
- Net cashflow
- $885
Break-even live
Sensitivity live
| Price | -10% $1,091 | -5% $988 | +0% $885 | +5% $781 | +10% $678 |
|---|---|---|---|---|---|
| Rent | -10% $522 | -5% $703 | +0% $885 | +5% $1,066 | +10% $1,247 |
| Rate | -1.0pp $1,069 | -0.5pp $978 | base $885 | +0.5pp $790 | +1.0pp $694 |
UW: 25.0% down · 7.5% · 30yr · 1.5% tax · 5.0% vac · 8.0% maint · 8.0% mgmt
Financing live
Cash to close
- Down payment
- $91,250
- Closing costs
- $10,950
- Reserves months
- —
- Total cash needed
- —
Loan-product check · same deal, 3 products live
Conventional
25% down · 7.5% · 30yr
- Down + closing
- —
- Monthly P&I
- —
- Monthly cashflow
- —
- DSCR
- —
- Eligible?
- —
Personal DTI + credit; lowest rate.
DSCR
20% down · 8.5% · 30yr
- Down + closing
- —
- Monthly P&I
- —
- Monthly cashflow
- —
- DSCR
- —
- Eligible?
- —
No personal income docs; deal must DSCR.
Hard money
10% down · 12.0% · 12mo
- Down + closing
- —
- Monthly P&I
- —
- Monthly cashflow
- —
- DSCR
- —
- Eligible?
- —
Short-term bridge; refi at stabilization.
Rent comps 38 comps
| Address | Beds | Baths | Sqft | Rent | $/sqft | DOM | Units | Dist |
|---|---|---|---|---|---|---|---|---|
| 308 Southwind Ct Unit 8 North Palm Beach, FL | 2.0 | 2.0 | 1100 | $2,900 | $2.64 | 25d | 1 | 0.21mi |
| 624 Southwind Cir Apt 4 North Palm Beach, FL | 3.0 | 2.0 | 1134 | $4,750 | $4.19 | 25d | 1 | 0.28mi |
| 624 Southwind Cir Unit 3 North Palm Beach, FL | 3.0 | 3.0 | 1316 | $5,500 | $4.18 | 25d | 1 | 0.28mi |
| 620 Southwind Cir Unit A North Palm Beach, FL | 3.0 | 2.0 | 1697 | $4,200 | $2.47 | 25d | 1 | 0.28mi |
| 561 Anchorage Dr North Palm Beach, FL | 3.0 | 2.0 | 1924 | $5,900 | $3.07 | 0d | 1 | 0.42mi |
| 2545 Conroy Dr West Palm Beach, FL | 3.0 | 2.0 | 1066 | $3,295 | $3.09 | 25d | 1 | 0.45mi |
| 549 Fairwind Dr North Palm Beach, FL | 3.0 | 2.0 | 1498 | $5,000 | $3.34 | 25d | 1 | 0.59mi |
| 517 Gulf Rd North Palm Beach, FL | 3.0 | 2.0 | 1657 | $5,500 | $3.32 | 25d | 1 | 0.60mi |
| 855 Date Palm Dr West Palm Beach, FL | 3.0 | 3.0 | 1216 | $3,150 | $2.59 | 25d | 1 | 0.74mi |
| 429 Inlet Rd North Palm Beach, FL | 3.0 | 2.5 | 1452 | $6,500 | $4.48 | 25d | 1 | 0.78mi |
| 301 Hawthorne Dr West Palm Beach, FL | 3.0 | 2.0 | 1402 | $3,200 | $2.28 | 25d | 1 | 0.79mi |
| 708 Westwind Dr North Palm Beach, FL | 3.0 | 2.0 | 1761 | $4,000 | $2.27 | 25d | 1 | 0.80mi |
| 547 Marlin Rd North Palm Beach, FL | 3.0 | 2.0 | 1880 | $9,900 | $5.27 | 25d | 1 | 0.83mi |
| 913 Lighthouse Dr North Palm Beach, FL | 3.0 | 2.5 | 1092 | $5,900 | $5.40 | 25d | 1 | 0.87mi |
| 712 Tradewind Dr North Palm Beach, FL | 4.0 | 3.0 | 1616 | $6,500 | $4.02 | 25d | 1 | 0.88mi |
| 908 Lighthouse Dr North Palm Beach, FL | 3.0 | 2.0 | 1478 | $4,250 | $2.88 | 25d | 1 | 0.89mi |
| 733 Waterway Dr North Palm Beach, FL | 2.0 | 2.0 | 1590 | $11,500 | $7.23 | 25d | 1 | 0.91mi |
| 736 Prosperity Farms Rd North Palm Beach, FL | 4.0 | 2.0 | 1556 | $6,950 | $4.47 | 25d | 1 | 0.92mi |
| 735 Tradewind Dr North Palm Beach, FL | 4.0 | 2.0 | 1901 | $6,700 | $3.52 | 25d | 1 | 0.92mi |
| 815 Silver Beach Rd Lake Park, FL | 4.0 | 3.0 | 1480 | $3,000 | $2.03 | 25d | 1 | 0.94mi |
| 250 Foresteria Dr West Palm Beach, FL | 4.0 | 3.0 | 2080 | $11,500 | $5.53 | 22d | 1 | 0.98mi |
| 913 Lake Shore Dr Lake Park, FL | 1.0–2.0 | 1.0–2.0 | 1066 | $3,731 | $3.50 | 0d | 10 | 1.03mi |
| 1155 Lake Shore Dr #202 West Palm Beach, FL | 2.0 | 2.0 | 1206 | $4,750 | $3.94 | 25d | 1 | 1.10mi |
| 756 Cinnamon Rd North Palm Beach, FL | 4.0 | 2.0 | 1324 | $6,600 | $4.98 | 25d | 1 | 1.11mi |
| 1060 Lake Shore Dr #201 West Palm Beach, FL | 2.0 | 2.0 | 1206 | $3,850 | $3.19 | 20d | 1 | 1.12mi |
| 2539 Wabash Dr West Palm Beach, FL | 3.0 | 2.5 | 1468 | $5,500 | $3.75 | 25d | 1 | 1.20mi |
| 732 Pelican Way North Palm Beach, FL | 3.0 | 2.0 | 1728 | $4,950 | $2.86 | 25d | 1 | 1.23mi |
| 301 Lake Shore Dr #802 West Palm Beach, FL | 2.0 | 2.0 | 1316 | $3,000 | $2.28 | 25d | 1 | 1.29mi |
| 1389 W 33rd St Riviera Beach, FL | 4.0 | 3.0 | 1737 | $3,000 | $1.73 | 25d | 1 | 1.30mi |
| 220 Lake Shore Dr Unit 304 Lake Park, FL | 2.0 | 2.5 | 1911 | $11,500 | $6.02 | 25d | 1 | 1.30mi |
| 220 Lake Shore Dr Lake Park, FL | 1.0–3.0 | 1.5–3.5 | 2134 | $25,000 | $11.72 | 0d | 19 | 1.31mi |
| 379 Garden Blvd Palm Beach Gardens, FL | 4.0 | 2.0 | 1642 | $4,500 | $2.74 | 25d | 1 | 1.37mi |
| 111 W 35th St Riviera Beach, FL | 4.0 | 2.0 | 1600 | $3,000 | $1.88 | 13d | 1 | 1.37mi |
| 2745 Omega Pl North Palm Beach, FL | 4.0 | 2.0 | 2190 | $5,500 | $2.51 | 25d | 1 | 1.41mi |
| 343 Balsam St Palm Beach Gardens, FL | 4.0 | 2.0 | 1414 | $4,000 | $2.83 | 25d | 1 | 1.47mi |
| 337 Balsam St Palm Beach Gardens, FL | 4.0 | 2.0 | 1426 | $5,500 | $3.86 | 20d | 1 | 1.47mi |
| 2226 Oakmont Dr Riviera Beach, FL | 3.0 | 2.5 | 1972 | $2,850 | $1.45 | 25d | 1 | 1.48mi |
| 10174 Plum St Palm Beach Gardens, FL | 3.0 | 2.0 | 1546 | $3,800 | $2.46 | 25d | 1 | 1.49mi |
Listing history 12 events
-
2026-06-13statusdays on market $365,000 Pending 91 DOM
-
2026-06-09days on market $365,000 Active 90 DOM
-
2026-06-08days on market $365,000 Active 89 DOM
-
2026-06-07pricedays on market $365,000 Active 88 DOM
-
2026-06-04days on market $349,000 Active 85 DOM
-
2026-06-03days on market $349,000 Active 84 DOM
-
2026-06-02days on market $349,000 Active 83 DOM
-
2026-06-01days on market $349,000 Active 82 DOM
-
2026-05-31days on market $349,000 Active 81 DOM
-
2026-03-15historical Active Under Contract
-
2026-02-05$389,000 Active
-
1976-03-01soldstatus $56,600
ⓘ Source: listings_history table (triggers on properties + properties_extension) + one-shot
backfill from property_details.listing_events for pre-trigger history.
Tax reassessment forecast FL · Resets to sale price
- Current annual tax
- $8,109 · $676/mo
- Projected year-2 tax
- $8,109 · $676/mo
- Expected delta
- $0/yr ($0/mo · 0.0%)
ⓘ Screening estimate from a state-policy table — verify with the county assessor before closing.
Climate risk First Street
- Flood 4/10 Moderate FEMA zone X (unshaded) · 22% chance over 30 yrs
- Wildfire 1/10 Low
- Heat 10/10 Extreme 7 d/yr ≥106°F today · 25 d/yr by 30 yrs out
- Wind 10/10 Extreme 99% chance of damaging wind over 30 yrs
- Air quality 2/10 Low 0 unhealthy d/yr today · 1 by 30 yrs out
Nearby sold comps map
Loading sold comps map…
Walkable amenities ~0.75 mi
Loading nearby amenities…
Taxation est. · year 1
- Rental income
- $55,088
- − Mortgage interest
- −$20,446
- − Property taxes
- −$8,109
- − Insurance
- −$1,825
- − Repairs & maintenance
- −$4,407
- − Management
- −$4,407
- − Depreciation
- −$10,618
- Taxable income
- $5,277
- Est. tax owed @ 24.0%
- −$1,266
- After-tax cash flow
- $9,350/yr
For passive investors: Depreciation is non-cash, so a rental often shows a tax loss while cash-flowing — sheltering income. Rental losses are passive: they offset passive income freely, and up to $25,000/yr can offset ordinary (W-2) income if you actively participate and your MAGI is under $100k (phasing out to $0 by $150k); unused losses carry forward. On sale, claimed depreciation is recaptured at up to 25%, and gains may owe capital-gains tax (a 1031 exchange can defer both). Figures are a year-1 estimate at your 24.0% rate — not tax advice; consult a CPA.
Schools (NCES district)
- District
- Palm Beach
- NCES district ID
- 1201500
- Math proficiency
- 46% ▼ -16.00%
- Reading proficiency
- 53% ▼ -4.00%
- Median HH income
- $53,943
- Composite
- 42.72/100
- National rank
- #3160
- State rank
- #34 of 73 in FL
Livability — Lake Park
- Score
- 67/100
- State rank
- #542
- US rank
- #10167
Category grades
Schools grade is shown separately in the Schools card above.
Census & demographics
- Census place
- Lake Park, FL
- County
- Palm Beach County · 1,438,312 people
- City population
- 14,370
- Metro
- Miami-Fort Lauderdale-Pompano Beach, FL
- Population (ZIP)
- 14,370
- Household income
- $70,646
- Rent vs Own
- Severe rent burden
- 903.0
Population outlook (Palm Beach County) Hauer SSP2
- Today (2025)
- 1,637,487 people
- By 2030
- 1,743,255 · +6.5%
- By 2040
- 1,948,712 · +19.0%
- By 2050
- 2,132,979 · +30.3%
- By 2075
- 2,530,027 · +54.5%
- By 2100
- 2,706,979 · +65.3%
Race, ethnicity, and origin ACS 2023
- Neighborhood character
- Diverse neighborhood (Simpson 0.67)
- Race & ethnicity
- Black 46% White 31% Hispanic / Latino 17% Two or more races 12% Asian 2%
- Hispanic origin (detail)
- Mexican 3% Puerto Rican 4% Cuban 5%
- Common ancestry
- Hispanic 15% Italian 2% Romanian 1%
- Foreign-born
- 26% · Canada, China, Jamaica
- Languages at home
- 69% English-only · French/Haitian/Cajun 17% Spanish 12% Chinese 1%
Political lean MEDSL · Palm Beach
- 2024 margin
- Toss-up / Even · D 50.0% · R 49.2%
- 2008→2024 swing
- -22.1pp toward R · 2008: 22.9pp · 2024: 0.8pp
- All cycles
- 2024: D+0.8 2020: D+12.8 2016: D+15.3 2012: D+17.0 2008: D+22.9
Not yet ingested
- Civics
- —
Market trends
- HPI YoY
- ▼ -112.30%
- Current HPI
- 461.4045
- Rent YoY
- ▲ 5.97%
- Metro
- Miami-Fort Lauderdale-Pompano Beach, FL
- State GDP YoY
- ▲ 3.28%
- F500 in state
- 36
Industry mix (Fortune 500 HQ in FL)
| Industry | F500 HQs | Revenue |
|---|---|---|
| Industrial Technology | 2 | $29B |
|
||
| Insurance | 2 | $17B |
|
||
| Retail | 1 | $60B |
|
||
| Technology Distribution | 1 | $58B |
|
||
| Homebuilding | 1 | $35B |
|
||
| Technology Manufacturing | 1 | $35B |
|
||
Price history
+587.3% since first listed3 events — show timeline
- 2026-03-15 Contingent — Beaches MLS
- 2026-02-05 Listed $389,000 Beaches MLS
- 1976-03-01 Sold (Public Records) $56,600 Public Records
Property tax history
+6.4%/yrLatest (2025): $8,109 · +3.1% YoY. Source: county tax records.
Cash-flow waterfall
monthlySold comps — $/sqft
last 12 mo · ≤1 miLoading sold comps…