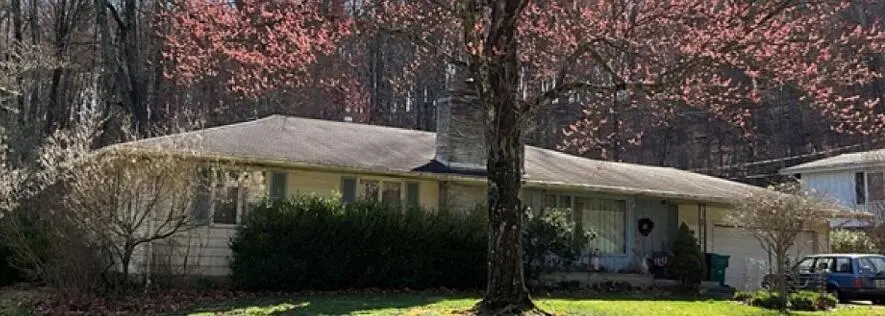
1535 Pleasant Valley Dr · Newark, OH
Flood risk 7/10 · Major
- FEMA flood zone
- X (unshaded)
- Chance of flooding over 30 yrs
- 0.76%
- Est. flood insurance / yr
- $473 – $860
Fire risk 1/10 · Minimal
- Est. fire insurance / yr
- $713 – $1,323
Heat risk 3/10 · Minor
- Hot days now (above 100°F)
- 6 days/yr
- Hot days in 30 yrs
- 16 days/yr
Wind risk 2/10 · Minimal
- Chance of severe wind over 30 yrs
- —
Air-quality risk 2/10 · Minimal
- Unhealthy air days now
- 1 days/yr
- Unhealthy air days in 30 yrs
- 3 days/yr
Risk factors via First Street. Map © Google.
Why this score? — see what drove the B grade
The composite is a weighted blend of 9 inputs, each scored 0–100. Each bar is that input's sub-score; the figure is the points it added to the 100-point composite (weight × sub-score).
- Cash flow +30.0/30.0
- 1% rule +10.0/10.0
- DSCR +10.0/10.0
- ARV discount +7.5/15.0
- Schools +4.3/10.0
- Livability +3.5/5.0
- Rent growth +2.9/5.0
- Condition / age +2.5/5.0
- Appreciation +0.0/10.0
$89,900
🖨 Deal sheet 📄 Offer letter ✓ Due diligence
Listing remarks
Live Public Reserve Real Estate Auction opportunity as well as online bidding available. The list price reflects the Reserve Bid at auction. The live and simultaneous online auction is June 20th, 2026 at 5:00pm. The online auction portion as pre-bidding begins now and the pre-bidding will end June 20th, 2026 at 4:30pm and live real time online bidding will begin June 20th, 2026 at 5:00pm. The Home will be open at 3pm June 20th, 2026 for preview and bidder registration. Auction Terms & Conditions provided by request and on the auction website. The property sells AS-IS without contingencies. This Newark home sits in a mature quiet neighborhood within Newark City School district. There a
Key facts
- 0.3 acre lot
- 2 garage spots
- Built 1962
Property features AI
Finance
- Other: Listing subject to trust and auction conditions
Exterior
- Parking: Attached garage with garage door opener; 2-car garage
- Utilities: Public water; Public sewer
- Home design: Single-family home; One story; Built in 1962; No shared/common walls
- Construction: Block foundation
- Exterior features: Fenced yard
Interior
- Bedrooms: Four main-level bedrooms
- Flooring: Carpet; Vinyl
- Bathrooms: Two full bathrooms and one half bathroom (2.5 total)
- Heating & cooling: Forced-air heating; Central air conditioning
- Interior features: Insulated partial windows; Two fireplaces; Full basement
Neighborhood map
What this means for you Summary
Snapshot
- This is a 4-bed/2.5-bath single-family listed at $90k.
Deal economics
- At list price, monthly cash flow is $414 ($5k/yr) — positive.
- The deal already cash-flows at list — no discount required.
- Meets the 1% rule at list price ($2k rent vs $90k).
- Cap rate 12.6% vs local median 3.2% in Newark — top-decile yield for the area; either an underpriced asset or a hidden risk that comps aren't pricing in. Stress-test before assuming the spread holds.
Location & tenants
- Location reads 69/100 on livability (#493 in OH) — a middle-class / working-renter tenant base. Strengths: cost of living A+, housing A+, schools B; Watch: employment D+, amenities F, commute F.
- Newark City (suburban): math 48% / reading 56% proficiency, ranked #431 of 656 in OH (top 66%) — acceptable for families but not a draw, mixed tenant base, ~2y average lease.
- Market conditions: Rents rising (+1.6%/yr); 204 active listings in the ZIP; 1 comparable units currently listed for rent nearby; 159 units permitted in Licking County in 2024 (0 in 5+ unit buildings).
Forward outlook
- Local home prices are declining (-3.0%/yr); year-one equity from $622 of loan paydown is wiped out by about $3k of value loss. Plan a longer hold.
- At projected returns (-3.0% appreciation + 1.6% rent growth), your $25k cash investment doubles in ~7 years — after that, you're playing with house money.
Negotiation context
- Only 12 days on market — expect competitive offers; lowballing is unlikely to land.
Risks & watch-outs
- Watch-outs: property tax is 3.4% of price; flood insurance adds $56/mo.
- Climate carrying-cost: major flood risk — expect insurance premiums to compound above CPI over the hold.
Questions for the listing agent
- Built in 1962 — when were the roof, HVAC, electrical panel, plumbing, and water heater last replaced?
- Property tax is high relative to price — has the assessment been appealed recently, and will the sale trigger a re-assessment?
- What's the actual annual flood-insurance premium (NFIP or private), and is the property in a SFHA with mandatory coverage?
- Is there a deadline driving the sale (1031 exchange, divorce, estate, relocation)? That informs how much negotiation room exists.
- Schools are B-rated — typically a magnet for longer-tenancy family renters. What's the average tenant stay here, and is there a school-zone premium baked into asking?
- What's the average days-on-market for RENTAL listings here right now (not sales)? A rising rental-DOM trend means longer vacancies and softer asking-rent achievability than the comps imply.
- What's the recent tenant-quality profile in this submarket — average credit score on applications, eviction rate, late-payment / NSF rate, and stable-employment percentage? A property-management company in the area should have these aggregated.
- How much new for-sale + rental construction is in the pipeline within 1–3 miles? Heavy new supply typically softens prices + rents 12–24 months out; constrained supply supports both.
Investment metrics
- 1% rule
- 1.74% ✓
- Cap rate
- 12.55%
- Cash-on-cash
- 22.36%
- DSCR
- 1.99
- GRM
- 4.8
CMA / ARV
- ARV (on-the-fly)
- $296,334
- Comps found
- 8
Show comp detail 8 sales within ~0.75 mi
| Address | Dist | Beds/Ba | Sqft | Sold | Price | $/sf | Match |
|---|---|---|---|---|---|---|---|
| 1188 Howell Ct | 0.16mi | 3/3.0 (-1) | 1,433 (-2%) | 0mo | $350,000 | $244 | 81 |
| 1575 Russett Ln | 0.38mi | 4/2.0 | 1,321 (-10%) | 6mo | $330,000 | $250 | 59 |
| 787 Country Club Dr | 0.36mi | 3/1.0 (-1) | 1,385 (-6%) | 7mo | $280,000 | $202 | 57 |
| 1476 Pleasant Valley Dr | 0.11mi | 3/2.0 (-1) | 1,652 (+13%) | 13mo | $329,900 | $200 | 56 |
| 1271 Granville Rd | 0.68mi | 3/2.0 (-1) | 1,484 (+1%) | 19mo | $321,000 | $216 | 43 |
| 1142 Granville Rd | 0.66mi | 3/1.5 (-1) | 1,552 (+6%) | 11mo | $230,000 | $148 | 42 |
| 611 Manor Dr | 0.75mi | 3/2.0 (-1) | 1,526 (+4%) | 14mo | $295,500 | $194 | 40 |
| 1307 Granville Rd | 0.69mi | 3/1.5 (-1) | 1,650 (+12%) | 24mo | $287,500 | $174 | 18 |
Match score weights: distance 35% · size 25% · config 20% · recency 20%. Top-matched comps best support the ARV.
Projected returns pro-forma
-3.0% appreciation · 1.63% rent growth · sell at horizon
- IRR
- 10.0%
- Equity multiple
- 1.39×
- Total profit
- $9,794
- Equity at exit
- $13,404
- IRR
- 17.9%
- Equity multiple
- 2.37×
- Total profit
- $34,562
- Equity at exit
- $7,773
Cash invested: $25,172 (down + closing). Projections, not guarantees.
Landlord ↔ Tenant lean methodology
- Overall (STATE)
- 73 Landlord-Friendly
- State Ohio
- 73 Landlord-Friendly · R+6
- County
- — inherits STATE
- City
- — inherits STATE
ZIP-level market 43055
- Rents YoY
- 1.6%
- Active inventory
- 204
- Price-to-rent
- 4.8×
Monthly cashflow live
- Estimated rent
- $1,560 medium interval (Pro) →
- Mortgage (P&I)
- −$471
- Tax from tax record
- −$255 /mo · $3,056/yr
- Insurance
- −$37
- Flood insurance flood zone
- −$56 /mo · $666/yr
- HOA
- −$0
- Vacancy / Maint / Mgmt
- −$328
- Net cashflow
- $414
Break-even live
UW: 25.0% down · 7.5% · 30yr · 1.5% tax · 5.0% vac · 8.0% maint · 8.0% mgmt
Financing live
Cash to close
- Down payment
- $22,475
- Closing costs
- $2,697
- Reserves months
- —
- Total cash needed
- —
Loan-product check · same deal, 3 products live
Conventional
25% down · 7.5% · 30yr
- Down + closing
- —
- Monthly P&I
- —
- Monthly cashflow
- —
- DSCR
- —
- Eligible?
- —
Personal DTI + credit; lowest rate.
DSCR
20% down · 8.5% · 30yr
- Down + closing
- —
- Monthly P&I
- —
- Monthly cashflow
- —
- DSCR
- —
- Eligible?
- —
No personal income docs; deal must DSCR.
Hard money
10% down · 12.0% · 12mo
- Down + closing
- —
- Monthly P&I
- —
- Monthly cashflow
- —
- DSCR
- —
- Eligible?
- —
Short-term bridge; refi at stabilization.
Rent comps 1 comps
| Address | Beds | Baths | Sqft | Rent | $/sqft | DOM | Units | Dist |
|---|---|---|---|---|---|---|---|---|
| 923 Empire Dr Unit 923D Newark, OH | 3.0 | 1.5 | 900 | $1,195 | $1.33 | 23d | 1 | 1.30mi |
Listing history 4 events
-
2026-05-23status Pending
-
2026-05-15price $89,900
-
2026-05-11$124,900 Active
-
2026-05-05historical $124,900
ⓘ Source: listings_history table (triggers on properties + properties_extension) + one-shot
backfill from property_details.listing_events for pre-trigger history.
Tax reassessment forecast OH · Partial reset (capped growth)
- Current annual tax
- $3,056 · $255/mo
- Projected year-2 tax
- $3,056 · $255/mo
- Expected delta
- $0/yr ($0/mo · 0.0%)
ⓘ Screening estimate from a state-policy table — verify with the county assessor before closing.
Climate risk First Street
- Flood 7/10 Severe FEMA zone X (unshaded) · 76% chance over 30 yrs
- Wildfire 1/10 Low
- Heat 3/10 Moderate 6 d/yr ≥100°F today · 16 d/yr by 30 yrs out
- Wind 2/10 Low
- Air quality 2/10 Low 1 unhealthy d/yr today · 3 by 30 yrs out
Nearby sold comps map
Loading sold comps map…
Walkable amenities ~0.75 mi
Loading nearby amenities…
Taxation est. · year 1
- Rental income
- $18,723
- − Mortgage interest
- −$5,036
- − Property taxes
- −$3,056
- − Insurance
- −$1,116
- − Repairs & maintenance
- −$1,498
- − Management
- −$1,498
- − Depreciation
- −$2,615
- Taxable income
- $3,905
- Est. tax owed @ 24.0%
- −$937
- After-tax cash flow
- $4,025/yr
For passive investors: Depreciation is non-cash, so a rental often shows a tax loss while cash-flowing — sheltering income. Rental losses are passive: they offset passive income freely, and up to $25,000/yr can offset ordinary (W-2) income if you actively participate and your MAGI is under $100k (phasing out to $0 by $150k); unused losses carry forward. On sale, claimed depreciation is recaptured at up to 25%, and gains may owe capital-gains tax (a 1031 exchange can defer both). Figures are a year-1 estimate at your 24.0% rate — not tax advice; consult a CPA.
Schools (NCES district)
- District
- Newark City
- NCES district ID
- 3904445
- Math proficiency
- 48% ▼ -12.00%
- Reading proficiency
- 56% ▼ -3.00%
- Median HH income
- $38,662
- Composite
- 43.33/100
- National rank
- #3034
- State rank
- #431 of 656 in OH
Livability — Newark
- Score
- 69/100
- State rank
- #493
- US rank
- #8263
Category grades
Schools grade is shown separately in the Schools card above.
Census & demographics
- Census place
- Newark, OH
- County
- Licking County · 109,194 people
- City population
- 63,281
- Metro
- Columbus, OH
- Population (ZIP)
- 63,281
- Household income
- $63,974
- Rent vs Own
- Severe rent burden
- 2269.0
Population outlook (Licking County) Hauer SSP2
- Today (2025)
- 178,210 people
- By 2030
- 180,917 · +1.5%
- By 2040
- 183,885 · +3.2%
- By 2050
- 182,985 · +2.7%
- By 2075
- 178,377 · +0.1%
- By 2100
- 161,075 · -9.6%
Race, ethnicity, and origin ACS 2023
- Neighborhood character
- Predominantly White (89%)
- Race & ethnicity
- White 89% Two or more races 5% Black 3% Hispanic / Latino 2%
- Common ancestry
- Slovak 2% Romanian 2% Lithuanian 2%
- Foreign-born
- 2% · Canada
- Languages at home
- 96% English-only · Spanish 2% Arabic 1%
Political lean MEDSL · Licking
- 2024 margin
- Solid R (+30.0) · D 34.5% · R 64.6%
- 2008→2024 swing
- -14.2pp toward R · 2008: -15.8pp · 2024: -30.0pp
- All cycles
- 2024: R+30.0 2020: R+28.1 2016: R+28.9 2012: R+14.7 2008: R+15.8
Not yet ingested
- Civics
- —
Market trends
- HPI YoY
- ▼ -253.54%
- Current HPI
- 247.9425
- Rent YoY
- ▲ 1.63%
- Metro
- Columbus, OH
- State GDP YoY
- ▲ 1.98%
- F500 in state
- 48
Industry mix (Fortune 500 HQ in OH)
| Industry | F500 HQs | Revenue |
|---|---|---|
| Insurance | 3 | $145B |
|
||
| Industrial Machinery | 3 | $49B |
|
||
| Financial Services | 3 | $24B |
|
||
| Consumer Goods | 2 | $93B |
|
||
| Aerospace / Defense | 2 | $47B |
|
||
| Utilities | 2 | $33B |
|
||
Price history
-28.0% since first listed4 events — show timeline
- 2026-05-23 Pending — CBRMLS
- 2026-05-15 Price Changed $89,900 CBRMLS
- 2026-05-11 Listed $124,900 CBRMLS
- 2026-05-05 Coming Soon $124,900 CBRMLS
Property tax history
+6.7%/yrLatest (2025): $3,056 · +2.2% YoY. Source: county tax records.
Cash-flow waterfall
monthlySold comps — $/sqft
last 12 mo · ≤1 miLoading sold comps…