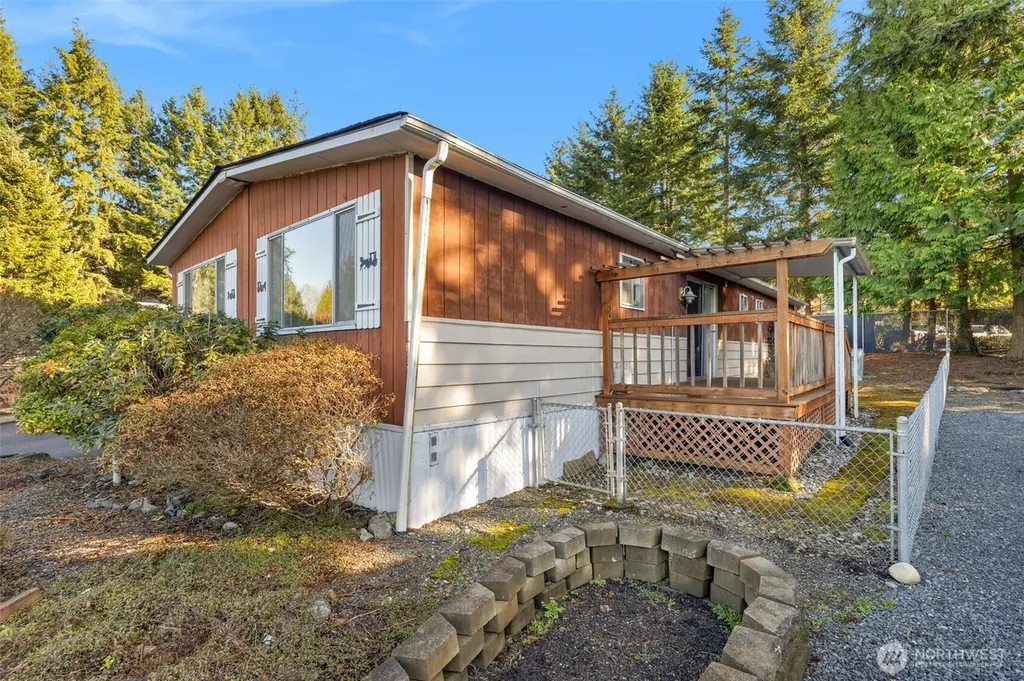
2200 196th St SE #76 · Bothell East, WA
Flood risk No data
- FEMA flood zone
- —
- Chance of flooding over 30 yrs
- —
- Est. flood insurance / yr
- —
Fire risk No data
- Est. fire insurance / yr
- —
Heat risk No data
- Hot days now (above threshold)
- —
- Hot days in 30 yrs
- —
Wind risk No data
- Chance of severe wind over 30 yrs
- —
Air-quality risk No data
- Unhealthy air days now
- —
- Unhealthy air days in 30 yrs
- —
Risk factors via First Street. Map © Google.
Why this score? — see what drove the B grade
The composite is a weighted blend of 9 inputs, each scored 0–100. Each bar is that input's sub-score; the figure is the points it added to the 100-point composite (weight × sub-score).
- Cash flow +30.0/30.0
- 1% rule +10.0/10.0
- DSCR +10.0/10.0
- ARV discount +7.5/15.0
- Schools +6.7/10.0
- Livability +4.5/5.0
- Rent growth +3.1/5.0
- Condition / age +2.5/5.0
- Appreciation +0.0/10.0
$75,000
🖨 Deal sheet 📄 Offer letter ✓ Due diligence
Listing remarks
Is there a 3-bed home in Bothell under $90K with a new roof and yard space? Yes: this updated 3-bed, 1.75-bath manufactured home in Alder Trails 55+ community offers 1,344 sq ft of comfort with a new roof in 2025, A/C, and a shaded deck off the kitchen. Enjoy a large detached shed with workspace, a partially fenced yard, and sunny patio space. Bonus: three months FREE space rent for qualified buyers. Inside, you’ll find laminate wood floors, open living and dining areas, and two baths including a private primary suite. Covered carport parking is included. Located in Alder Trails, a well-kept community with a clubhouse, pickleball court, gym, BBQ area, and more. Close to Mill Creek, Ly
Key facts
- Clubhouse
- Shaded deck
- Sunny patio space
Tags
Neighborhood map
What this means for you Summary
Snapshot
- This is a 3-bed/2.0-bath manufactured listed at $75k.
Deal economics
- At list price, monthly cash flow is $2k ($22k/yr) — positive.
- The deal already cash-flows at list — no discount required.
- Meets the 1% rule at list price ($3k rent vs $75k).
- Recommended offer: $66k (12.0% below list) — sets the bar for market timing.
- Cap rate 35.8% vs local median 1.4% in Bothell East — top-decile yield for the area; either an underpriced asset or a hidden risk that comps aren't pricing in. Stress-test before assuming the spread holds.
Location & tenants
- Location reads 90/100 on livability (#5 in WA, #104 nationally) — a professional / high-income tenant draw. Strengths: schools A+, crime A+, amenities A+; Watch: cost of living F.
- Northshore School District (suburban): math 69% / reading 78% proficiency, ranked #9 of 291 in WA (top 3%) — strong family-tenant draw, lease renewals of 3-5y typical; only 12% free/reduced lunch — higher-income household profile.
- Market conditions: Rents rising (+2.4%/yr); 451 active listings in the ZIP; 29 comparable units currently listed for rent nearby; rentals leasing fast (median 5d on market — plan ~1-2 weeks tenant-placement turnaround); high-income renter base; 3,982 units permitted in Snohomish County in 2024 (1,492 in 5+ unit buildings).
Forward outlook
- Local home prices are declining (-3.0%/yr); year-one equity from $519 of loan paydown is wiped out by about $2k of value loss. Plan a longer hold.
- Snohomish County population projected at +30% by 2050 — long-run rental-demand tailwind backs the buy-and-hold thesis.
- At projected returns (-3.0% appreciation + 2.4% rent growth), your $21k cash investment doubles in ~2 years — after that, you're playing with house money.
Negotiation context
- It's been on market 126 days — a 12% lower offer ($66k) is reasonable based on typical stale-listing flexibility.
- 9 sale attempts since 23y ago; this cycle's ask has dropped $10k (12%) from the opening price — seller is motivated, your offer sets the floor, not the list.
Questions for the listing agent
- It's been on market 126 days. Have you received any prior offers? Is the seller open to a 12% concession, seller financing, or rate buy-down credit?
- Built in 1976 — when were the roof, HVAC, electrical panel, plumbing, and water heater last replaced?
- Why hasn't it sold? Are there any deal-killer items the seller is aware of (foundation, flood, title, zoning, code violations)?
- Is there a deadline driving the sale (1031 exchange, divorce, estate, relocation)? That informs how much negotiation room exists.
- Schools are A-rated — typically a magnet for longer-tenancy family renters. What's the average tenant stay here, and is there a school-zone premium baked into asking?
- What's the average days-on-market for RENTAL listings here right now (not sales)? A rising rental-DOM trend means longer vacancies and softer asking-rent achievability than the comps imply.
- What's the recent tenant-quality profile in this submarket — average credit score on applications, eviction rate, late-payment / NSF rate, and stable-employment percentage? A property-management company in the area should have these aggregated.
- How much new for-sale + rental construction is in the pipeline within 1–3 miles? Heavy new supply typically softens prices + rents 12–24 months out; constrained supply supports both.
Investment metrics
- 1% rule
- 3.96% ✓
- Cap rate
- 35.81%
- Cash-on-cash
- 105.41%
- DSCR
- 5.69
- GRM
- 2.1
CMA / ARV
- ARV (median comp)
- $150,356
- List price
- $75,000
- Delta
- -50.12%
- Verdict
- UNDERPRICED
- Comps
- 12 within 1.0 mi
Show comp detail 12 sales within ~0.75 mi
| Address | Dist | Beds/Ba | Sqft | Sold | Price | $/sf | Match |
|---|---|---|---|---|---|---|---|
| 2200 196th St SE #66 | 0.00mi | 3/2.0 | 1,344 (0%) | 0mo | $125,000 | $93 | 100 |
| 2200 196th St SE #80 | 0.00mi | 2/2.0 (-1) | 1,344 (0%) | 12mo | $65,600 | $49 | 85 |
| 2200 196th St SE #30 | 0.00mi | 2/2.0 (-1) | 1,248 (-7%) | 3mo | $110,000 | $88 | 81 |
| 2200 196th St SE #96 | 0.00mi | 3/2.0 | 1,440 (+7%) | 9mo | $80,000 | $56 | 80 |
| 2200 196th St SE #17 | 0.00mi | 2/2.0 (-1) | 1,404 (+4%) | 11mo | $211,400 | $151 | 78 |
| 2200 SE 196th St #2 | 0.00mi | 2/2.0 (-1) | 1,440 (+7%) | 8mo | $75,000 | $52 | 77 |
| 2200 196th St SE #87 | 0.00mi | 3/2.0 | 1,440 (+7%) | 15mo | $100,000 | $69 | 76 |
| 19229 22nd Ave SE | 0.29mi | 2/2.0 (-1) | 1,344 (0%) | 17mo | $430,000 | $320 | 68 |
| 2000 192nd St SE #116 | 0.32mi | 2/2.0 (-1) | 1,414 (+5%) | 5mo | $429,000 | $303 | 67 |
| 19315 22nd Ave SE | 0.25mi | 3/2.0 | 1,440 (+7%) | 12mo | $365,000 | $253 | 67 |
| 2200 196th St SE #27 | 0.00mi | 2/2.0 (-1) | 1,152 (-14%) | 12mo | $77,000 | $67 | 62 |
| 1332 192nd St SE #55 | 0.62mi | 2/2.0 (-1) | 1,188 (-12%) | 13mo | $174,950 | $147 | 36 |
Match score weights: distance 35% · size 25% · config 20% · recency 20%. Top-matched comps best support the ARV.
Projected returns pro-forma
-3.0% appreciation · 2.37% rent growth · sell at horizon
- IRR
- —
- Equity multiple
- 5.93×
- Total profit
- $103,498
- Equity at exit
- $11,183
- IRR
- —
- Equity multiple
- 12.14×
- Total profit
- $233,967
- Equity at exit
- $6,485
Cash invested: $21,000 (down + closing). Projections, not guarantees.
Landlord ↔ Tenant lean methodology
- Overall (STATE)
- 28 Tenant-Leaning
- State Washington
- 28 Tenant-Leaning · D+8
- County
- — inherits STATE
- City
- — inherits STATE
ZIP-level market 98012
- Rents YoY
- 2.4%
- Active inventory
- 451
- Price-to-rent
- 2.1×
Monthly cashflow live
- Estimated rent
- $2,971 high interval (Pro) →
- Mortgage (P&I)
- −$393
- Tax from tax record
- −$78 /mo · $938/yr
- Insurance
- −$31
- HOA
- −$0
- Vacancy / Maint / Mgmt
- −$624
- Net cashflow
- $1,845
Break-even live
UW: 25.0% down · 7.5% · 30yr · 1.5% tax · 5.0% vac · 8.0% maint · 8.0% mgmt
Financing live
Cash to close
- Down payment
- $18,750
- Closing costs
- $2,250
- Reserves months
- —
- Total cash needed
- —
Loan-product check · same deal, 3 products live
Conventional
25% down · 7.5% · 30yr
- Down + closing
- —
- Monthly P&I
- —
- Monthly cashflow
- —
- DSCR
- —
- Eligible?
- —
Personal DTI + credit; lowest rate.
DSCR
20% down · 8.5% · 30yr
- Down + closing
- —
- Monthly P&I
- —
- Monthly cashflow
- —
- DSCR
- —
- Eligible?
- —
No personal income docs; deal must DSCR.
Hard money
10% down · 12.0% · 12mo
- Down + closing
- —
- Monthly P&I
- —
- Monthly cashflow
- —
- DSCR
- —
- Eligible?
- —
Short-term bridge; refi at stabilization.
Rent comps 29 comps
| Address | Beds | Baths | Sqft | Rent | $/sqft | DOM | Units | Dist |
|---|---|---|---|---|---|---|---|---|
| 2009 196th St SE Bothell, WA | 2.0 | 2.0 | 1017 | $2,355 | $2.32 | 44d | 1 | 0.16mi |
| 2115 201st Pl SE Unit P3 Bothell, WA | 3.0 | 3.0 | 1753 | $2,999 | $1.71 | 5d | 1 | 0.17mi |
| 19905 Bothell Everett Hwy Bothell, WA | 3.0 | 1.0–3.0 | 1244 | $3,560 | $2.86 | 2d | 1 | 0.20mi |
| 19324 22nd Ave SE #4 Bothell, WA | 3.0 | 2.5 | 1195 | $2,950 | $2.47 | 24d | 1 | 0.22mi |
| 2422 Stafford Way Bothell, WA | 4.0 | 2.5 | 1869 | $3,800 | $2.03 | 4d | 1 | 0.28mi |
| 20225 Bothell Everett Hwy Bothell, WA | 1.0–3.0 | 1.0–2.0 | 893 | $2,942 | $3.29 | 2d | 38 | 0.29mi |
| 1730 196th St SE Bothell, WA | 1.0–3.0 | 1.0–2.0 | 924 | $3,215 | $3.48 | 2d | 1 | 0.32mi |
| 19928 Bothell Everett Hwy Bothell, WA | 1.0–2.0 | 1.0–2.0 | 813 | $2,307 | $2.84 | 2d | 12 | 0.35mi |
| 20310 Bothell Everett Hwy Bothell, WA | 2.0–3.0 | 1.5–2.5 | 1195 | $2,880 | $2.41 | 44d | 1 | 0.47mi |
| 2201 192nd St SE Bothell, WA | 3.0 | 2.5 | 1703 | $3,400 | $2.00 | 20d | 1 | 0.51mi |
| 18930 Bothell Everett Hwy Unit V101 Bothell, WA | 2.0 | 2.0 | 980 | $2,225 | $2.27 | 5d | 1 | 0.52mi |
| 1910 189th Pl SE Bothell, WA | 2.0 | 2.0 | 1082 | $2,395 | $2.21 | 20d | 1 | 0.54mi |
| 18930 Bothell Everett Hwy Bothell, WA | 1.0–2.0 | 1.0–2.0 | 933 | $2,225 | $2.38 | 15d | 3 | 0.56mi |
| 18930 Bothell Everett Hwy Bothell, WA | 1.0–2.0 | 1.0–2.0 | 933 | $2,325 | $2.49 | 18d | 3 | 0.56mi |
| 2129 Maltby Rd Bothell, WA | 3.0 | 2.0 | 1207 | $2,195 | $1.82 | 5d | 4 | 0.57mi |
| 1322 194th St SE Bothell, WA | 4.0 | 3.5 | 1800 | $3,550 | $1.97 | 3d | 1 | 0.57mi |
| 20520 Bothell Everett Hwy Bothell, WA | 1.0–2.0 | 1.0–2.0 | 845 | $2,317 | $2.74 | 2d | 9 | 0.58mi |
| 1805 186th Pl SE Bothell, WA | 1.0–3.0 | 1.0–2.0 | 1043 | $2,746 | $2.63 | 2d | 13 | 0.72mi |
| 2319 210th St SE Bothell, WA | 4.0 | 2.5 | 1742 | $3,800 | $2.18 | 24d | 1 | 0.79mi |
| 20707 31st Dr SE Bothell, WA | 2.0 | 2.0 | 1334 | $2,740 | $2.05 | 18d | 1 | 0.86mi |
| 622 204th St SE Bothell, WA | 4.0 | 2.0 | 1800 | $3,400 | $1.89 | 3d | 1 | 1.00mi |
| 1225 183rd St SE Bothell, WA | 1.0–3.0 | 1.0–2.0 | 952 | $3,061 | $3.21 | 2d | 31 | 1.12mi |
| 18331 35th Dr SE Bothell, WA | 3.0 | 2.5 | 1740 | $3,518 | $2.02 | 2d | 1 | 1.17mi |
| 3612 183rd Ln SE Bothell, WA | 3.0 | 2.5 | 1732 | $3,350 | $1.93 | 44d | 1 | 1.21mi |
| 18213 36th Ave SE Bothell, WA | 3.0 | 2.5 | 1740 | $3,400 | $1.95 | 2d | 1 | 1.26mi |
| 21623 16th Dr SE Bothell, WA | 1.0–3.0 | 1.0–2.0 | 990 | $3,295 | $3.33 | 2d | 11 | 1.27mi |
| 17615 Brook Blvd Bothell, WA | 3.0 | 1.5 | 1464 | $3,395 | $2.32 | 3d | 1 | 1.30mi |
| 17606 Brook Blvd Bothell, WA | 3.0 | 2.0 | 1614 | $3,400 | $2.11 | 5d | 1 | 1.30mi |
| 19626 Filbert Rd Bothell, WA | 3.0 | 1.0 | 1084 | $2,800 | $2.58 | 24d | 1 | 1.37mi |
Listing history 38 events
-
2026-06-18days on market $75,000 Active 126 DOM
-
2026-06-17days on market $75,000 Active 125 DOM
-
2026-06-16days on market $75,000 Active 124 DOM
-
2026-06-15days on market $75,000 Active 123 DOM
-
2026-06-13days on market $75,000 Active 121 DOM
-
2026-06-13days on market $75,000 Active 120 DOM
-
2026-06-09days on market $75,000 Active 117 DOM
-
2026-06-08days on market $75,000 Active 116 DOM
-
2026-06-07pricedays on market $75,000 Active 115 DOM
-
2026-06-04days on market $78,000 Active 112 DOM
-
2026-06-03days on market $78,000 Active 111 DOM
-
2026-06-02pricedays on market $78,000 Active 110 DOM
-
2026-06-01days on market $85,000 Active 109 DOM
-
2026-05-31days on market $85,000 Active 108 DOM
-
2026-02-12$85,000 Active
-
2023-07-25soldstatus $85,000 Closed
-
2023-07-05status Pending
-
2023-06-14status Active
-
2023-06-12status Pending
-
2023-06-03status Active
-
2023-05-30status Pending
-
2023-05-09price $85,000
-
2023-02-22price $135,000
-
2023-01-30price $140,000
-
2023-01-13price $153,000
-
2022-11-09$170,000 Active
-
2019-02-06soldstatus $80,000 Sold
-
2019-01-18status Pending
-
2018-12-12status Active
-
2018-12-04status Pending Inspection
-
2018-11-30status Active
-
2018-11-17status Pending Inspection
-
2018-11-08price $90,000
-
2018-11-08status Active
-
2018-11-06historical Pending - Backup Offer Requested
-
2018-09-21$98,500 Active
-
2003-10-14soldstatus $25,000
-
2003-07-19$27,919
ⓘ Source: listings_history table (triggers on properties + properties_extension) + one-shot
backfill from property_details.listing_events for pre-trigger history.
Tax reassessment forecast WA · Resets to sale price
- Current annual tax
- $938 · $78/mo
- Projected year-2 tax
- $938 · $78/mo
- Expected delta
- $0/yr ($0/mo · -0.0%)
ⓘ Screening estimate from a state-policy table — verify with the county assessor before closing.
Nearby sold comps map
Loading sold comps map…
Walkable amenities ~0.75 mi
Loading nearby amenities…
Taxation est. · year 1
- Rental income
- $35,656
- − Mortgage interest
- −$4,201
- − Property taxes
- −$938
- − Insurance
- −$375
- − Repairs & maintenance
- −$2,853
- − Management
- −$2,853
- − Depreciation
- −$2,182
- Taxable income
- $22,256
- Est. tax owed @ 24.0%
- −$5,341
- After-tax cash flow
- $16,795/yr
For passive investors: Depreciation is non-cash, so a rental often shows a tax loss while cash-flowing — sheltering income. Rental losses are passive: they offset passive income freely, and up to $25,000/yr can offset ordinary (W-2) income if you actively participate and your MAGI is under $100k (phasing out to $0 by $150k); unused losses carry forward. On sale, claimed depreciation is recaptured at up to 25%, and gains may owe capital-gains tax (a 1031 exchange can defer both). Figures are a year-1 estimate at your 24.0% rate — not tax advice; consult a CPA.
Schools (NCES district)
- District
- Northshore School District
- NCES district ID
- 5305910
- Math proficiency
- 69% ▼ -3.00%
- Reading proficiency
- 78% ▼ -1.00%
- Median HH income
- $92,951
- Composite
- 67.41/100
- National rank
- #826
- State rank
- #9 of 291 in WA
Livability — Bothell East
- Score
- 90/100
- State rank
- #5
- US rank
- #104
Category grades
Schools grade is shown separately in the Schools card above.
Census & demographics
- Census place
- Bothell East, WA
- County
- Snohomish County · 786,756 people
- Metro
- Seattle-Tacoma-Bellevue, WA
- Population (ZIP)
- 77,041
- Household income
- $146,144
- Rent vs Own
- Severe rent burden
- 1904.0
Population outlook (Snohomish County) Hauer SSP2
- Today (2025)
- 899,800 people
- By 2030
- 960,975 · +6.8%
- By 2040
- 1,074,447 · +19.4%
- By 2050
- 1,171,954 · +30.2%
- By 2075
- 1,384,849 · +53.9%
- By 2100
- 1,497,296 · +66.4%
Race, ethnicity, and origin ACS 2023
- Neighborhood character
- Diverse neighborhood (Simpson 0.65)
- Race & ethnicity
- White 51% Asian 28% Hispanic / Latino 10% Two or more races 9% Black 3%
- Hispanic origin (detail)
- Mexican 6%
- Common ancestry
- Portuguese 4% Italian 3% Slovak 2%
- Foreign-born
- 29% · Canada, China, South Korea
- Languages at home
- 65% English-only · Other Asian/Pacific 8% Other Indo-European 7% Spanish 6%
Political lean MEDSL · Snohomish
- 2024 margin
- D (+19.0) · D 57.8% · R 38.9% · Other 3.3%
- 2008→2024 swing
- +0.1pp no change · 2008: 18.9pp · 2024: 19.0pp
- All cycles
- 2024: D+19.0 2020: D+20.6 2016: D+16.6 2012: D+16.2 2008: D+18.9
Not yet ingested
- Civics
- —
Market trends
- HPI YoY
- ▼ -780.30%
- Current HPI
- 366.3746
- Rent YoY
- ▲ 2.37%
- Metro
- Seattle-Tacoma-Bellevue, WA
- State GDP YoY
- ▲ 4.65%
- F500 in state
- 22
Industry mix (Fortune 500 HQ in WA)
| Industry | F500 HQs | Revenue |
|---|---|---|
| Retail | 2 | $269B |
|
||
| Technology / Retail | 1 | $638B |
|
||
| Technology | 1 | $245B |
|
||
| Telecommunications | 1 | $38B |
|
||
| Food / Beverage | 1 | $36B |
|
||
| Automotive / Trucks | 1 | $34B |
|
||
Price history
+204.5% since first listed24 events — show timeline
- 2026-02-12 Listed $85,000 NWMLS as Distributed by MLS Grid
- 2023-07-25 Sold (MLS) $85,000 NWMLS as Distributed by MLS Grid
- 2023-07-05 Pending — NWMLS as Distributed by MLS Grid
- 2023-06-14 Relisted — NWMLS as Distributed by MLS Grid
- 2023-06-12 Pending — NWMLS as Distributed by MLS Grid
- 2023-06-03 Relisted — NWMLS as Distributed by MLS Grid
- 2023-05-30 Pending — NWMLS as Distributed by MLS Grid
- 2023-05-09 Price Changed $85,000 NWMLS as Distributed by MLS Grid
- 2023-02-22 Price Changed $135,000 NWMLS as Distributed by MLS Grid
- 2023-01-30 Price Changed $140,000 NWMLS as Distributed by MLS Grid
- 2023-01-13 Price Changed $153,000 NWMLS as Distributed by MLS Grid
- 2022-11-09 Listed $170,000 NWMLS as Distributed by MLS Grid
- 2019-02-06 Sold (MLS) $80,000 NWMLS as Distributed by MLS Grid
- 2019-01-18 Pending — NWMLS as Distributed by MLS Grid
- 2018-12-12 Relisted — NWMLS as Distributed by MLS Grid
- 2018-12-04 Pending — NWMLS as Distributed by MLS Grid
- 2018-11-30 Relisted — NWMLS as Distributed by MLS Grid
- 2018-11-17 Pending — NWMLS as Distributed by MLS Grid
- 2018-11-08 Price Changed $90,000 NWMLS as Distributed by MLS Grid
- 2018-11-08 Relisted — NWMLS as Distributed by MLS Grid
- 2018-11-06 Contingent — NWMLS as Distributed by MLS Grid
- 2018-09-21 Listed $98,500 NWMLS as Distributed by MLS Grid
- 2003-10-14 Sold (MLS) $25,000 NWMLS as Distributed by MLS Grid
- 2003-07-19 Listed $27,919 NWMLS as Distributed by MLS Grid
Property tax history
+6.6%/yrLatest (2026): $938 · +13.7% YoY. Source: county tax records.
Cash-flow waterfall
monthlySold comps — $/sqft
last 12 mo · ≤1 miLoading sold comps…